Abstract
Objective
Adiponectin is one of several important, metabolically active cytokines secreted from adipose tissue. Epidemiologic studies have associated low circulating levels of this adipokine with multiple metabolic disorders including obesity, insulin resistance, type II diabetes, and cardiovascular disease. To investigate how enhanced adiponectin-mediated changes in metabolism in vivo, we generated transgenic mice which specifically overexpress the gene coding for adiponectin receptor 1 (AdipoR1) in mouse macrophages using the human scavenger receptor A-I gene (SR-AI) enhancer/promoter. We found that macrophage-specific AdipoR1 transgenic mice (AdR1-TG) presented reduced whole body weight, fat accumulation and liver steatosis when these transgenic mice were fed with a high fat diet. Moreover, these macrophage AdR1-TG mice exhibited enhanced whole-body glucose tolerance and insulin sensitivity with reduced proinflammatory cytokines, MCP-1 and TNF-α, both in the serum and in the insulin target metabolic tissues. Additional studies demonstrated that these macrophage AdR1-TG animals exhibited reduced macrophage foam cell formation in the arterial wall when these transgenic mice were crossed with a low-density lipoprotein receptor (Ldlr) deficient mouse model.
Conclusions
These results suggest that AdipoR1 overexpressed in macrophages can physiologically modulate metabolic activities in vivo by enhancing adiponectin actions in distal metabolically active tissues. The AdipoR1 modified macrophages provide unique interactions with the residented tissues/cells, suggesting a novel role of macrophage adiponectin receptor in improving metabolic disorders in vivo.
Keywords: adiponectin receptor, macrophage foam cells, metabolic syndrome
1. Introduction
Metabolic Syndrome is present in an estimated ~35% of adults in the United States [1], and is a powerful risk factor not only for the future development of type II diabetes but also cardiovascular disease [2–4]. Metabolic Syndrome, prediabetes, type II diabetes, and cardiovascular disease are linked by a common pathophysiological process that involves insulin resistance, dyslipidemia, and inflammation, and the progression of these diseases constitute the spectrum of cardiometabolic disease. Even so, the factor(s) that is largely responsible for the disparate trait cluster that comprises the Metabolic Syndrome, and the mechanistic link between insulin resistance and vascular disease, have not been fully elucidated. A better understanding of cardiometabolic disease pathophysiology is critical for developing improved modalities for treating and preventing type II diabetes and vascular disease.
Adiponectin (also known as apM1, AdipoQ, Gbp28 and Acrp30) is one of several important, metabolically active cytokines secreted from adipose tissue, which circulates in high and low molecular weight multimeric forms [5–7]. Epidemiological evidence has indicated that plasma adiponectin levels are reduced in patients with insulin resistance, diabetes, obesity, or cardiovascular disease [8–10], and these relationships are more strongly related to a decrement in the high molecular weight form than the low molecular weight form [6,7]. In the circulation, adiponectin exerts bioeffects on multiple cell types and has insulin-sensitizing, anti-inflammatory, and anti-atherosclerotic properties. For example, adiponectin has been shown to augment insulin sensitivity and lipid oxidation in skeletal muscle and adipocytes [11, 12] and to reduce hepatic glucose production in liver [13, 14]. Accordingly, administration of adiponectin to intact rodents improved glucose tolerance and decreased plasma triglycerides [11, 12]. In addition, adiponectin can inhibit both the inflammatory process and atherogenesis by suppressing the migration of monocytes/macrophages and their transformation into foam cells in the vascular wall [15, 16]. Transgenic and knockout mouse models have confirmed the importance of adiponectin in metabolic diseases. Overexpression of the adiponectin gene protected ob/ob mice from diabetes and prevented apolipoprotein E-deficient mice from developing atherosclerosis [17]. Furthermore, overexpression of adiponectin in fat tissues resulted in increased circulating adiponectin levels, which in turn led to improved insulin sensitivity [18, 19]. There is also evidence that adiponectin gene polymorphisms may be associated with hypoadiponectinemia, together with insulin resistance and type II diabetes [20].
Two cell-surface trans-membrane receptors have been identified for adiponectin, AdipoR1 and AdipoR2 [21], and adiponectin action is known to signal through these receptors and the docking protein APPL1 [22]. In muscle and liver cells, signal transduction involves the phosphorylation and activation of AMP-activated kinase (AMPK) [21], which plays a pivotal role in nutrient sensing and substrate metabolism. Adiponectin interacts with T-cadherin in pro-B-cells, however, the biological significance of this non-transmembrane receptor is not clear in other cells since T-cadherin lacks the transmembrane and cytoplasmic domains [23, 24]. AdipoR1 is abundantly expressed in skeletal muscle and macrophages, whereas AdipoR2 is predominantly expressed in the liver [21]. Simultaneous disruption of both AdipoR1 and AdipoR2 abolished adiponectin binding and actions, resulting in increased liver triglyceride content, inflammation and oxidative stress in adipose tissue, and thus leading to insulin resistance and marked glucose intolerance [25]. Recently, these two receptors have also been found to be expressed in human macrophages [26, 27] with AdipoR1 predominating in these cells [27, 28]. Even so, the functions of AdipoR1/2 in macrophages remain poorly defined.
Macrophages are a heterogeneous and plastic population of phagocytic cells, which arise from circulating myeloid-derived blood monocytes, enter target tissues, and gain phenotypic and functional attributes partly determined by their tissue of residence [29]. Macrophages play a critical role in both metabolic and vascular components of cardiometabolic disease. In the vascular wall, macrophages accumulate lipid in the presence of excess oxidized and non-oxidized LDL, then transition to foam cells, and initiate the fatty streak which is the hallmark lesion of atherosclerosis [30]. Recent attention has also focused on the important role of macrophages in insulin resistance, the Metabolic Syndrome, and type II diabetes [31, 32]. In obesity and insulin resistance, adipose tissue contains an increased number of resident macrophages [33, 34], which secrete cytokines and other factors that cross-talk with adipocytes. This alters the systemic release of adipocytokines from adipose tissue, causing dysmetabolism in multiple organs. Thus, the proinflammatory state, established in adipose tissue as a consequence of the increase in resident activated macrophages (i.e., M1 macrophages), is believed to be instrumental in the development of systemic insulin resistance and other traits that characterize the Metabolic Syndrome [35]. There is also accumulating evidence that macrophages reside in skeletal muscle, and could contribute to insulin resistance by directly impairing insulin action in this key target tissue [36]. In support of the central role of the macrophages [37], mice fed a high-fat diet were protected against glucose intolerance and insulin resistance when inflammatory pathways in macrophages were genetically disrupted [38].
Recently, we engineered transgenic mice to synthesize and secrete adiponectin from macrophages in an attempt to augment adiponectin action in the microenvironment of the macrophage [39, 40]. This resulted in a lean, insulin sensitive, diabetes-resistant, and atherosclerosis-resistant phenotype, and gave us the idea that the adiponectin-macrophage axis could regulate multiple key components of the Metabolic Syndrome. However, this model failed to rigorously test this hypothesis since the transgenic mice also exhibited increased circulating adiponectin concentrations, and, therefore, higher adiponectin could be influencing multiple tissues directly, not necessarily as a result of a specific interaction with macrophages. The current studies have developed a novel approach to manipulate adiponectin action at the level of the macrophage in order to examine systemic effects related to metabolic diseases by genetic manipulation of the major receptor for adiponectin in macrophages, AdipoR1. Our data suggest that alterations in adiponectin effects, solely directed at the macrophage, can explain the co-occurrence of multiple components in the Metabolic Syndrome trait cluster and provide a novel unifying explanation for the pathophysiology of metabolic diseases. Our data, for the first time, suggest that overexpression of AdipoR1 can alter macrophage biology and impact systemic metabolism in vivo. These data point to the central role of macrophages, and the singular ability of adiponectin to regulate macrophage function, in metabolic diseases. Therefore, our studies provide new insights for investigating the mechanisms of metabolism and inflammatory response in vivo.
2. Methods
2.1. Experimental animals
To generate the macrophage AdipoR1 transgenic mice, full length cDNA encoding the AdipoR1 gene with a V5 epitope tag fused at the 3′ end was sub-cloned into a plasmid vector containing the human scavenger receptor A-I gene (SR-AI) enhancer/promoter (5.0 kb) (kindly provided by Dr. Chris Glass, University of California at San Diego). DNA fragments (8.5 kb) starting from the enhancer/promoter to human growth hormone tail were purified before they were microinjected into mouse embryos.
Transgenic animals were created by injections of the appropriate DNA fragments into the pronucleus of inbred C57BL/6 single cell embryos at our Transgenic Animal/Embryonic Stem Cell (TA/ESC) Core at the University of Alabama at Birmingham. All of the confirmed transgenic mice were backcrossed more than 10 generations into the C57BL/6J genetic background before being used for our experiments.
Wild-type and transgenic mice at 20 weeks of age but fed with the high fat diet for 16 weeks were then euthanized and bled by cardiac puncture. Plasma was isolated by centrifugation at 12,000 g for 10 min and stored at −80 °C until analyses were performed.
To investigate the atherosclerotic lesion formation, the AdipoR1 transgenic mice (AdR1-TG) were crossed with the low-density lipoprotein receptor (Ldlr) deficient mice (Jackson Laboratory, Stock Number 002207; Ldlrtm1Her/J), a common model for cardiovascular research. The AdR1-TG/Ldlr and control (WT/Ldlr) mice were fed with a high fat diet (60% kcal% fat) from the Research Diets Company (New Brunswick, NJ) for six months before measuring and analyzing the atherosclerotic lesion regions.
All of these animals were housed in a specific pathogen-free facility with 12-hours light/dark cycles and received a standard laboratory chow diet except for the high fat diet experiments. Only male mice were used for the experiments. All animal procedures were approved by the Institutional Animal Care and Use Committee (IACUC) of the Animal Resources Program (ARP) at the University of Alabama at Birmingham.
2.2. Peritoneal macrophage isolation and culture
Macrophages were isolated from the peritoneum of 20-week-old wild-type or transgenic mice after a priming injection with 2 ml of 3% thioglycollate to elicit macrophage accumulation. Five days after the injection, mice were anesthetized with isoflurane and were injected peritoneally with 5 ml cold PBS with 10 mm EDTA. The PBS lavage containing the peritoneal macrophages was removed, and the process was repeated three times for each mouse. Macrophages from each mouse were cultured separately overnight in media (RPMI) containing 10% FBS after which non-adherent cells were removed by aspiration and the remaining, adherent cells were cultured an additional 6–7 days before they were used for the experiments.
2.3. Determination of cholesterol and triglyceride concentrations in mouse macrophages and plasma
The concentrations of cholesterol and triglyceride in mouse macrophages and plasma were determined using enzymatic colorimetric assays (Wako, Richmond, VA) according to the manufacturer’s protocols. The concentrations of cellular proteins from macrophages were measured with a protein assay kit from Bio-Rad (Hercules, CA).
2.4. Gene expression in metabolic tissues and plasma concentration of insulin, adiponectin
To determine the expression level of genes coding for lipid metabolism and inflammatory cytokines, total RNA was extracted from wild type and transgenic mouse metabolic tissues using a commercially available TRIzol reagent from Invitrogen (Carlsbad, CA) according to the manufacturer’s instructions. The quantitative real-time PCR analysis was using an ABI StepOnePlus Real-Time PCR System. Reactions were carried out in triplicate in a total volume of 20 μl using and a SYBR Green QPCR Master Mix (Applied Biosystems). Quantification was calculated using the starting quantity of the cDNA of interest relative to that of 18S ribosomal cDNA in the same sample.
The insulin or adiponectin levels in mouse plasma were measured using an ultra sensitive mouse insulin ELISA kit from Crystal Chem INC (Downers Grove, IL) or mouse adiponectin ELISA kit from ALPCO (Salem, NH) according to the protocols from the manufacturers.
2.5. Glucose and insulin tolerance testing
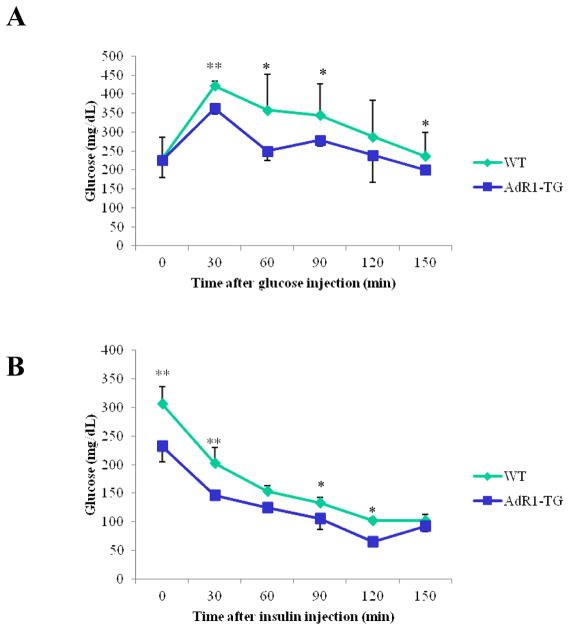
Glucose tolerance testing (GTT) and insulin tolerance testing (ITT) in AdipoR1 transgenic and control mice were performed as described previously (41). Mice were injected with glucose or insulin at 20 weeks of age after consuming the high fat diet for 16 weeks. To determine glucose tolerance, animals were first fasted overnight and then given an intraperitoneal injection of glucose solution (100g glucose/L; 10 μl/g body weight) and glucose concentration was determined in mouse tail blood collected at baseline (prior to injection), and at 30, 60, 90, 120 and 150 minutes post-injection using a HemoCue glucose 201 glucometer (HemoCue USA). To determine insulin tolerance, mice were fasted for 6 hours in the morning of the measurement and then administered an intraperitoneal injection of insulin solution (1.5U insulin/kg body weight). Glucose levels were measured in blood samples collected as above described for the glucose tolerance testing.
2.6. Measurements of glucose metabolism in skeletal muscle and liver
Insulin-stimulated glucose uptake assays in skeletal muscle strips were performed as described previously [42]. For measurement of glucose transport activity, the muscle strips were dissected from control wild-type and transgenic mice at 20 weeks of age, treated with insulin (100 nM) for 30 min at 37°C and then incubated with 3H-2-deoxyglucose for 3 min at 37°C before stopping the reaction by incubation with 1 N NaOH at 70°C for 5 min. Aliquots of the supernatant were centrifuged and added to the scintillation mixtures and then counted for the isotope activities. In these glucose uptake experiments, the distribution space of radiolabeled L-glucose were used to correct for nonspecific carryover of radioactivity with the cells and uptake of hexose by simple diffusion as reported previously [43].
To determine glucose metabolism in liver, primary mouse hepatocytes were isolated and cultured in six-well plates (1.4 × 10⁶ cells per well) in glucose-free DMEM supplemented with 20 mM sodium lactate and 2 mM sodium pyruvate [44]. After 12 hours, the glucose concentration was measured in medium using a glucose assay kit (Sigma 510-A) and normalized to the total protein amount from the whole-cell lysates determined by the Bio-Rad protein assay kit.
2.7. Oil Red O staining of tissue and tissue sections
Mouse livers were dissected from wild type and transgenic mice fed the high fat diet for 20 weeks, then fixed in phosphate-buffered formaldehyde (10%), and prepared with OCT (frozen tissue matrix). The frozen liver tissues were sectioned at a thickness of 5 μm with a Cryostat for a total of 300 μm and lipid accumulating in the tissue sections were detected by staining with Oil red O solution [45].
To quantitate lipid accumulation in arterial walls, mice were euthanized after being fed the high fat diet for six months and the entire aorta was harvested from transgenic and wild type mice through the aortic origin beginning at the base of the aortic valve. The arterial tissues were first fixed in 10% formalin for 90 min; and then washed thoroughly with distilled water. These tissues were then incubated with a working solution of Oil red O for 3 hours before starting the examinations. The percentage of Oil red O positive atherosclerotic lesions were quantitated in the excised aorta between the arch and the common iliac artery in stained en face preparations.
2.8. Cofocal microscopy and Western blot analysis
For cofocal microscopy, mouse fat pad samples were excised and fixed with 1% paraformaldehyde for 3 hours at room temperature. Then, the samples were blocked in 5% BSA in PBS for 1 hour at room temperature. F4/80 antibody (Abcam, Cambridge, MA) was added in the blocking buffer for 3 hours at room temperature or overnight at 4 °C. After samples were washed three times with TBS buffer containing 0.1% Tween 20 for 15 min at room temperature with shaking, a fluorescein (FITC) conjugated second antibody (Abcam) was added and incubated for 1 hour at room temperature. The fat pad samples were examined with an inverted confocal microscope.
For Western blot analysis, mouse tissue was homogenized in tissue lysis buffer containing freshly added protease inhibitor cocktail (Sigma). Cell lysate proteins (25 μg protein) were separated by SDS-polyacrylamide gel electrophoresis and then electrophoretically transferred onto nitrocellulose membranes and incubated overnight at 4°C with blocking solution (5% nonfat milk in TBS). The blocked membranes were separately incubated with the specific antibodies of AdipoR1 (Abcam), AKT or P-AKT (Santa Cruz), and AMPK or P-AMPK (Cell Signaling) (1:5000 dilutions with 1% nonfat milk in TBS) for 1 hour at room temperature, and washed three times with TBS buffer containing 0.1% Tween 20 for 15 min at room temperature with shaking. The secondary antibody conjugated to horseradish peroxidase (HRP) (Santa Cruz Biotechnology, Santa Cruz, CA) against to the primary antibody was added, incubated, and washed as described above for the first antibody. Immunoreactive protein bands were detected using the Enhance Chemiluminescence Kit (New England Nuclear Life Science Products, Boston, MA).
2.9. Statistics
Experimental results are reported as the mean ± SEM. Statistical analyses were conducted using the unpaired Students’s t-test assuming unequal variance unless otherwise indicated. Significance was defined as the p < 0.05.
3. Results
3.1. Generation of transgenic mouse model with AdipoR1 specifically overexpressed in macrophages
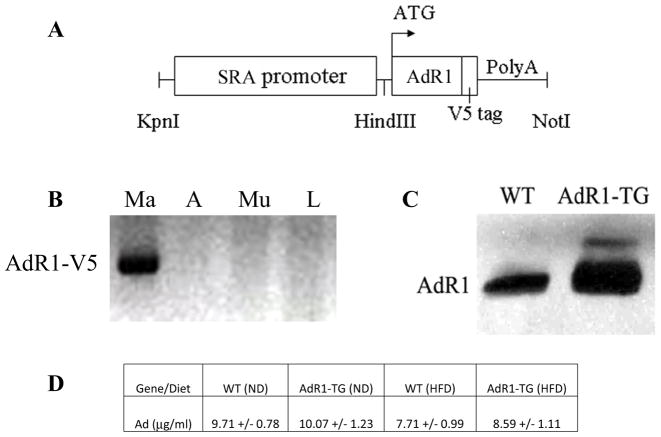
To investigate the functional roles of AdipoR1 in vivo, we have generated AdipoR1 macrophage-specific transgenic mice overexpressing the mouse AdipoR1 gene (AdR1-TG) (Fig. 1A). We identified the AdipoR1 transgene overexpression only in mouse macrophages not in other tissues from the transgenic animals by using a primer pair which amplified the junction sequence between the adiponectin receptor gene and the V5 epitope tag (Fig. 1B). AdR1-TG gene expression from all of three transgenic mouse lines was not detected in any tissues from control wild-type animals (data not shown). The levels of AdipoR1 protein in mouse macrophages were also examined in control wild-type and transgenic mice at six weeks of age using an AdipoR1 antibody (Fig. 1C). Mice transgenic for the AdipoR1 gene had an average 2–4-fold (p < 0.01) elevated AdipoR1 levels than those of control wild-type animals. However, no significant changes for circulating adiponectin concentrations were detected in these AdipoR1 transgenic mice either under normal diet (ND) or high fat diet (HFD) condition (Fig. 1D) when compared to their wild-type control mice.
Fig. 1. Macrophage AdipoR1 transgenic mice.
(A) DNA construct for AdipoR1 macrophage-specific targeting with a human scavenger receptor A-I gene (SR-AI) enhancer/promoter and growth hormone tail with poly A. (B) Mouse tissues were isolated and collected from AdipoR1 transgenic mice at six weeks of age, and AdipoR1 transgene expression was examined with RT-PCR analysis using a primer pair which amplified the junction sequences between the AdipoR1 gene coding region and the V5 epitope tag. The labeling of samples indicated as Ma (macrophage), A (adipose tissue), Mu (skeletal muscle), and L (liver). (C) AdipoR1 protein levels in macrophages were examined in control wild-type (WT) and AdipoR1 transgenic (AdR1-TG) mice (n=8 for each group) at six weeks of age by Western blot analyses with an AdipoR1 antibody (Abcam). Each lane was loaded with 20 μg of total cellular protein extracted from the macrophages. (D) Circulating total adiponectin (Ad) levels were quantitatively analyzed in wild-type (WT) and AdipoR1 transgenic (AdR1-TG) mice (n=6 for each group) aged at 20 weeks under normal diet (ND) or high fat diet (HFD) condition using an ALPCO ELISA kit.
3.2. Weight reduction of whole body, fat and liver in AdR1-TG mice
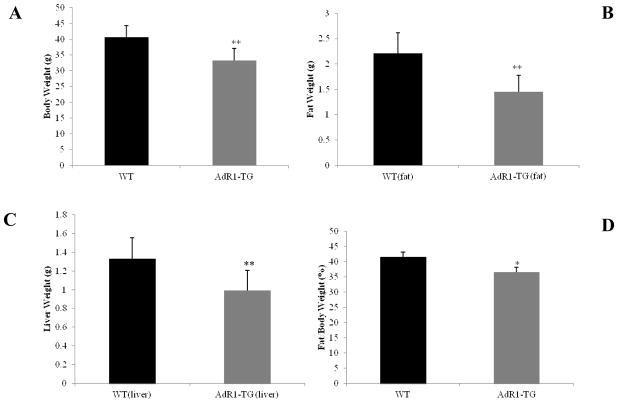
We assessed whether growth and development were affected in AdipoR1 transgenic mice compared to wild-type mice. There were no significant differences in reproduction, food consumption, or development between control and transgenic mice when these animals were fed normal chow or the high fat diet (data not shown). However, compared to wild-type mice, AdR1-TG mice had significantly lower body weight (average 17%), visceral tissue mass (average 34%) and liver mass (average 26%) when these mice fed with the high fat diet (Fig. 2A, B and C).
Fig. 2. Weights of whole body, fat and liver in mice fed with high fat diet.
The weights of mouse bodies (A), visceral fat pads (B) and liver tissues (C) of control wild-type (WT) and AdipoR1 transgenic (AdR1-TG) mice fed a high fat diet for 16 weeks and aged at 20 weeks. **p < 0.01 for all of the examined mice and n=7 for each mouse group. (D) Weights of whole body, fat, and lean muscle, as well as the percentage of fat mass to the whole body weight in control wild-type (WT) and AdipoR1 transgenic (AdR1-TG) mice fed the high fat diet for 20 weeks were determined using dual-energy X-ray absorptiometry (DXA). Weights of whole body, fat, and lean muscle were measured as grams with ± SEM and fat mass weight to whole body weight was expressed as the percentage (%), n=14 for each group of mice, *p < 0.05.
To confirm these data, we conducted mouse whole body dual-energy X-ray absorptiometry (DXA) analyses (Fig. 2D) in control wild-type and adiponectin receptor transgenic mice fed with the high fat diet for 16 weeks (20 weeks of age). As shown by the data presented in Fig. 2D, when compared to the wild-type control mice, whole body fat accumulation relative to the whole body weight in transgenic mice was significantly reduced (37% vs. 42%, p < 0.05); these results are in agreement with the data observed in Fig. 2A, B and C.
3.3. Decreased macrophage lipid accumulation, macrophage infiltration, and macrophage proinflammatory markers in AdR1-TG mice
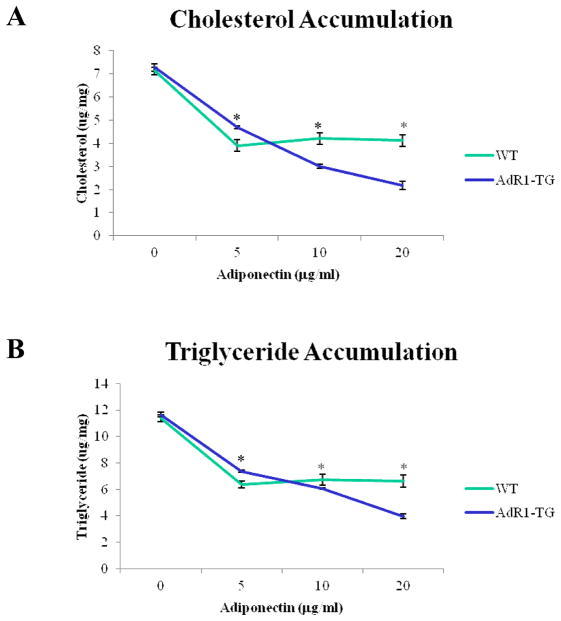
To first investigate the effect of tissue specific AdipoR1 overexpression on macrophage metabolism, mouse peritoneal macrophages were isolated from 20-week-old control (WT) and transgenic (AdR1-TG) mice and the cellular contents of cholesterol and triglyceride were determined under adiponectin and oxLDL treatments (Fig. 3A and B). When compared to those from the control WT mouse macrophages, both cholesterol (maximal average 48% under incubating with 20 μg/ml of adiponectin) and triglyceride (maximal average 41% under incubating with 20 μg/ml of adiponectin) levels in macrophages from AdR1-TG mice were significantly reduced (p < 0.01).
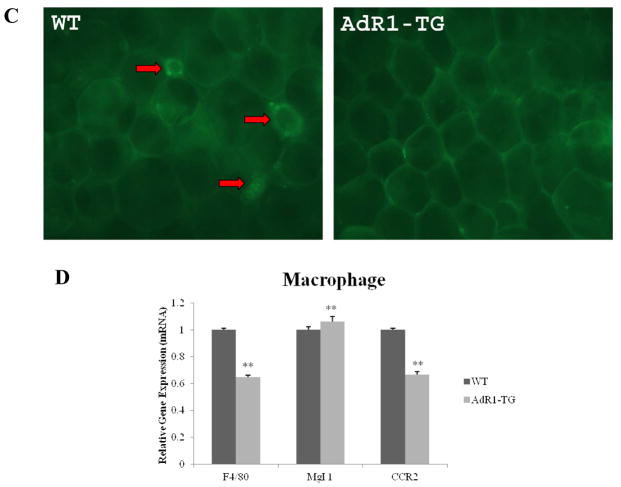
Fig. 3. Changes of lipid accumulation and macrophage markers in macrophages.
(A and B) Mouse macrophages from 20-week-old control wild-type (WT) and transgenic (AdR1-TG) mice fed the high fat diet were isolated and cultured for one week under different concentrations of adiponectin (0 to 20 μg/ml) and 100 μg/ml of oxLDL. Cellular accumulation of cholesterol and triglyceride was assessed in the WT and AdR1-TG macrophages using enzymatic colorimetric kits from Wako Company. Cellular lipid mass was normalized using cellular protein levels which were determined using a protein analysis kit from the Bio-Rad. (C) Mouse visceral fat tissue masses were isolated and hybridized with a macrophage-specific F4/80 antibody and a fluorescence-labeled second antibody and then subjected to a confocal microscope analysis as described in Methods section. The red arrows pointed to macrophages with the crown-like structures in the adipose tissues from control WT mice. (D) Total RNA was isolated from mouse macrophages and then cDNAs were synthesized. QPCR was performed with F4/80, Mgl 1 and CCR2 gene primers. Mean ± SEM from three separate experiments with triplicate samples (n=9 for each group) were examined, **p < 0.01.
We also examined the impact of AdipoR1 overexpression in macrophages from transgenic mice on macrophage infiltration in adipose tissue in animals fed the high fat diet. When compared to those adipose tissues from the control animals, the expression of AdipoR1 gene in AdR1-TG mouse macrophages led to a reduced expression of F4/80 gene, a marker specific for mature macrophages associated with “crown-like structure”, in adipose tissues of transgenic mice fed high-fat diet (Fig. 3C).
To further investigate whether the reduced mature macrophage marker in the metabolically active adipose tissues of Ad-TG mice would be due to the changes of macrophage markers in these transgenic animals, we next examined the macrophage-specific F4/80, macrophage galactose N-acetyl-galactosamine specific lectin 1 (Mgl 1), a marker for alternatively activated macrophage (M2a) phenotype, and chemokine receptor 2 (CCR2), a marker for classically activated macrophage (M1) phenotype, gene expression in macrophages (Fig. 3D). The percentage of these macrophage proinflammatory markers, F4/80 (average 35%, p < 0.01) and CCR2 (average 31%, p < 0.01), were markedly lower than those of macrophages from control wild-type animals. In contrast, the anti-inflammatory marker, Mgl 1, in AdR1-TG macrophages was significantly higher (average 9%, p < 0.01) than those from control wild-type mice. Thus, the overexpression of AdipoR1 in mouse macrophages resulted in favorable metabolic changes for macrophage cell types.
3.4. Decreased lipid levels in AdR1-TG mouse plasma
Considering that the metabolic changes in cells/tissues, such as, macrophages, adipose and liver tissues detected in our AdR1-TG mice would probably cause plasma lipid level changes in these mice, we next decided to measure the lipid levels in these mice. To quantitatively measure the levels of cholesterol, triglyceride and free fatty acid in plasma of control WT and AdR1-TG mice, enzymatic colorimetric assays were performed with plasma from control WT and AdR1-TG mice. As shown in Fig. 4A, B and C, the data indicated that cholesterol levels in AdR1-TG mice were on average 42% (p < 0.01) lower than those in WT mice; triglyceride levels in AdR1-TG mice were on average 27% (p < 0.01) and free fatty acid in AdR1-TG mice were on average 12% (p < 0.05) lower than those in control WT mice.
Fig. 4. Lipid accumulation in mouse plasma.
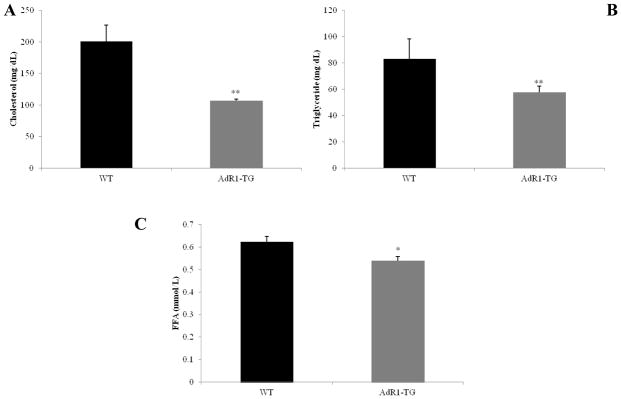
Plasma from 20 weeks of age control wild-type (WT) and AdipoR1 transgenic (AdR1-TG) mice fed with the high fat diet was analyzed for the contents of cholesterol (A), triglyceride (B), and free fatty acid (C) using enzymatic colorimetric kits from Wako Company. Mean ± SEM from three separate experiments with triplicate samples (n=9 for each group) were presented, *p < 0.05 and **p < 0.01.
3.5. Improved glucose tolerance and insulin sensitivity in AdR1-TG mice
To investigate systemic insulin sensitivity in vivo, we performed glucose tolerance tests (GTT) and insulin tolerance tests (ITT) in the control and transgenic mice fed with high fat diet for 16 weeks. Plasma glucose levels were consistently higher (p < 0.05) during the glucose tolerance tests in control wild-type animals compared to the levels in transgenic mice (Fig. 5A). As shown in Fig. 5B, in control wild-type mice, the plasma glucose levels were also consistently higher (p < 0.05) when insulin was injected for the insulin tolerance tests than the levels in transgenic mice. Plasma insulin levels at baseline in transgenic mice fed with the high fat diet were significantly lower (average 48%, p < 0.01) than the insulin levels in wild type mice (Fig. 5C). Thus, selective, specific overexpression of AdipoR1 in mouse macrophages influences systemic metabolism in distal tissues as demonstrated by improved insulin sensitivity.
Fig. 5. Glucose tolerance tests (GTT), insulin tolerance tests (ITT) and measurement of insulin levels in plasma.
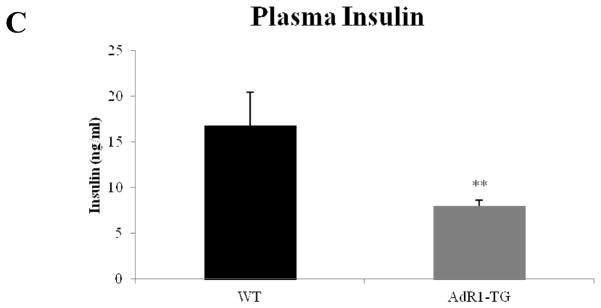
(A) Glucose tolerance tests were performed on control wild-type (WT) and AdipoR1 transgenic (AdR1-TG) mice fed with high fat diet for 16 weeks. Experiments were performed in fasting overnight male mice. Glucose solutions were injected into peritoneal cavity at the dose of 1.0 ml/kg (1M solution). Blood was collected via tail vein at the indicated time points. Glucose concentration in plasma was measured using a glucometer (Precision); n = 6 in each group of mice. (B) Insulin tolerance tests were performed on control wild-type and AdipoR1 transgenic mice under high fat diet condition for 16 weeks. Experiments were conducted similar as the described above for the glucose tolerance tests but fasting 6 hours before the injections and insulin solutions were injected into peritoneal cavity at the dose of 0.5 U/kg. Blood was collected via tail vein at the indicated time points, and glucose levels were measured; n = 6 in each group of animals, *p < 0.05. (C) Insulin levels in plasmas from control wild-type and AdipoR1 transgenic mice fed with the high fat diet at 20 weeks of age were measured using an ultra sensitive mouse insulin ELISA kit. Error bars represented the ± SEM, **p < 0.01.
3.6. Increased glucose uptake and insulin signaling pathway in AdR1-TG mouse skeletal muscle
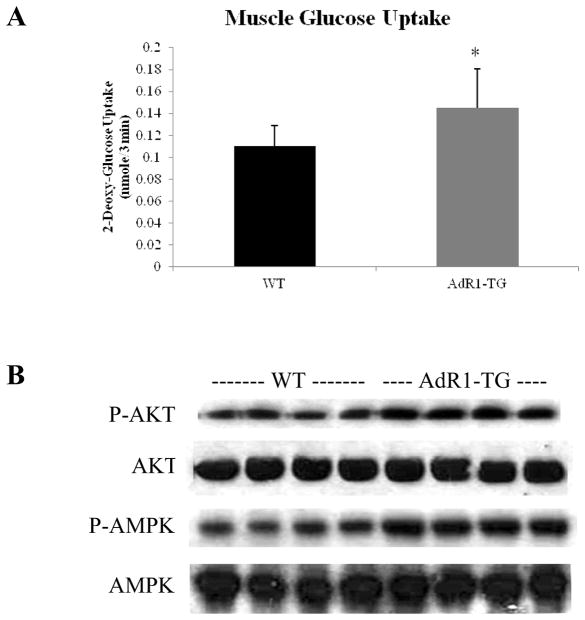
To further investigate the role of AdipoR1 in glucose homeostasis, we assessed insulin stimulated glucose transport activity in skeletal muscle tissues from both control wild-type and AdipoR1 transgenic mice fed the high fat diet for 16 weeks (Fig. 6A). Insulin augmented glucose uptake in skeletal muscle from AdipoR1 transgenic mice was significantly increased by 29% (p < 0.05) compared to the levels in wild-type mice. These results indicated that macrophage AdipoR1 overexpression can significantly enhance insulin stimulated glucose transport capacity in skeletal muscle, suggesting a novel role of macrophage adiponectin receptor in improving insulin sensitivity in this target tissue. Thus, the overexpression of AdipoR1 in macrophages from the transgenic mice resulted in enhanced adiponectin actions in vivo in insulin stimulated glucose transport in skeletal muscle, further demonstrating the beneficial effects of macrophage overexpressing AdipoR1 on glucose metabolism in distal tissues of this transgenic mouse model.
Fig. 6. Glucose uptake and insulin signaling in mouse skeletal muscle.
(A) Insulin-stimulated glucose uptake assays in muscle strips which sampled from control wild-type (WT) and AdipoR1 transgenic (AdR1-TG) mice at 20 weeks of age under the high fat diet for 16 weeks were performed in vitro. For measurement of glucose transport activity, the muscle strips were treated with insulin (100 nM) for 30 min at 37°C and then treated with 3H-2-deoxyglucose for 3 min at 37°C before treating with 1 N NaOH at 70 °C for 5 min; the aliquots of the supernatant were centrifuged and added to the scintillation mixtures and then counted for the isotope activities. Results represented the mean ± SEM from three separate experiments with six mice in per group mice, *p < 0.05 for comparing insulin-stimulated control wild-type and insulin-stimulated AdipoR1 transgenic mice. (B) Dissected skeletal muscle strips from control wild-type (WT) or AdipoR1 transgenic (AdR1-TG) mice fed 16 weeks of the high fat diet were treated with 100 nM insulin for 30 min and the total proteins were extracted for immunoblot analyses using antibodies against phosphorylated Akt (Ser473) or total Akt (Santa Cruz), and antibodies against phosphorylated AMPK (Thr172) or total AMPK (Cell Signaling). Results representd one of the three separate experiments.
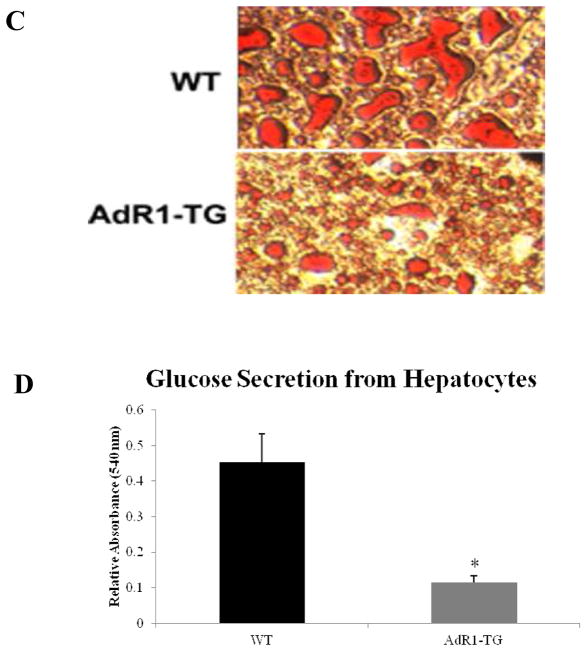
Hepatic intrahepatocellular lipids and glucose secretion from mouse hepatocytes. (C) Fresh frozen liver sections from control WT and AdR1-TG mice (n=8 for each group) were prepared using OCT (frozen tissue matrix) and a Cryostat. The sections were stained with Oil red O as previously described (45). (D) Primary mouse hepatocytes were isolated and cultured in six-wellplates (1.4 × 10⁶ cells per well) in glucose-free DMEM supplemented with 20 mM sodium lactate and 2 mM sodium pyruvate (44). After 12 hours, the glucose concentrations were measured in culture media and normalized to the total cellular proteins in these cells. Results representd one of the three separate experiments. Error bars represented the ± SEM, *p < 0.05.
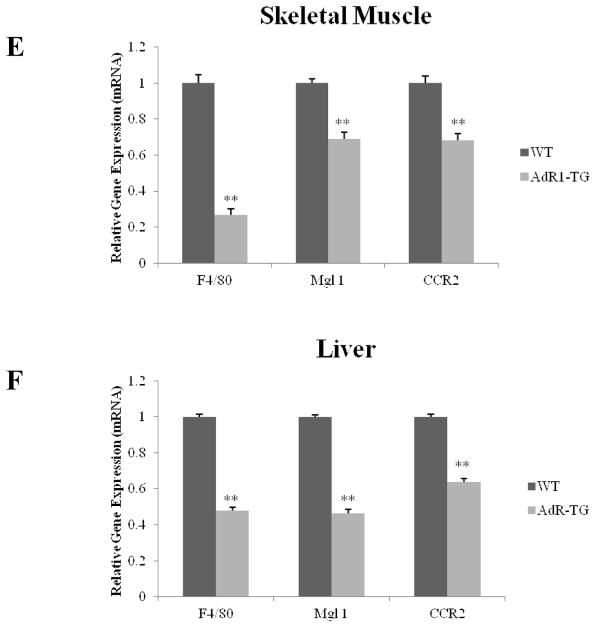
Decreased expression of macrophage-specific markers in AdR1-TG mouse skeletal muscle and liver Expression of macrophage-specific markers, F4/80, Mgl 1, and CCR2, in skeletal muscle (E) and liver (F) from the control (WT) and AdipoR1 transgenic (AdR1-TG) mice were examined by using QPCR analysis. Mean ± SEM from three separate experiments with triplicate samples (n=10 for each group) were examined, **p < 0.01.
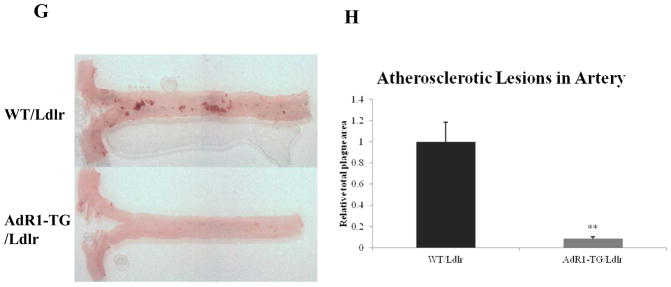
Analysis of mouse arterial vessels and atherosclerotic lesions. (G) Control WT/Ldlr and AdR1-TG/Ldlr mice (n=12 for each group) fed with the high fat diet for six months were analyzed using Oil red O staining for 24 hours for lipid loaded foam cells in en face artery dissection. (H) The percentage of Oil red O positive atherosclerotic lesions were analyzed and quantitated using a NIH ImageJ sofeware.
We next asked whether macrophage adiponectin receptor overexpression would also affect insulin signaling in the skeletal muscle. Akt and AMPK phosphorylations were assessed under insulin stimulated conditions in skeletal muscle tissues from control and AdipoR1 transgenic mice fed the high fat diet for 16 weeks (Fig. 6B). Serine phosphorylation of Akt (Ser473) and threonine phosphorylation of AMPK (Thr172) were enhanced with insulin-stimulation in the AdipoR1 transgenic mouse skeletal muscles when compared to those from the wild-type animals.
3.7. Reduced hepatic steatosis and glucose production in AdR1-TG mouse liver
Hepatic steatosis from control and transgenic mice was also assessed since this is a component of the Metabolic Syndrome. We found that there was a tendency towards decreased liver weight in AdR1-TG compared with WT on normal chow, and this difference became significant in comparing the mice while fed a high fat diet, as shown in Fig. 2C. The reduction in liver weight was associated with a marked diminution in intrahepatocellular lipid as demonstrated by Oil red O staining in Fig. 6C. To determine if AdipoR1 gene overexpression in macrophages could also influence glucose metabolism in liver, we isolated primary mouse hepatocytes, cultured these cells for 12 hours, and then measured glucose production levels that had been released into the culture media. As shown in Fig. 6D, when compared with control WT mice, glucose production from hepatocytes in AdR1-TG mice was markedly reduced on average 67% (p < 0.01). When AMPK phosphorylations were examined under insulin stimulated conditions in liver tissues from control and AdipoR1 transgenic mice fed the high fat diet for 16 weeks, similar results from the liver tissues as in skeletal muscle above were detected (data not shown), indicating that insulin related AMPK signaling pathway was also enhanced in the AdipoR1 transgenic mouse liver tissues when compared to those from the wild-type animals.
3.8. Decreased macrophage infiltration in both of AdR1-TG mouse skeletal muscle and liver
To investigate macrophage infiltration in mouse skeletal muscle and liver, we next examined the expression of macrophage-specific markers, including F4/80, Mgl 1, and CCR2, in skeletal muscle and liver tissues from the control and AdR1-TG mice (Fig. 6E and F). All of these macrophage-specific markers were significantly decreased in both of AdR1-TG mouse skeletal muscle and liver when compared to those from control wild-type mice. Therefore, the overexpression of AdipoR1 in mouse macrophages affected metabolic changes in other metabolic active tissues.
3.9. Decrease of macrophage foam cell formation in atherosclerotic lesions of AdR1-TG mice
Since macrophages play a crucial role in atherosclerosis due to their potential to accumulate large amounts of lipid and to form the foam cells that are the hallmark of the atherosclerotic lesion, we determined whether AdipoR1 overexpression by macrophages could modify macrophage lipid homeostasis and reduce the lipid accumulation in this cell type that is characteristic of foam cell formation and of mouse atherosclerotic lesions in vivo. We first crossed mice transgenic for the AdipoR1 gene with low-density lipoprotein receptor (Ldlr) deficient mice which are a common mouse model for cardiovascular research. We then fed the AdR1-TG/Ldlr and the control WT/Ldlr mice with the high fat diet for six months to enable the development of atherosclerotic lesions in mouse arterial vessels.
These control and AdipoR1 transgenic animals were sacrificed to enable examination of the arteries using en face artery dissections from the aortic origin beginning at the base of the aortic valve. The en face artery dissections were stained with the Oil red O solution (Fig. 6G) as previously described (45). Tissue morphological analysis of the artery dissections revealed significantly increased Oil red O staining material in the arterial vessels (average 91%, p < 0.01) from control WT/Ldlr mice compared to arterial vessels from AdR1-TG/Ldlr mice (Fig. 6H). These data suggest that fewer foam cells were formed in the arterial vessels from AdipoR1 transgenic (AdR1-TG/Ldlr) mice than those from control animals (WT/Ldlr).
3.10. Expression of genes involved in systemic metabolism in active metabolic tissues of AdR1-TG mice
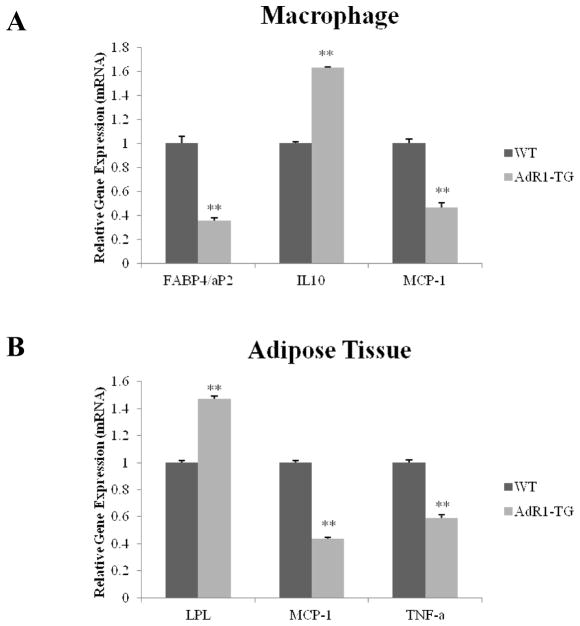
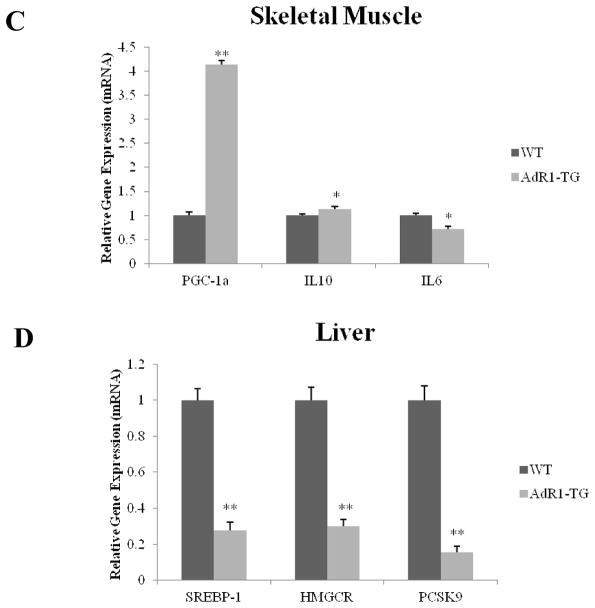
We further examined the impact of macrophage AdipoR1 overexpression in AdR1-TG mice on genes that mediate key systemic metabolic and inflammatory processes in several active metabolic tissues, including macrophage, adipose tissue, skeletal muscle and liver. Genes selected for study in macrophage, adipose tissue and skeletal muscle included fatty acid-binding protein 4 (FABP4/aP2) which promotes lipid loading into cells; lipoprotein lipase (LPL), an enzyme involved in triglyceride hydrolysis; peroxisome proliferator-activated receptor-γ coactivator alpha (PGC-1α), a regulator for both glucose and lipid metabolism; and several cytokines, such as, IL-10, IL-6, MCP-1 and TNF-α. For genes involved in liver tissues for lipid metabolism, we examined whether the expression of sterol regulatory element-binding protein 1 (SREBP-1), hydroxylmethylglutaryl-CoA reductase (HMGCR), and proprotein convertase subtilisin/kexin type 9 (PCSK9) genes would be affected in liver tissues of AdR1-TG mice since these molecules play important roles in cholesterol homeostasis for lipid metabolism.
Macrophages from AdR1-TG mice exhibited increased expression of IL-10 (average 62%, p < 0.01) gene, an anti-inflammatory cytokine, and decreased expression of both the FABP4/aP2 (average 67%, p < 0.01) and IL-6 (a proinflammatory cytokine, average 51%, p < 0.01) genes compared with macrophages from control WT mice (Fig. 7A). In adipose tissues of AdR1-TG mice, LPL gene expression was significantly increased on average 52% (p < 0.01) than those in control WT mice, whereas the expression of both MCP-1 (average 57%, p < 0.01) and TNF-α (average 41%, p < 0.01) genes was significantly decreased (Fig. 7B). In skeletal muscle, the gene expression of both PGC-1α (average 4.2-fold, p < 0.01) and IL-10 (average 22%, p < 0.05) in AdR1-TG mice was significantly higher than those observed in control WT mice; and the expression of IL-6 was lower (average 31%, p < 0.05) in skeletal muscle from AdR1-TG mice than that from control WT mice (Fig. 7C). As shown in Fig. 7D, we assessed the expression of genes involved in lipoprotein synthesis and catabolism in liver tissues from AdR1-TG and WT mice, all of these three genes, SREBP-1, HMGCR and PCSK9, in liver of AdR1-TG mice were detected with significant downregulations; SREBP-1 was decreased on average 72% (p < 0.01), HMGCR was decreased on average 75% (p < 0.01), and PCSK9 was decreased on average 82% (p < 0.01) when expression of these genes was compared with the results from control WT mice. Thus, the overexpression of AdipoR1 in mouse macrophages altered the expression of key metabolic genes in several metabolically active tissues in a manner that would tend to promote lipid hydrolysis/efflux and reduce inflammation in these tissues.
Fig. 7. Levels of expression of metabolic genes in mouse tissues.
Control wild-type (WT) and adiponectin receptor transgenic (AdR1-TG) mice were fed with the high fat diet for 20 weeks; and (A) macrophage, (B) adipose tissue, (C) skeletal muscle, and (D) liver were dissected. Total RNA was isolated from these cells/tissues, cDNAs were synthesized, and QPCR was performed with aP2, IL10, and MCP-1 gene primers for macrophages; LPL, MCP-1, and TNF-α for adipose tissue; PGC-1α, IL10, and IL6 for skeletal muscle; and SREBP1, HMGCR, and PCSK9 for liver. Mean ± SEM from three separate experiments with triplicate samples (n=9 for each group) were presented, *p < 0.05 and **p < 0.01.
4. Discussion
Adiponectin is naturally expressed and secreted exclusively from adipocytes, and adiponectin levels and its isoforms in circulation have recently been reported to highly associate with human coronary artery disease (CAD) [46–49], these studies clearly demonstrated that adiponectin plays an important role in human metabolic diseases. For adiponectin actions, adiponectin receptors play pivotal roles in many metabolic tissues [50]. Although adiponectin expression is undetectable in macrophages, adiponectin has been demonstrated to have effects on inhibiting both the inflammatory process and lipid accumulation in macrophages/foam cells [15, 16, 51]; it is speculating that adiponectin receptors play key roles for adiponectin actions on macrophages. Although we recently engineered an adiponectin transgenic mouse model to directly express adiponectin in macrophages and observed a lean, insulin sensitive, diabetes-resistant, and atherosclerosis-resistant phenotype in those mice [39, 40], this model failed to exclusively point out the mechanisms for these anti-diabetic and anti-atherosclerotic phenotypes because these transgenic mice also exhibited increased circulating adiponectin concentrations. Therefore, higher adiponectin in these adiponectin transgenic mice could be influencing multiple tissues directly, not necessarily as a result of a specific interaction with macrophages. To investigate the mechanisms of adiponectin receptor-mediated alterations of whole body metabolism in vivo, we currently developed a mouse model in which the AdipoR1 gene was specifically overexpressed in macrophages using a human scavenger receptor A-I gene (SR-AI) enhancer/promoter. Our studies have shown that AdipoR1 overexpression in vivo by macrophages can significantly decrease cholesterol and triglyceride accumulation in the macrophages and also in mouse plasma despite no changes of the circulating adiponectin levels detected in these AdipoR1 transgenic mice when compared with those from control wild-type mice. Furthermore, the adiponectin receptor “modified macrophages” infiltrate or circulate into other metabolically active tissues such as adipose and skeletal muscle tissues, as well as liver, and there they can enhance local adiponectin actins on these metabolically active tissues and influence favorable changes to multiple metabolic pathways in these tissues. As demonstrated by our present data, macrophage overexpressing AdipoR1 can alter the expression of macrophage proinflammatory and anti-inflammatory molecules and lipid metabolic genes in metabolically active cells/tissues, such as macrophages, adipose tissue, skeletal muscle and liver. These macrophage AdipoR1 transgenic mice also showed increased glucose uptake in skeletal muscle, decreased glucose secretion in hepatocytes, probably contributing to increased glucose tolerance and improved insulin sensitivity in systemic metabolism in the whole body. Since macrophages in the arterial wall may be converted to the cholesterol-laden foam cells during atherogenesis, we crossed our macrophage AdipoR1 transgenic mouse with the low-density lipoprotein receptor (Ldlr) deficient mouse, a standard animal model for atherosclerosis. Our data also clearly showed that macrophage foam cell formation in atherosclerotic lesions was significantly reduced in this double crossed mouse model. These results suggest that AdipoR1 plays an important role in whole body metabolism by modulating inflammatory and metabolic signaling pathways, by improving glucose tolerance, insulin resistance, and by reducing atherogenesis which are typical characteristics of the Metabolic Syndrome.
When generating the macrophage AdipoR1 transgenic mice, we also made macrophage AdipoR2 transgenic mice; and the macrophage AdipoR2 transgenic showed similar phenotypes as these from the macrophage AdipoR1 transgenic mice but with very weak phenotypes (data not shown). Although these two adiponectin receptors have been found to be expressed in human macrophages [26–28], AdipoR1 has predominating expression levels in these cells with almost 100-fold differences [27, 28]. Probably, due to the extremely different gene expression levels and differential signaling pathways of two adiponectin receptors in macrophages, we failed to detect a clear pattern of phenotypes from the macrophage adiponectin receptor 2 transgenic mice. In addition, although adiponectin has reported to interact with another putative receptor, T-cadherin, in pr-B-cells [23]; T-cadherin is almost undetectable in macrophage cells [28]. Moreover, since T-cadherin lacks the transmembrane and cytoplasmic domains, the biological significance of this non-transmembrane receptor is not clear yet in other cells [24].
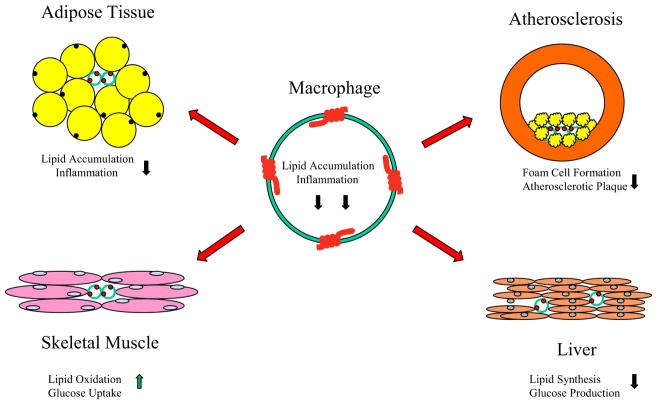
Interestingly, our transgenic mouse model with macrophages expressing AdipoR1 showed not only improved insulin sensitivity and inflammation in skeletal muscle and adipose tissues, but fat mass, macrophage and plasma lipid accumulation and foam cell formation was also favorably reduced resulting from the enhanced adiponectin actions either in mouse macrophage cells or mouse metabolically active tissues. Thus, using macrophages as the carriers for in vivo enhanced actions of adiponectin, which is an anti-diabetic, anti-inflammatory and anti-atherogenic cytokine, may provide a novel, unique strategy (Fig. 8) to develop a new therapeutic application for the treatment of human Metabolic Syndrome or metabolic disorders.
Fig. 8. AdipoR1 modified macrophages to influence other metabolically active tissues.
AdipoR1 molecules (four red colored receptor domain structures) are overexpressed in macrophages and the modified macrophages infiltrate/circulate or reside in metabolically active tissues such as adipose tissue, vascular artery, liver, and skeletal muscle through blood vessels (red arrows). The modified macrophages interact with these metabolic tissues/cells to improve intercellular microenvironment for whole body systemic metabolism. Black colored arrows indicate downregulation effects and green colored arrow represents upregulation effects in these interacting tissues/cells.
The molecular basis of the cell/tissue interactions among AdipoR1 overexpressed macrophages and other metabolically active tissues is still not fully understood. It is not clear how the macrophage AdipoR1 overexpression directly influences productions of proinflammatory cytokines in macrophages, adipose, skeletal muscle, and liver tissues; though these tissues have the similar expression levels of cytokines and macrophage markers with those in the AdipoR1 modified macrophages (data not shown). It is not clear if these favorable changes result from the secretion of other anti-inflammatory molecules from these adiponectin receptor modified macrophages or if the reduced lipid accumulation and inflammatory response in these macrophages results in reduced negative impact when these macrophages reside in other tissues or circulate inside other tissues via circulation system. Clearly, additional studies are required and the potential for other cellular or molecular physiological effects among these metabolically active tissues should be further pursed in the future. Our macrophage AdipoR1 transgenic mouse model provides an excellent research system for investigating and evaluating the potential role of these physiological mechanisms in vivo. Our current results from these unique mouse models also provide new insight into the prevention and therapy of metabolic disorders in humans.
Highlights.
Overexpression of AdipoR1 in macrophages can physiologically modulate metabolic activities in vivo by enhancing adiponectin actions in distal metabolically active tissues.
AdipoR1 transgenic mice have improved lipid metabolism and inflammatory response for diabetes and atherosclerosis under high fat diet condition.
The AdipoR1 modified macrophages provide unique interactions with the residented tissues/cells, suggesting a novel role of macrophage adiponectin receptor in improving metabolic disorders in vivo.
Acknowledgments
We thank Dr. Chris Glass (University of California at San Diego) for kindly providing the plasmid vector containing the human scavenger receptor A-I gene (SR-AI) enhancer/promoter. We are grateful to the UAB Diabetes Research and Training Center for providing outstanding core services (NIH P30 DK-56336); especially the helpful technical assistance on en face artery dissections from Ms. Melissa Sammy and Dr. Scott Ballinger in the core facility. This work was supported by grants from American Diabetes Association (1-07-RA-49) and the UAB Diabetes Research and Training Center to YF, and grant from NIH (DK-083562) to TG.
Footnotes
Conflict of interest
None declared.
Publisher's Disclaimer: This is a PDF file of an unedited manuscript that has been accepted for publication. As a service to our customers we are providing this early version of the manuscript. The manuscript will undergo copyediting, typesetting, and review of the resulting proof before it is published in its final citable form. Please note that during the production process errors may be discovered which could affect the content, and all legal disclaimers that apply to the journal pertain.
References
- 1.DeFronzo RA, Ferrannini E. Insulin resistance: A multifaceted syndrome responsible for NIDDM, obesity, hypertension, dyslipidemia, and atherosclerotic cardiovascular disease. Diabetes Care. 1991;14:173–194. doi: 10.2337/diacare.14.3.173. [DOI] [PubMed] [Google Scholar]
- 2.Reaven GM. Role of insulin resistance in human disease. Diabetes. 1988;37:1595–1606. doi: 10.2337/diab.37.12.1595. [DOI] [PubMed] [Google Scholar]
- 3.Reaven GM. Insulin resistance, hyperinsulinemia, hypertriglyceridemia, and hypertension. Diabetes Care. 1991;14:195–202. doi: 10.2337/diacare.14.3.195. [DOI] [PubMed] [Google Scholar]
- 4.Nigro J, Osman N, Dart AM, Little PJ. Insulin resistance and atherosclerosis. Endocrine Reviews. 2006;27:242–259. doi: 10.1210/er.2005-0007. [DOI] [PubMed] [Google Scholar]
- 5.Berg AH, Combs TP, Scherer PE. ACRP30/adiponectin: an adipokine regulating glucose and lipid metabolism. Trends Endocrinol Metab. 2002;13:84–89. doi: 10.1016/s1043-2760(01)00524-0. [DOI] [PubMed] [Google Scholar]
- 6.Pajvani UB, Hawkins M, Combs TP, Rajala MW, Doebber T, Berger JP, Wagner JA, Wu M, Knopps A, Xiang AH, Utzschneider KM, Kahn SE, Olefsky JM, Buchanan TA, Scherer PE. Complex distribution, not absolute amount of adiponectin, correlates with thiazolidinedione-mediated improvement in insulin sensitivity. J Biol Chem. 2004;279:12152–12162. doi: 10.1074/jbc.M311113200. [DOI] [PubMed] [Google Scholar]
- 7.Lara-Castro C, Fu Y, Chung BH, Garvey WT. Adiponectin and the metabolic syndrome: mechanisms mediating the risk of metabolic and cardiovascular disease. Curr Opinion Lipidology. 2007;18:263–270. doi: 10.1097/MOL.0b013e32814a645f. [DOI] [PubMed] [Google Scholar]
- 8.Arita Y, Kihara S, Ouchi N, Takahashi M, Maeda K, Miyagawa J, Hotta K, Shimomura I, Nakamura T, Miyaoka K, Kuriyama H, Nishida M, Yamashita S, Okubo K, Matsubara K, Muraguchi M, Ohmoto Y, Funahashi T, Matsuzawa Y. Paradoxical decrease of an adipose-specific protein, adiponectin, in obesity. Biochem Biophys Res Commun. 1999;257:79–83. doi: 10.1006/bbrc.1999.0255. [DOI] [PubMed] [Google Scholar]
- 9.Lindsay RS, Funahashi T, Hanson RL, Matsuzawa Y, Tanaka S, Tataranni PA, Knowler WC, Krakoff J. Adiponectin and development of type 2 diabetes in the Pima Indian population. Lancet. 2002;360:57–58. doi: 10.1016/S0140-6736(02)09335-2. [DOI] [PubMed] [Google Scholar]
- 10.Lindsay RS, Funahashi T, Krakoff J, Matsuzawa Y, Tanaka S, Kobes S, Bennett PH, Tataranni PA, Knowler WC, Hanson RL. Genome-wide linkage analysis of serum adiponectin in the Pima Indian population. Diabetes. 2003;52:2419–2425. doi: 10.2337/diabetes.52.9.2419. [DOI] [PubMed] [Google Scholar]
- 11.Fruebis J, Tsao TS, Javorschi S, Ebbets-Reed D, Erickson MR, Yen FT, Bihain BE, Lodish HF. Proteolytic cleavage product of 30-kDa adipocyte complement-related protein increases fatty acid oxidation in muscle and causes weight loss in mice. Proc Natl Acad Sci USA. 2001;98:2005–2010. doi: 10.1073/pnas.041591798. [DOI] [PMC free article] [PubMed] [Google Scholar]
- 12.Yamauchi T, Kamon J, Waki H, Terauchi Y, Kubota N, Hara K, Mori Y, Ide T, Murakami K, Tsuboyama-Kasaoka N, Ezaki O, Akanuma Y, Gavrilova O, Vinson C, Reitman ML, Kagechika H, Shudo K, Yoda M, Nakano Y, Tobe K, Nagai R, Kimura S, Tomita M, Froguel P, Kadowaki T. The fat-derived hormone adiponectin reverses insulin resistance associated with both lipoatrophy and obesity. Nat Med. 2001;7:941–946. doi: 10.1038/90984. [DOI] [PubMed] [Google Scholar]
- 13.Berg AH, Combs TP, Du X, Brownlee M, Scherer PE. The adipocyte-secreted protein Acrp30 enhances hepatic insulin action. Nat Med. 2001;7:947–953. doi: 10.1038/90992. [DOI] [PubMed] [Google Scholar]
- 14.Combs TP, Berg AH, Obici S, Scherer PE, Rossetti L. Endogenous glucose production is inhibited by the adipose derived protein Acrp30. J Clin Invest. 2001;108:1875–1881. doi: 10.1172/JCI14120. [DOI] [PMC free article] [PubMed] [Google Scholar]
- 15.Ouchi N, Kihara S, Arita Y, Nishida M, Matsuyama A, Okamoto Y, Ishigami M, Kuriyama H, Kishida K, Nishizawa H, Hotta K, Muraguchi M, Ohmoto Y, Yamashita S, Funahashi T, Matsuzawa Y. Adipocyte-derived plasma protein, adiponectin, suppresses lipid accumulation and class A scavenger receptor expression in human monocyte-derived macrophages. Circulation. 2001;103:1057–1063. doi: 10.1161/01.cir.103.8.1057. [DOI] [PubMed] [Google Scholar]
- 16.Furukawa K, Hori M, Ouchi N, Kihara S, Funahashi T, Matsuzawa Y, Miyazaki A, Nakayama H, Horiuchi S. Adiponectin down-regulates acyl-coenzyme A: cholesterol acyltransferase-1 in cultured human monocyte-derived macrophages. Biochemical and Biophysical Research Communications. 2004;317:831–836. doi: 10.1016/j.bbrc.2004.03.123. [DOI] [PubMed] [Google Scholar]
- 17.Yamauchi T, Kamon J, Waki H, Imai Y, Shimozawa N, Hioki K, Uchida S, Ito Y, Takakuwa K, Matsui J, Takata M, Eto K, Terauchi Y, Komeda K, Tsunoda M, Murakami K, Ohnishi Y, Naitoh T, Yamamura K, Ueyama Y, Froguel P, Kimura S, Nagai R, Kadowaki T. Globular Adiponectin protected ob/ob mice from diabetes and apoE-deficient mice from atherosclerosis. J Biol Chem. 2003;278:2461–2468. doi: 10.1074/jbc.M209033200. [DOI] [PubMed] [Google Scholar]
- 18.Combs TP, Pajvani UB, Berg AH, Lin Y, Jelicks LA, Laplante M, Nawrocki AR, Rajala MW, Parlow AF, Cheeseboro L, Ding YY, Russell RG, Lindemann D, Hartley A, Baker GR, Obici S, Deshaies Y, Ludgate M, Rossetti L, Scherer PE. A transgenic mouse with a deletion in the collagenous domain of adiponectin displays elevated circulating Adiponectin and improved insulin sensitivity. Endocrinology. 2004;145:367–383. doi: 10.1210/en.2003-1068. [DOI] [PubMed] [Google Scholar]
- 19.Fu Y, Luo N, Klein RL, Garvey WT. Adiponectin promotes adipocyte differentiation, Insulin sensitivity, and lipid accumulation. J Lipid Research. 2005;46:1369–1379. doi: 10.1194/jlr.M400373-JLR200. [DOI] [PubMed] [Google Scholar]
- 20.Waki H, Yamauchi T, Kamon J, Ito Y, Uchida S, Kita S, Hara K, Hada Y, Vasseur F, Froguel P, Kimura S, Nagai R, Kadowaki T. Impaired multimerization of human adiponectin mutants associated with diabetes: molecular structure and multimer formation of adiponectin. J Biol Chem. 2003;278:40352–40363. doi: 10.1074/jbc.M300365200. [DOI] [PubMed] [Google Scholar]
- 21.Yamauchi T, Kamon J, Ito Y, Tsuchida A, Yokomizo T, Kita S, Sugiyama T, Miyagishi M, Hara K, Tsunoda M, Murakami K, Ohteki T, Uchida S, Takekawa S, Waki H, Tsuno NH, Shibata Y, Terauchi Y, Froguel P, Tobe K, Koyasu S, Taira K, Kitamura T, Shimizu T, Nagai R, Kadowaki T. Cloning of adiponectin receptors that mediate antidiabetic metabolic effects. Nature. 2003;423:762–769. doi: 10.1038/nature01705. [DOI] [PubMed] [Google Scholar]
- 22.Mao X, Kikani CK, Riojas RA, Langlais P, Wang L, Ramos FJ, Fang Q, Christ-Roberts CY, Hong JY, Kim RY, Liu F, Dong LQ. APPL1 bonds to adiponectin receptors and mediates adiponectin signaling and function. Nat Cell Biology. 2006;8:516–523. doi: 10.1038/ncb1404. [DOI] [PubMed] [Google Scholar]
- 23.Hug C, Wang J, Ahmad NS, Bogan JS, Tsao T, Lodish HF. T-cadherin is a receptor for hexameric and high-molecular-weight forms of Acrp30/adiponectin. Proc Natl Acad Sci USA. 2004;101:10308–10313. doi: 10.1073/pnas.0403382101. [DOI] [PMC free article] [PubMed] [Google Scholar]
- 24.Kadowaki T, Yamauchi T, Kubota N, Hara K, Ueki K, Tobeet K. Adiponectin and adiponectin receptors in insulin resistance, diabetes, and the metabolic syndrome. J Clin Invest. 2006;116:1784–1792. doi: 10.1172/JCI29126. [DOI] [PMC free article] [PubMed] [Google Scholar]
- 25.Yamauchi T, Nio Y, Maki T, Kobayashi M, Takazawa T, Iwabu M, Okada-Iwabu M, Kawamoto S, Kubota N, Kubota T, Ito Y, Kamon J, Tsuchida A, Kumagai K, Kozono H, Hada Y, Ogata H, Tokuyama K, Tsunoda M, Ide T, Murakami K, Awazawa M, Takamoto I, Froguel P, Hara K, Tobe K, Nagai R, Ueki K, Takashi K. Targeted disruption of AdipoR1 and AdipoR2 causes abrogation of adiponectin binding and metabolic actions. Nature Medicine. 2007;13:332–339. doi: 10.1038/nm1557. [DOI] [PubMed] [Google Scholar]
- 26.Chinetti G, Zawadski C, Fruchart JC, Staels B. Expression of adiponectin receptors in human macrophages and regulation by agonists of the nuclear receptors PPARα, PPARγ, and LXR. Biochemical & Biophysical Research Communications. 2004;314:151–158. doi: 10.1016/j.bbrc.2003.12.058. [DOI] [PubMed] [Google Scholar]
- 27.Yamaguchi N, Argueta JG, Masuhiro Y, Kagishita M, Nonaka K, Saito T, Hanazawa S, Yamashita Y. Adiponectin inhibits Toll-like receptor family-induced signaling. FEBS Letters. 2005;579:6821–6826. doi: 10.1016/j.febslet.2005.11.019. [DOI] [PubMed] [Google Scholar]
- 28.Tian L, Luo N, Zhu X, Chung BH, Garvey WT, Fu Y. Adiponectin-AdipoR1/2-APPL1 signaling axis suppresses human foam cell formation: Differential ability of AdipoR1 and AdipoR2 to regulate inflammatory cytokine responses. Atherosclerosis. 2012;221:66–75. doi: 10.1016/j.atherosclerosis.2011.12.014. [DOI] [PMC free article] [PubMed] [Google Scholar]
- 29.Mantovani A, Sica A, Locati M. Macrophage polarization comes of age. Immunity. 2005;23:344–346. doi: 10.1016/j.immuni.2005.10.001. [DOI] [PubMed] [Google Scholar]
- 30.Lusis AJ. Atherosclerosis. Nature. 2000;407:233–241. doi: 10.1038/35025203. [DOI] [PMC free article] [PubMed] [Google Scholar]
- 31.Bouloumie A, Curat CA, Sengenes C, Lolmede K, Miranville A, Busse R. Role of macrophage tissue infiltration in metabolic diseases. Curr Opin Clin Nutr Metab Care. 2005;8:347–354. doi: 10.1097/01.mco.0000172571.41149.52. [DOI] [PubMed] [Google Scholar]
- 32.Kanda H, Tateya S, Tamori Y, Kotani K, Hiasa K, Kitazawa R, Kitazawa S, Miyachi H, Maeda S, Egashira K, Kasuga M. MCP-1 contributes to macrophage infiltration into adipose tissue, insulin resistance, and hepatic steatosis in obesity. J Clin Invest. 2006;116:1494–1505. doi: 10.1172/JCI26498. [DOI] [PMC free article] [PubMed] [Google Scholar]
- 33.Weisberg SP, McCann D, Desai M, Rosenbaum M, Leibel RL, Ferrante AW. Obesity is associated with macrophage accumulation in adipose tissue. J Clin Invest. 2003;112:1796–1808. doi: 10.1172/JCI19246. [DOI] [PMC free article] [PubMed] [Google Scholar]
- 34.Xu H, Barnes GT, Yang Q, Tan G, Yang D, Chou CJ, Sole J, Nichols A, Ross JS, Tartaglia LA, Chen H. Chronic inflammation in fat plays a crucial role in the development of obesity-related insulin resistance. J Clin Invest. 2003;112:1821–1830. doi: 10.1172/JCI19451. [DOI] [PMC free article] [PubMed] [Google Scholar]
- 35.Li P, Lu M, Nguyen MT, Bae EJ, Chapman J, Feng D, Hawkins M, Pessin JE, Sears DD, Nguyen AK, Amidi A, Watkins SM, Nguyen U, Olefsky JM. Functional heterogeneity of CD11c-positive adipose tissue macrophages in diet-induced obese mice. J Biol Chem. 2010;285:15333–15345. doi: 10.1074/jbc.M110.100263. [DOI] [PMC free article] [PubMed] [Google Scholar]
- 36.Olefsky JM, Glass CK. Macrophages, inflammation, and insulin resistance. Annu Rev Physiol. 2010;72:219–246. doi: 10.1146/annurev-physiol-021909-135846. [DOI] [PubMed] [Google Scholar]
- 37.Oh DY, Talukdar S, Bae EJ, Imamura T, Morinaga H, Fan W, Li P, Lu WJ, Watkins SM, Olefsky JM. GPR120 is an omega-3 fatty acid receptor mediating potent anti-inflammatory and insulin-sensitizing effects. Cell. 2010;142:687–698. doi: 10.1016/j.cell.2010.07.041. [DOI] [PMC free article] [PubMed] [Google Scholar]
- 38.Saberi M, Woods NB, de Luca C, Schenk S, Lu JC, Bandyopadhyay G, Verma IM, Olefsky JM. Hematopoietic cell-specific deletion of toll-like receptor 4 ameliorates hepatic and adipose tissue insulin resistance in high-fat-fed mice. Cell Metab. 2009;10:419–429. doi: 10.1016/j.cmet.2009.09.006. [DOI] [PMC free article] [PubMed] [Google Scholar]
- 39.Luo N, Liu J, Chung BH, Yang Q, Klein RL, Garvey WT, Fu Y. Macrophage adiponectin expression improves insulin sensitivity and protects against inflammation and atherosclerosis. Diabetes. 2010;59:791–799. doi: 10.2337/db09-1338. [DOI] [PMC free article] [PubMed] [Google Scholar]
- 40.Luo N, Wang X, Chung BH, Lee MH, Klein RL, Garvey WT, Fu Y. Effects of macrophage-specific adiponectin expression on lipid metabolism in vivo. Am J Physiol Endocrinol Metab. 2011;301:E180–186. doi: 10.1152/ajpendo.00614.2010. [DOI] [PMC free article] [PubMed] [Google Scholar]
- 41.Maeda K, Cao H, Kono K, Gorgun CZ, Furuhash M, Uysal KT, Cao Q, Atsumi G, Malone H, Krishnan B, Minokoshi Y, Kahn BB, Parker PA, Hotamisligil GS. Adipocyte/macrophage fatty acid binding proteins control integrated metabolic responses in obesity and diabetes. Cell Metabolism. 2005;1:107–119. doi: 10.1016/j.cmet.2004.12.008. [DOI] [PubMed] [Google Scholar]
- 42.Wredenberg A, Freyer C, Sandström ME, Katz A, Wibom R, Westerblad H, Larsson NG. Respiratory chain dysfunction in skeletal muscle does not cause insulin resistance. Biochem Biophysi Resea Comm. 2006;350:202–207. doi: 10.1016/j.bbrc.2006.09.029. [DOI] [PubMed] [Google Scholar]
- 43.Garvey WT, Maianu L, Zhu JH, Brechtel-Hook G, Wallace P, Baron AD. Evidence for defects in the trafficking and translocation of GLUT4 glucose transporters in skeletal muscle as a cause of human insulin resistance. J Clin Invest. 1998;101:2377–2386. doi: 10.1172/JCI1557. [DOI] [PMC free article] [PubMed] [Google Scholar]
- 44.Yoon JC, Puigserver P, Chen G, Donovan J, Wu Z, Rhee J, Adelmant G, Stafford J, Kahn CR, Granner DK, Newgard CB, Spiegelman BM. Control of hepatic gluconeogenesis through the transcriptional coactivator PGC-1. Nature. 2001;413:131–138. doi: 10.1038/35093050. [DOI] [PubMed] [Google Scholar]
- 45.Ramirez-Zacarias JL, Castro-Munozledo F, Kuri-Harcuch W. Quantitation of adipose conversion and triglycerides by staining intracytoplasmic lipids with Oil red O. Histochemistry. 1992;97:493–497. doi: 10.1007/BF00316069. [DOI] [PubMed] [Google Scholar]
- 46.Kunita E, Yamamoto H, Kitagawa T, Ohashi N, Utsunomiya H, Oka T, Horiguchi J, Awai K, Kihara Y. Association between plasma high-molecular-weight adiponectin and coronary plaque characteristics assessed by computed tomography angiography in conditions of visceral adipose accumulation. Circ J. 2012;76:1687–1696. doi: 10.1253/circj.cj-11-1442. [DOI] [PubMed] [Google Scholar]
- 47.Ohashi T, Shibata R, Morimoto T, Kanashiro M, Ishii H, Ichimiya S, Hiro T, Miyauchi K, Nakagawa Y, Yamagishi M, Ozaki Y, Kimura T, Daida H, Murohara T, Matsuzaki M. Correlation between circulating adiponectin levels and coronary plaque regression during aggressive lipid-lowering therapy in patients with acute coronary syndrome: subgroup analysis of JAPAN-ACS study. Atherosclerosis. 2010;212:237–242. doi: 10.1016/j.atherosclerosis.2010.05.005. [DOI] [PubMed] [Google Scholar]
- 48.Broedl UC, Lebherz C, Lehrke M, Stark R, Greif M, Becker A, von Ziegler F, Tittus J, Reiser M, Becker C, Göke B, Parhofer KG, Leber AW. Low adiponectin levels are an independent predictor of mixed and non-calcified coronary atherosclerotic plaques. PLoS One. 2009;4:e4733. doi: 10.1371/journal.pone.0004733. [DOI] [PMC free article] [PubMed] [Google Scholar]
- 49.Rizza S, Gigli F, Galli A, Micchelini B, Lauro D, Lauro R, Federici M. Adiponectin isoforms in elderly patients with or without coronary artery disease. J Am Geriatr Soc. 2010;58:702–706. doi: 10.1111/j.1532-5415.2010.02773.x. [DOI] [PubMed] [Google Scholar]
- 50.Yamauchi T, Kadowaki T. Adiponectin receptor as a key player in healthy longevity and obesity-related diseases. Cell Metabolism. 2013;17:185–196. doi: 10.1016/j.cmet.2013.01.001. [DOI] [PubMed] [Google Scholar]
- 51.Tian L, Luo N, Klein RL, Chung BH, Garvey WT, Fu Y. Adiponectin reduces lipid accumulation in macrophage foam cells. Atherosclerosis. 2009;202:152–161. doi: 10.1016/j.atherosclerosis.2008.04.011. [DOI] [PMC free article] [PubMed] [Google Scholar]


