

Abstract
Taste signalling molecules are found in the gastrointestinal (GI) tract suggesting that they participate to chemosensing. We tested whether fasting and refeeding affect the expression of the taste signalling molecule, α-transducin (Gαtran), throughout the pig GI tract and the peptide content of Gαtran cells. The highest density of Gαtran-immunoreactive (IR) cells was in the pylorus, followed by the cardiac mucosa, duodenum, rectum, descending colon, jejunum, caecum, ascending colon and ileum. Most Gαtran-IR cells contained chromogranin A. In the stomach, many Gαtran-IR cells contained ghrelin, whereas in the upper small intestine many were gastrin/cholecystokinin-IR and a few somatostatin-IR. Gαtran-IR and Gαgust-IR colocalized in some cells. Fasting (24 h) resulted in a significant decrease in Gαtran-IR cells in the cardiac mucosa (29.3 ± 0.8 versus 64.8 ± 1.3, P < 0.05), pylorus (98.8 ± 1.7 versus 190.8 ± 1.9, P < 0.0 l), caecum (8 ± 0.01 versus 15.5 ± 0.5, P < 0.01), descending colon (17.8 ± 0.3 versus 23 ± 0.6, P < 0.05) and rectum (15.3 ± 0.3 versus 27.5 ± 0.7, P < 0.05). Refeeding restored the control level of Gαtran-IR cells in the cardiac mucosa. In contrast, in the duodenum and jejunum, Gαtran-IR cells were significantly reduced after refeeding, whereas Gαtran-IR cells density in the ileum was not changed by fasting/refeeding. These findings provide further support to the concept that taste receptors contribute to luminal chemosensing in the GI tract and suggest they are involved in modulation of food intake and GI function induced by feeding and fasting.
Keywords: α-gustducin, taste receptors, enteroendocrine cells, chemosensing
Introduction
Sensing of luminal contents by the gastrointestinal (GI) tract mucosa plays a critical role in the control of digestion, absorption, food intake and metabolism 1, 2 by triggering functional responses appropriate for beneficial or potentially harmful substances. Enteroendocrine (EEC) cells act as specialized transducers of luminal content, by releasing signalling molecules, which activate nerve fibres as well as local and distant targets to influence gut functions. EECs can be either ‘open-type’ or ‘closed-type’ depending on their microvilli reaching or not the lumen 1–3. Both types of cells can be regulated by intraluminal content, either directly (‘open cells’) or indirectly (‘closed cells’) through neural and humoural mechanisms to release a variety of secretory products, including gastrin (G cells), ghrelin (P or X cells), somatostatin (D cells), cholecystokinin (CCK) (I cells), serotonin (enterochromaffin cells), glucose-dependent insulinotropic peptide (GIP) (K cells), glucagon-like peptides (GLPs) and peptide YY (PYY) (L cells), according to the different substances detected in the lumen 1–3. Once released, these signalling molecules affect different functions ranging from gastrointestinal motility and secretion to feeding regulation via the brain-gut axis 1–3.
The discovery that taste receptors (TRs) and signalling molecules identified in the oral cavity are expressed in the GI mucosa, suggests that they play a role in chemosensing in the gut. TRs are G protein-coupled receptors (GPCRs) sensing bitter (T2Rs), or sweet and umami (T1Rs) tastes. T2Rs are a large family of receptors (25–36 in mammals) perceiving a multitude of tastants, whereas T1Rs comprise 3 receptors that heterodimerize to sense sweetness (T1R2 and T1R3) or umami (T1R1 and T1R3) 4–6. T1Rs and T2Rs mediate gustatory signalling by interacting with specific Gα subunits, including α-gustducin (Gαgust) and α-transducin (Gαtran) 7 through the activation of different effector systems leading to intracellular Ca2+ increase and transmitter release. Gαgust or Gαtran immunoreactivity (IR) has been localized to epithelial EECs and non-EECs in the rodent 8–11, pig 12, 13 and human 14 GI tract and pancreatic duct 15.
The aims of this study were to characterize the cellular sites of expression of Gαtran and test the hypothesis that Gαtran is modulated by fasting and refeeding in the GI tract of the pig, an animal model closer to humans compared with rodents for food intake, body size, lifespan and body proportion.
Materials and methods
Large White male pigs (n = 12), of about 45 days of age with an average weight of 12.0 ± 0.3 kg, purchased from Suidea (Reggio Emilia, Italy), were fed with a standard balanced diet and housed individually in pens with a mesh floor in a temperature-controlled room and tap water freely available. Following 1 day adaptation, animals were divided into three groups: standard diet (control, n = 4), fasted for 24 h (fasted, n = 4) and refed for 24 h after fasting (refed, n = 4). Experimental procedures were approved by the Ethic Committee for Experimental Animals of the University of Bologna, Italy.
Pigs were deeply anaesthetized with sodium thiopental (10 mg/kg body weight, Zoletil 100, Virbac) and killed by an intracardiac injection of Tanax® (0.5 ml/kg BW; Intervet Italia). Specimens of the GI tract: oesophagus (cervical, thoracic and abdominal tract), stomach (cardiac, near to the gastric diverticulum; oxyntic, in the greater curvature; and pyloric, close to the pyloric sphincter), duodenum (about 10 cm from the pyloric sphincter), middle jejunum and ileum, caecum, ascending colon (near the centrifugal turns), descending colon (about 25 cm from the anus) and rectum (in the ampulla recti) were collected, pinned flat on balsa wood, fixed in 10% buffered formalin for 24 h at room temperature (RT), dehydrated and embedded in paraffin.
Immunohistochemistry
Serial (5 μm thick) sections mounted on poly-L-lysine–coated slides were processed for single and double labelling immunofluorescence using antibodies directed to Gαtran or Gαgust, chromogranin A (CgA), a generalized marker for EECs, or specific markers for EEC subtypes (ghrelin, GHR, somatostatin, SOM and gastrin/cholecystokinin GAS/CCK) (Table 1). Briefly, sections were deparaffinized through graded ethanols to xylene, rehydrated and heated in sodium citrate buffer (pH 6.0) in a microwave (2 cycles at 800 W, 5 min each) for antigen unmasking. Sections were incubated in 15% normal horse serum/0.01 M phosphate buffer saline (PBS) (1 h at RT) to prevent non-specific staining, followed by primary antibodies in PBS (overnight) and a mixture of fluorescein isothiocyanate (FITC)-conjugated, tetramethyl rhodamine isothiocyanate (TRITC)-conjugated, Alexa Fluor® 594- and Alexa Fluor® 488-conjugated secondary antibodies all diluted in PBS (Table 1), then coverslipped with buffered glycerol, pH 8.6. As the antibodies to Gαtran and Gαgust were generated in the same species, serial sections (3 μm thick) were used to test their colocalization.
Table 1.
List and dilution of primary and secondary antibodies
| Primary antibodies | Code | Species | Dilution | Supplier |
|---|---|---|---|---|
| α-Transducin | sc-390 | rabbit | 1:600 | Santa Cruz |
| α-Gustducin | sc-395 | rabbit | 1:500 | Santa Cruz |
| Chromogranin A | MON9014 | mouse | 1:1000 | Monosan |
| Gastrin/Cholecystokinin | GAS/CCK#9303 | mouse | 1:1000 | CURE/DDC |
| Ghrelin | sc-10368 | goat | 1:800 | Santa Cruz |
| Somatostatin | S6 | mouse | 1:1000 | CURE/DDC |
| Secondary antisera | Dilution | Supplier |
|---|---|---|
| Alexa 594-conjugated goat anti-mouse IgG | 1:800 | Mol. Probes |
| FITC-conjugated goat anti-rabbit IgG | 1:500 | Calbiochem |
| TRITC-conjugated donkey anti-rabbit IgG | 1:500 | Jackson |
| Alexa 488-conjugated donkey anti-goat IgG | 1:800 | Mol. Probes |
CURE/DDC, UCLA, Los Angeles, CA, USA; Chemicon International, Temecula, CA, USA; Monosan, Sanbio B.V. Frontstraat, Uden, the Netherlands; Santa Cruz Biotecnology, Inc., CA, USA.); Calbiochem-Novabiochem Corporation, San Diego, CA, USA; Molecular Probes, Eugene, OR., USA; Jackson ImmunoResearch Laboratories, Inc., West Grove, PA, USA).
Specificity of antibodies
Specificity of Gαtran, Gαgust and GAS/CCK antibodies has been tested by Western blot (Supplementary material) whereas specificity of CgA monoclonal antibody (clone LK2H10) has been previously reported 16. GHR antibody specificity was assessed by pre-adsorption with an excess of the homologous peptide (sc-10368 P, Santa Cruz, CA, USA) or another ghrelin peptide (code 031-52; Phoenix Pharmaceuticals, Inc., Burlingame, CA, USA). The pattern obtained with our S6 SOM antibody completely overlapped with that of SOM rabbit polyclonal antiserum (Monosan SANBIO B.V., Uden, The Netherlands-catalogue PS 204), whose specificity was shown by immunoblocking in the pig gut and pancreas.
Cell counting and statistical analysis
Cell counting was performed with a 40 × objective lens using a Zeiss Axioplan microscope (Carl Zeiss, Oberkochen, Germany) with appropriate filter cubes to discriminate different wave fluorescence, images were collected with a Polaroid DMC digital photocamera (Polaroid, Cambridge, Mass., USA) and minimal adjustment to brightness and contrast was performed with Corel Photo Paint and Corel Draw (Corel, Dublin, Ireland). Cell counting was performed in a blind fashion by two investigators.
For each piglet, Gαtran-IR cells were counted in 36 random microscope fields (each field, 0.28 mm2), for a total area of 10 mm2, in the cardiac, oxyntic and pyloric mucosa, in 50 random villi and glands in the small intestine, and in 50 crypts in the colon. Only villi/glands/crypts located perpendicularly to the mucosal surface were counted. The values were pooled for each experimental group (control, fasted and refed respectively) and, subsequently, the mean and the percentage were calculated. Values were expressed as mean ± standard deviation (SD). Data were analysed using anova One-Way (Graph Prism 4, GraphPad Software, Inc., La Jolla, CA, USA). Statistical significance was determined using the Student's t-test. A P < 0.05 was considered statistically significant.
Results
Distribution of Gαtran-IR cells in the GI tract
Gαtran-IR cells were detected throughout the whole pig GI tract (Fig. 1A–G), except the oesophagus and oxyntic mucosa. In the pylorus, intense Gαtran-IR was observed in the basal portion of the gastric gland and in the epithelial lining of the mucosal folds (Fig. 1A and F); Gαtran-IR cells had elongated, ‘bottle-like’, morphology with homogenously labelled cytoplasm (Fig. 1E and G). In the small intestine, a subset of cells along the crypt-villus axis showed Gαtran-IR (Fig. 1B, E and G), whereas in the large intestine, labelled cells were generally located in the surface and glandular epithelium (Fig. 1C and D). Most Gαtran-IR cells had two thin cytoplasmic prolongations, one extending to the endoluminal mucosal surface (Fig. 1E and G) and one to the basal lamina, suggesting they are ‘EEC open-type’ cells 1, 3. In the cardiac and pyloric mucosa, some cells were confined to the basal lamina and did not reach the lumen (Fig. 1F), like ‘EEC closed-type’ cells 1, 3.
Fig. 1.
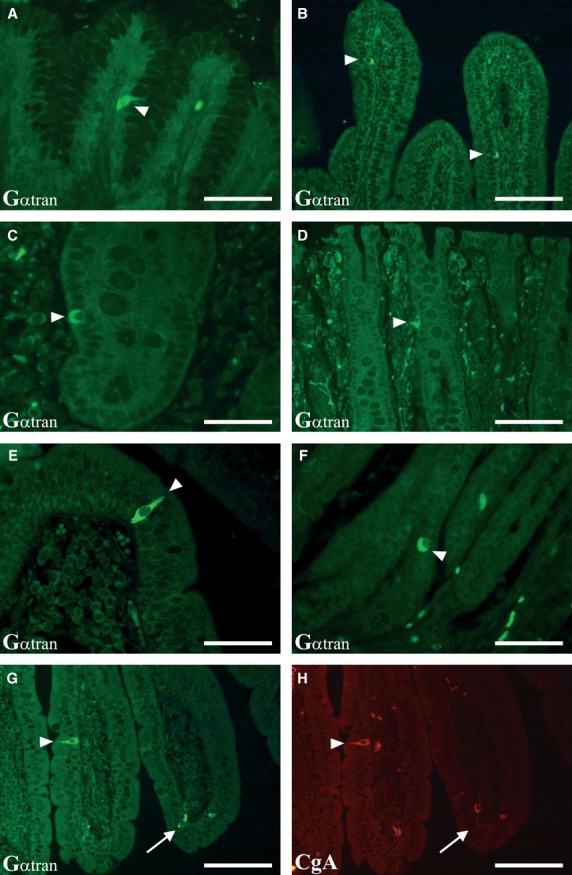
Localization of Gαtran-IR in the pig GI tract. A–D show images of Gαtran-IR cells in the pyloric (A), jejunum (B), caecum (C) and rectum (D) mucosa (arrowheads). Gαtran-IR cells have the morphology of open-type enteroendocrine cells in the top of the villi of the duodenum (E, arrowhead) and of closed-type enteroendocrine cells in the pyloric mucosa (F, arrowheads). The bottom images show a Gαtran-IR enteroendocrine cell expressing chromogranin A (CgA) (G and H, respectively; arrowheads); the arrow in G and H indicates a Gαtran-IR cell (G) not containing CgA-IR (H). A, C, E and F: scale bars = 50 μm; B, D, G and H: scale bars = 100 μm.
Distribution of the Gαtran-IR cells in different experimental groups
In the stomach, the highest density of Gαtran-IR cells was in the pylorus (there was an average of about 18.9 cells/mm2 or 5.3 cells per field); in the small intestine, the highest density of Gαtran-IR cells was in the duodenum followed by the jejunum and ileum, whereas in the large intestine it was in the rectum followed by descending colon, caecum and ascending colon (Fig. 2A and B). There was a decrease in the density of Gαtran-IR cells in fasted animals, which was significant in the cardiac mucosa (29.3 ± 0.8 versus 64.8 ± 1.3, P < 0.05 versus control), pylorus (98.8 ± 1.7 versus 190.8 ± 1.9, P < 0.0 l), caecum (8 ± 0.01 versus 15.5 ± 0.5, P < 0.01), descending colon (17.8 ± 0.3 versus 23 ± 0.6, P < 0.05) and rectum (15.3 ± 0.3 versus 27.5 ± 0.7, P < 0.05), but not in the other regions. Interestingly, refeeding restored the control level of Gαtran-IR cells in the cardiac mucosa (57 ± 1 versus 29.3 ± 0.8 in fasted, P < 0.01), but not in the pylorus, caecum, descending colon and rectum where the number of Gαtran-IR cells in refed was comparable to fasted pigs. In the jejunum, Gαtran-IR cells in the refed group were less than in the fasted condition and were significantly lower than in controls (9.3 ± 0.2 in refed versus 19 ± 0.3 in control, P < 0.01). In the ileum and ascending colon, the number of Gαtran-IR cells in fasted and refed animals was comparable to controls.
Fig. 2.
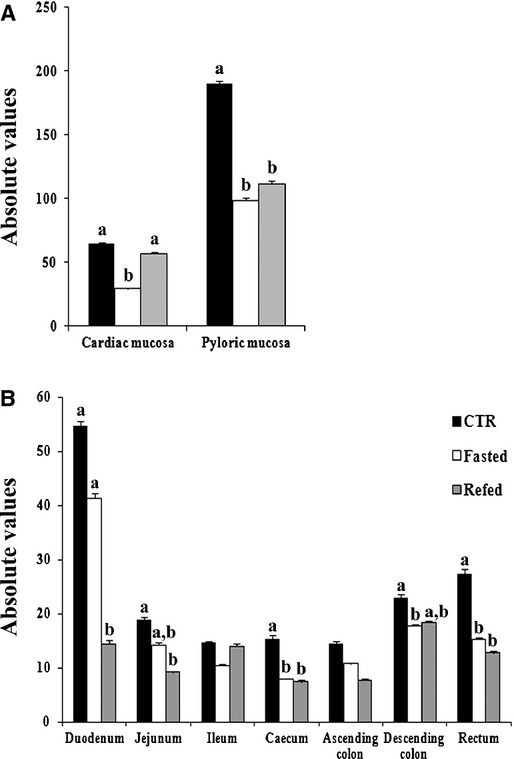
Graphs in A and B indicate the mean number of Gαtran-IR cells in the different segments of the pig GI tract. Controls, fasted and refed are denoted as black, white and grey bars respectively. Different letters indicate a significant (P < 0.05) statistical difference among groups. Values are expressed as mean ± SD.
Gαtran/CgA in the GI tract
The majority of Gαtran-IR cells co-expressed CgA: 99% of the Gαtran-IR cells in the cardiac and pyloric mucosa were immunopositive for CgA, whereas 83% and 98% of Gαtran-IR cells were immunopositive for CgA in the small and large intestine respectively. However, some cells were Gαtran-IR, but CgA negative (Fig. 1 G and H). In the stomach, Gαtran-IR/CgA-IR cells were numerous in the glandular epithelium.
The mean numbers of Gαtran/CgA-IR cells throughout the pig gut are reported in Table 2A. In the cardiac mucosa, the mean number of Gαtran/CgA-IR cells in control and refed groups is higher than that of fasted group (P < 0.05). In the pyloric mucosa, the mean number of Gαtran/CgA-IR cells in fasted and refed groups was lower than control (control versus fasted and control versus refed, P < 0.05). A general decrease in Gαtran/CgA-IR cells was observed in the small and large intestine in fasted and refed compared with control. Specifically, in the duodenum and jejunum, the Gαtran/CgA-IR cells were significantly decreased in refed compared with control (P < 0.05). Moreover, in the duodenum, we found a reduced number of Gαtran/CgA-IR cells in refed compared with fasted (P < 0.05). Gαtran/CgA-IR cells were more abundant in the caecum, descending colon and rectum of control group compared with fasted (P < 0.05), whereas in the caecum and in the rectum, refed showed a number of Gαtran/CgA-IR lower than control (P < 0.05). The percentage of the Gαtran on the total of CgA-IR cells have been indicated in Table 2B. Furthermore, there were no statistically significant differences in the absolute numbers of CgA-IR cells in the gastric and intestinal mucosa among the three experimental groups.
Table 2.
(A) Mean number of Gαtran/CgA-IR cells in the pig GI tract. (B) Percentage of Gαtran/total CgA-IR cells in the pig GI tract
| *Cardiac mucosa | *Pyloric mucosa | Duodenum | Jejunum | Ileum | Caecum | Ascending colon | Descending colon | Rectum | |
|---|---|---|---|---|---|---|---|---|---|
| (A) | |||||||||
| Control | 64.5 ± 1.2a | 190.8 ± 1.9a | 46.8 ± 0.8a | 15.8 ± 0.3a, b | 11.8 ± 0.3 | 15.3 ± 0.5a | 13.8 ± 0.5 | 23 ± 0.6a | 27.5 ± 0.7a |
| Fasted | 29 ± 0.8b | 96.8 ± 1.7b | 36 ± 0.9a | 12 ± 0.4b, c | 7 ± 0.2 | 8 ± 0.1b | 10.5 ± 0.2 | 17.5 ± 0.3b | 15.3 ± 0.3b |
| Refed | 56 ± 1a | 111.8 ± 1.9b | 11 ± 0.6b | 8 ± 0.2c | 13.3 ± 0.6 | 6.8 ± 0.3b | 7.8 ± 0.2 | 18.5 ± 0.3a, b | 12.8 ± 0.3b |
| (B) | |||||||||
| Control | 19% (258/1351) | 33.7% (763/2262) | 49% (187/381) | 36.2% (63/174) | 27% (47/174) | 50.4% (61/121) | 40.4% (55/136) | 16.5% (92/557) | 20.3% (110/543) |
| Fasted | 7% (116/1642) | 16% (387/2399) | 41.4% (144/348) | 23.9% (48/201) | 21.9% (28/128) | 24.4% (32/131) | 30.7% (42/137) | 21% (70/333) | 17% (61/359) |
| Refed | 15.7% (224/1429) | 17.6% (447/2546) | 23% (44/191) | 18.4% (32/174) | 31.2% (53/170) | 32.5% (27/83) | 27.7% (31/112) | 17% (74/434) | 12% (51/426) |
Values refer to a total area of 10 mm2 for each group. The other values represent the percentage evaluated in 50 villi and in 50 intestinal glands for each group, respectively.
Values with different superscripts within the same column differ significantly (P < 0.05).
Gαtran/GHR in the gastric mucosa
Gαtran/GHR-IR cells were numerous in the pylorus, from the neck to the base of the glands (Fig. 3A and B), and less abundant in cardiac glands (Fig. 3C and D). Most Gαtran/GHR cells were ‘closed-type’, lying at the gland basal lamina. Few Gαtran/GHR-IR cells in the surface epithelium were ‘open-type’ (Fig. 3C and D). In the cardiac and pyloric mucosa, approximately 96% and 91% of Gαtran-IR cells, respectively, co-expressed GHR. Gαtran/GHR-IR cells were significantly reduced in fasted versus control pigs in both cardiac mucosa (P < 0.01) and pylorus (P < 0.05). In refed, they were partly restored in the cardiac mucosa (P < 0.05), but not pylorus. The mean number and percentage of the Gαtran on the total of GHR-IR cells are reported in Table 3. In the cardiac mucosa, the number of GHR-IR cells decreased in fasted versus control (114.8 ± 29.4 versus 244.5 ± 71.3, P < 0.01), while it increased in refed versus fasted (241.3 ± 57.5 versus 114.8 ± 29.4, P < 0.01). There were no statistically significant differences in the mean numbers of GHR-IR cells in the pyloric mucosa among the three experimental groups.
Fig. 3.
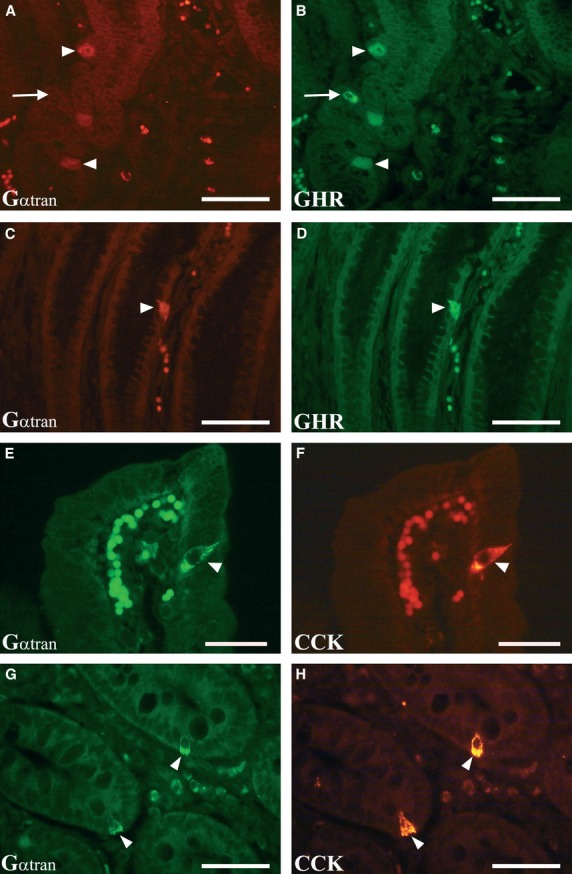
Colocalization of Gαtran-IR (A, C, E and G, arrowheads) with ghrelin (GHR) in the pyloric mucosa (B and D, arrowheads) and cholecystokinin (CCK) in the jejunum (F and H, arrowheads). In general, the Gαtran/GHR-labelled cells were found lying close to the basal lamina of the glands (typical closed-type morphology) (A and B, arrowheads); the arrows in A and B indicate a GHR-IR cell (B) not containing Gαtran-IR (A). In some cases, Gαtran/GHR-IR cells were observed in the surface epithelium (typical open-type morphology) (C and D, arrowheads). The Gαtran/CCK immunopositive cells were observed in the villi (E and F, arrowheads) and in the intestinal gland of the jejunum (G and H, arrowheads). A, B, C, D, G and H: scale bars = 50 μm; E and F: scale bars = 30 μm.
Table 3.
Mean number and percentage of the colocalized Gαtrans/total GHR-IR cells in the cardiac and pyloric mucosa
| Cardiac mucosa | Pyloric mucosa | |||
|---|---|---|---|---|
| Control | 84.8 ± 1.6a | 46% (339/735) | 168.8 ± 2.6a | 60.6% (675/1113) |
| Fasted | 26.8 ± 0.8b | 23.3% (107/459) | 97.5 ± 1.7b | 46.9% (390/831) |
| Refed | 49.8 ± 1a | 23.2.7% (199/857 | 107.5 ± 1.8a, b | 41.5% (430/1036) |
Values with different superscripts within the same column indicate statistical significance (P < 0.05).
Colocalization of Gαtran with CCK, SOM and Gαgust in the duodenum and jejunum
Co-expression of Gαtran and CCK was observed in open-type cells in the surface and glandular epithelium of the jejunum (Fig. 3E–H). As our monoclonal antibody cannot discriminate CCK and GAS, we could not assess the actual number of GAS and CCK-IR cells in the duodenum where both cell types are present. Few Gαtran/SOM cells (about 1 positive cell/400 villi) were detected (Fig. 4A and B). The mean number and percentage of the Gαtran compared with the total number of CCK-IR cells are reported in Table 4. In the jejunum, approximately 59% of Gαtran -IR cells co-expressed CCK. Gαtran/CCK-IR cells were reduced in fasted and refed compared with controls (P < 0.01) in the jejunum. Gαtran/CCK-IR cells were not visualized in the pylorus and cardiac mucosa (Fig. 4C and D). Finally, occasional Gαtran/Gαgust-IR cells were detected in the pylorus (Fig. 4C and D) and duodenum (Fig. 4E–H), which expressed CgA-IR (Fig. 4G and H). Furthermore, the number of CCK-IR cells decreased in fasted versus control (19.3 ± 2.5 versus 10.3 ± 1, P < 0.01), while no changes were observed in refed versus fasted and control groups.
Fig. 4.
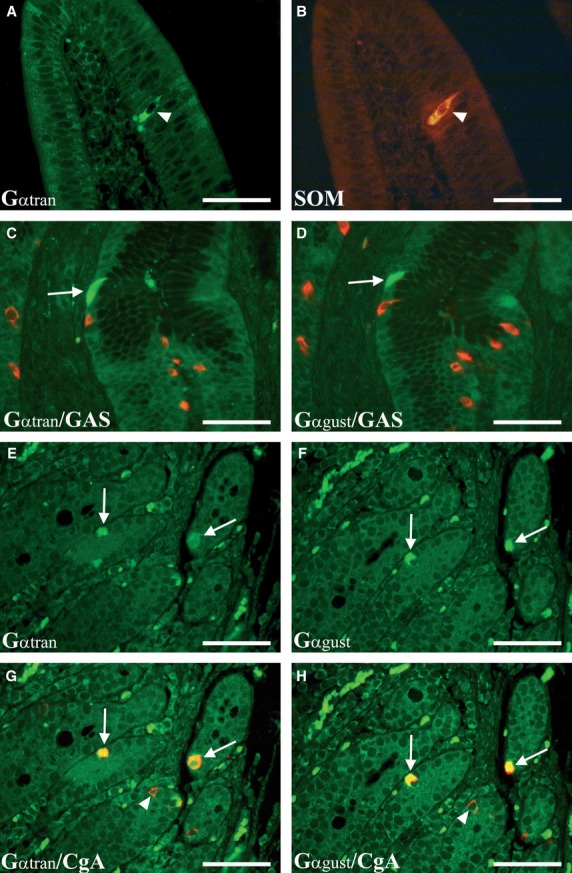
Enteroendocrine cells of the duodenum co-expressing Gαtran and SOM-IR (A and B, arrowheads). Some cells co-expressing Gαtran/Gαgust-IRs (C and D, arrows) (in green) were observed in the pyloric mucosa; these cells were negative for gastrin (GAS-IR) (in red). Photomicrographs E and F show co-expressing Gαtran- and Gαgust-IR enteroendocrine cells (in green) (arrows) in serial sections of the duodenum. The Gαtran and Gαgust colocalization is readily visible in G and H (merged images) with chromogranin A (CgA) (arrows) labelled by the red fluorochrome (arrowheads). A–H: scale bars = 50 μm.
Table 4.
Mean number and percentage of the colocalized Gαtran/total CCK-IR cells in the jejunum
| Control | 13.5 ± 0.3a | 70% (54/77) |
| Fasted | 8.8 ± 0.2b | 85.4% (35/41) |
| Refed | 9.5 ± 0.2b | 71.7% (38/53) |
Values with different superscripts within the same column indicate statistical significance (P < 0.05).
Discussion
Taste receptors are likely to represent an important mechanism for sensing nutrients and non-nutrients in the GI lumen and contribute to the initiation of appropriate physiological response of digestion/absorption of nutrients or elimination of harmful substances via activation of neuronal and endocrine pathways. We showed that (a) Gαtran cells are distributed throughout the GI tract in the pig, a commonly used animal model for studies of human GI physiology and ingestive behaviour, with the exception of the oesophagus and the oxyntic mucosa, (b) most Gαtran cells are EEC of the ‘open’ type, (c) many Gαtran cells contain GHR in the stomach and CCK in the small intestine, whereas a few contain SOM in the upper bowel, (d) some Gαtran cells contained Gαgust, and (e) fasting and refeeding changed the density of Gαtran-IR cells, effect that was statistically significant versus controls in most, but not all gut regions. These findings support the concept that TRs participate to chemosensing processes controlling multiple GI functions, including food intake and metabolism.
Our results expand previous reports of Gαtran or Gαgust in the rodent 3, 8–11, 17, pig 12, 13 and human 14 GI mucosa by showing a systematic analysis and characterization of mucosal cells expressing Gαtran in the pig intestine, an animal model closer to human than rodents, and providing evidence that the expression of this taste-related signalling molecule is modified by feeding and fasting. Gαtran-IR was predominantly in EECs, but the colocalization with CgA was not complete suggesting that Gαtran-IR is also in non-EECs (likely brush cells), as it has been shown for Gαgust in the mouse 10. On the other hand, in the human colon 14 and pig small intestine 13, Gαgust has been reported exclusively in EECs. Gαtran-IR cells had a different density throughout the gut, which was high in the stomach, decreased from the duodenum to the ileum, then increased from the caecum to the rectum. These findings are consistent with species and region differences and suggest that TRs exert distinct functions according to the gut region. Like Gαgust, Gαtran mediates signals initiated by tastants acting at T1Rs and the T2Rs 7, 18, 19. Thus, Gαtran cells are likely to serve different chemosensitive modalities depending upon the luminal content and the TR stimulated 19. The colocalization of Gαtran with GHR in the stomach, and CCK and SOM in the small intestine is in agreement with previous studies in rodents and human 8, 9, 11, 14, and in EECs lines 20. GHR is an orexigenic peptide regulating energy balance homeostasis 21, GI motility and secretion 22, and feeding behaviour 23, in several species including pigs 24. CCK exerts a prominent role in satiety conveying signals elicited by nutrients (e.g. fats and proteins) via sensory nerve pathways to the brain 25. SOM inhibits gastric acid secretion, gastric emptying and smooth muscle contraction and GI hormone release 26. Thus, the colocalization of Gαtran with these peptides is consistent with an involvement of TRs in the control of satiety and food intake, energy balance metabolism and GI secretion and motility.
Food deprivation and refeeding alter the morphology of the weaned pig GI tract mucosa with fasting inducing mucosa atrophy in the upper small intestine and refeeding partially restoring it 27. We demonstrated that 24 h fasting and 24 h refeeding modified the number of Gαtran-IR cells in most regions of the pig gut. The number of CgA-IR cells was not modified by fasting and refeeding in most regions with the exception of the caecum and descending colon, therefore it is unlikely that the reduction in Gαtran-IR cells observed in fasted and in some regions also in refed animals is due to mucosa atrophy or lack of mucosal restoration following refeeding, although this possibility cannot be excluded. Fasting induces multiple changes in the EEC system such as increasing GHR and lowering GAS/CCK 28, 29 peptides that influence feeding behaviour and colocalize with Gαtran-IR. Our results indicated that in the cardiac and pyloric mucosa, the number of Gαtran/GHR cells is greater in normally fed compared with 24 h fasted piglets; similarly, the overall density of GHR-IR cells was lower in fasted than fed or refed animals. However, the increased Gαtran/GHR-IR cell expression, as observed during refeeding state in our model, may not necessarily correspond to increased GHR plasma levels during fasting. A significant increase in plasma GHR was reported 30 in weaning pigs following 36 h fasting, with a decrease with 12 h fasting, indicating that the length of food deprivation affects GHR response. Animal ages might also affect hormonal responses to fasting, as young animals possess fewer energy reserves and less body fat, while having higher energy requirements in relation to rapid body growth 31. Our data showed a significant reduction in Gαtran/CCK-IR cells and in CCK-IR cells overall in fasted and refed pigs compared with controls. This is in agreement with previous reports of a decrease in CCK plasma concentrations and mRNA expression during fasting, while returning to pre-fasting values after either 24 h refeeding in the rat small intestine 32 and 1 h refeeding in lactating sows 33. However, the reasons why in this study we did not detect an increase in Gαtran/CCK-IR cells during refeeding remain to be elucidated. It is possible that factors such as caloric intake, type of diet and slaughter time after refeeding may contribute to explain why CCK cells do not return to pre-fasting values.
In summary, TRs and downstream molecules might exert a variety of functions ranging from sensing beneficial nutrients (e.g. sweet and umami), thus inducing secretion and motility to facilitate digestion, absorption and food intake, to detection of bitter, potentially harmful substances, thus inducing a defensive response. The latter could be in the form of inhibition of gastric emptying to reduce absorption, increase in intestinal secretion to facilitate elimination, vomiting or avoidance. Taste-related molecules in the distal colon and rectum could also serve as a line of defence against bacteria, which are particularly abundant in these regions. This is supported by the findings that quorum-sensing molecules produced by Gram-negative bacteria activate a GPCR-mediated signalling cascade in EEC lines, which is likely to involve T2R (Sternini C and Rozengurt E, unpublished). Further studies are required to better understand TR functions in the GI tract in response to feeding, including their regulation with specific dietary components in relationship to peptide release in different regions of the GI tract.
Acknowledgments
Grant support: The present work was supported by NIH grants DK79155 and 41301 (C.S.), and grants from the Italian Ministry of Education, University and Research (MIUR) (PRIN2009) (R. De G.), from ‘Fondazione Del Monte di Bologna e Ravenna’, Italy and funds from the University of Bologna (R. De G. and P.C.). We are grateful to Dr. Chiara Bernardini, Department of Medical Veterinary Sciences, University of Bologna, for her valuable technical assistance with Western blot experiments.
Conflict of interest
The authors have no conflicts of interest.
Supporting information
Additional Supporting Information may be found in the online version of this article:
Data S1 Expression and regulation of a-transducin in the pig gastrointestinal tract
References
- 1.Dockray GJ. Luminal sensing in the gut: an overview. J Physiol Pharmacol. 2003;54:9–17. [PubMed] [Google Scholar]
- 2.Furness JB, Kunze WA, Clerc N. Nutrient tasting and signaling mechanisms in the gut. II. The intestine as a sensory organ: neural, endocrine, and immune responses. Am J Physiol. 1999;277:G922–8. doi: 10.1152/ajpgi.1999.277.5.G922. [DOI] [PubMed] [Google Scholar]
- 3.Sternini C, Anselmi L, Rozengurt E. Enteroendocrine cells: a site of ‘taste’ in gastrointestinal chemosensing. Curr Opin Endocrinol Diabetes Obes. 2008;15:73–8. doi: 10.1097/MED.0b013e3282f43a73. [DOI] [PMC free article] [PubMed] [Google Scholar]
- 4.Sternini C. Taste receptors in the gastrointestinal tract. IV. Functional implications of bitter taste receptors in gastrointestinal chemosensing. Am J Physiol Gastrointest Liver Physiol. 2007;292:G45761. doi: 10.1152/ajpgi.00411.2006. [DOI] [PubMed] [Google Scholar]
- 5.Chandrashekar J, Mueller KL, Hoon MA, et al. T2Rs function as bitter taste receptors. Cell. 2000;100:703–11. doi: 10.1016/s0092-8674(00)80706-0. [DOI] [PubMed] [Google Scholar]
- 6.Nelson G, Hoon MA, Chandrashekar J, et al. Mammalian sweet taste receptors. Cell. 2001;106:381–90. doi: 10.1016/s0092-8674(01)00451-2. [DOI] [PubMed] [Google Scholar]
- 7.Margolskee RF. Molecular mechanisms of bitter and sweet taste transduction. J Biol Chem. 2002;277:1–4. doi: 10.1074/jbc.R100054200. [DOI] [PubMed] [Google Scholar]
- 8.Höfer D, Puschel B, Drenckhahn D. Taste receptor-like cells in the rat gut identified by expression of alpha-gustducin. Proc Natl Acad Sci USA. 1996;93:6631–4. doi: 10.1073/pnas.93.13.6631. [DOI] [PMC free article] [PubMed] [Google Scholar]
- 9.Wu SV, Rozengurt N, Yang M, et al. Expression of bitter taste receptors of the T2R family in the gastrointestinal tract and enteroendocrine STC-1 cells. Proc Natl Acad Sci USA. 2002;99:2392–7. doi: 10.1073/pnas.042617699. [DOI] [PMC free article] [PubMed] [Google Scholar]
- 10.Sutherland K, Young RL, Cooper NJ, et al. Phenotypic characterization of taste cells of the mouse small intestine. Am J Physiol Gastrointest Liver Physiol. 2007;292:G1420–8. doi: 10.1152/ajpgi.00504.2006. [DOI] [PubMed] [Google Scholar]
- 11.Janssen S, Laermans J, Verhulst PJ, et al. Bitter taste receptors and α-gustducin regulate the secretion of ghrelin with functional effects on food intake and gastric emptying. Proc Natl Acad Sci USA. 2011;108:2094–9. doi: 10.1073/pnas.1011508108. [DOI] [PMC free article] [PubMed] [Google Scholar]
- 12.Clavenzani P, De Giorgio R, Mazzoni M, et al. Expression of α-transducin, a chemoreceptive molecule, in endocrine and non endocrine cells of the pig gastrointestinal tract. Vet Res Commun. 2009;33:S85–7. doi: 10.1007/s11259-009-9253-0. [DOI] [PMC free article] [PubMed] [Google Scholar]
- 13.Moran AW, Al-Rammahi MA, Arora DK, et al. Expression of Na+/glucose co-transporter 1 (SGLT1) is enhanced by supplementation of the diet of weaning piglets with artificial sweeteners. Br J Nutr. 2010;104:637–46. doi: 10.1017/S0007114510000917. [DOI] [PubMed] [Google Scholar]
- 14.Rozengurt N, Wu SV, Chen MC, et al. Colocalization of the alpha-subunit of gustducin with PYY and GLP-1 in L cells of human colon. Am J Physiol Gastrointest Liver Physiol. 2006;291:G792–802. doi: 10.1152/ajpgi.00074.2006. [DOI] [PubMed] [Google Scholar]
- 15.Höfer D, Drenckhahn D. Identification of the taste cell G-protein, alpha-gustducin, in brush cells of the rat pancreatic duct system. Histochem Cell Biol. 1998;110:303–9. doi: 10.1007/s004180050292. [DOI] [PubMed] [Google Scholar]
- 16.Lukinius A, Stridsberg M, Wilander E. Cellular expression and specific intragranular localization of chromogranin A, chromogranin B, and synaptophysin during ontogeny of pancreatic islet cells: an ultrastructural study. Pancreas. 2003;27:38–46. doi: 10.1097/00006676-200307000-00006. [DOI] [PubMed] [Google Scholar]
- 17.Hass N, Schwarzenbacher K, Breer H. A cluster of gustducin-expressing cells in the mouse stomach associated with two distinct population of enteroendocrine cells. Histochem Cell Biol. 2007;128:457–71. doi: 10.1007/s00418-007-0325-3. [DOI] [PubMed] [Google Scholar]
- 18.Ruiz-Avila L, McLaughlin SK, Wildman D, et al. Coupling of bitter receptor to phosphodiesterase through transducing in taste receptor cells. Nature. 1995;376:80–5. doi: 10.1038/376080a0. [DOI] [PubMed] [Google Scholar]
- 19.He W, Danilova V, Zou S, et al. Partial rescue of taste responses of alpha-gustducin null mice by transgenic expression of alpha-transducin. Chem Senses. 2002;27:719–27. doi: 10.1093/chemse/27.8.719. [DOI] [PubMed] [Google Scholar]
- 20.Chen MC, Wu SV, Reeve JR, Jr, et al. Bitter stimuli induce Ca2 + signaling and CCK release in enteroendocrine STC-1 cells: role of L-type voltage-sensitive Ca2 + channels. Am J Physiol Cell Physiol. 2006;291:C726–39. doi: 10.1152/ajpcell.00003.2006. [DOI] [PubMed] [Google Scholar]
- 21.Horvath TL, Diano S, Sotonyi P, et al. Minireview: ghrelin and the regulation of energy balance–a hypothalamic perspective. Endocrinology. 2001;142:4163–9. doi: 10.1210/endo.142.10.8490. [DOI] [PubMed] [Google Scholar]
- 22.Masuda Y, Tanaka T, Inomata N. Ghrelin stimulates gastric acid secretion and motility in rats. Biochem Biophys Res Commun. 2000;276:905–8. doi: 10.1006/bbrc.2000.3568. [DOI] [PubMed] [Google Scholar]
- 23.Wren AM, Small CJ, Ward HL, et al. The novel hypothalamic peptide ghrelin stimulates food intake and growth hormone secretion. Endocrinology. 2000;141:4325–8. doi: 10.1210/endo.141.11.7873. [DOI] [PubMed] [Google Scholar]
- 24.Salfen BE, Carroll JA, Keisler DH, et al. Effects of exogenous ghrelin on feed intake, weight gain, behavior, and endocrine responses in weanling pigs. J Anim Sci. 2004;82:1957–66. doi: 10.2527/2004.8271957x. [DOI] [PubMed] [Google Scholar]
- 25.Cummings DE, Overduin J. Gastrointestinal regulation of food intake. J Clin Invest. 2007;17:13–23. doi: 10.1172/JCI30227. [DOI] [PMC free article] [PubMed] [Google Scholar]
- 26.Van Op den Bosch J, Adriaensen D, Van Nassauw L, et al. The role(s) of somatostatin, structurally related peptides and somatostatin receptors in the gastrointestinal tract: a review. Regul Pept. 2009;156:1–8. doi: 10.1016/j.regpep.2009.04.003. [DOI] [PubMed] [Google Scholar]
- 27.Lallès JP, David JC. Fasting and refeeding modulate the expression of stress proteins along the gastrointestinal tract of weaned pigs. J Anim Physiol Anim Nutr(Berl) 2011;95:478–88. doi: 10.1111/j.1439-0396.2010.01075.x. [DOI] [PubMed] [Google Scholar]
- 28.Toshinai K, Mondal MS, Nakazato M, et al. Upregulation of Ghrelin expression in the stomach upon fasting, insulin-induced hypoglycemia, and leptin administration. Biochem Biophys Res Commun. 2001;281:1220–5. doi: 10.1006/bbrc.2001.4518. [DOI] [PubMed] [Google Scholar]
- 29.Wu V, Sumii K, Tari A, et al. Regulation of rat antral gastrin and somatostatin gene expression during starvation and after refeeding. Gastroenterology. 1991;101:1552–8. doi: 10.1016/0016-5085(91)90391-w. [DOI] [PubMed] [Google Scholar]
- 30.Salfen BE, Carroll JA, Keisler DH. Endocrine responses to short-term feed deprivation in weanling pigs. J Endocrinol. 2003;178:541–51. doi: 10.1677/joe.0.1780541. [DOI] [PubMed] [Google Scholar]
- 31.Barb CR, Kraeling RR, Rampacek GB, et al. Metabolic changes during the transition from the fed to the acute feed-deprived state in prepuberal and mature gilts. J Anim Sci. 1997;75:781–9. doi: 10.2527/1997.753781x. [DOI] [PubMed] [Google Scholar]
- 32.Kanayama S, Liddle RA. Influence of food deprivation on intestinal cholecystokinin and somatostatin. Gastroenterology. 1991;100:909–15. doi: 10.1016/0016-5085(91)90263-k. [DOI] [PubMed] [Google Scholar]
- 33.Rojkittikhun T, Uvnäs-Moberg K, Einarsson S. Plasma oxytocin, prolactin, insulin and LH after 24 h of fasting and after refeeding in lactating sows. Acta Physiol Scand. 1993;148:413–9. doi: 10.1111/j.1748-1716.1993.tb09577.x. [DOI] [PubMed] [Google Scholar]
Associated Data
This section collects any data citations, data availability statements, or supplementary materials included in this article.