Abstract
Purpose
To present a framework for characterizing the data needed to implement a polyenergetic model-based statistical reconstruction algorithm, Alternating Minimization (AM), on a commercial fan-beam CT scanner and a novel method for assessing the accuracy of the commissioned data model.
Methods
The x-ray spectra for three tube potentials on the Philips Brilliance CT scanner were estimated by fitting a semi-empirical x-ray spectrum model to transmission measurements. Spectral variations due to the bowtie filter were computationally modeled. Eight homogeneous cylinders of PMMA, Teflon and water with varying diameters were scanned at each energy. Central-axis scatter was measured for each cylinder using a beam-stop technique. AM reconstruction with a single-basis object-model matched to the scanned cylinder’s composition allows assessment of the accuracy of the AM algorithm’s polyenergetic data model. Filtered-backprojection (FBP) was also performed to compare consistency metrics such as uniformity and object-size dependence.
Results
The spectrum model fit measured transmission curves with residual root-mean-square-error of 1.20% to 1.34% for the three scanning energies. The estimated spectrum and scatter data supported polyenergetic AM reconstruction of the test cylinders to within 0.5% of expected in the matched object-model reconstruction test. In comparison to FBP, polyenergetic AM exhibited better uniformity and less object-size dependence.
Conclusions
Reconstruction using a matched object-model illustrate that the polyenergetic AM algorithm’s data model was commissioned to within 0.5% of an expected ground truth. These results support ongoing and future research with polyenergetic AM reconstruction of commercial fan-beam CT data for quantitative CT applications.
Keywords: quantitative computed tomography, alternating minimization, polyenergetic statistical reconstruction, model-based statistical iterative reconstruction
1. Introduction
Quantitative computed tomography (CT) applications such as bone mineral density measurement[1, 2], measurement of blood perfusion[3, 4], and dual-energy CT for either material characterization[5] or direct estimation of radiological cross-section information[6] all rely on accurate relationships between measured CT intensities and the underlying tissue property of interest[7]. For quantitative CT applications, the measured CT image intensity for a given material should be independent of subject size, location within the subject and location of the subject within the scanner’s field-of-view (FOV). We refer to these requirements as image intensity consistency criteria. Conventional filtered backprojection (FBP) reconstruction algorithms for x-ray CT assume that acquired data are noiseless, linear functions of the attenuation line integral along each source-detector ray. However, inherent non-linearities in the CT data acquisition process lead to systematic deviations in reconstructed images, which undermine the consistency criteria for quantitative CT if not properly corrected for. As the x-ray energy spectrum is polyenergetic, low energy photons are preferentially attenuated in the scan subject, an effect called beam-hardening (BH), causing the characteristic cupping artifact[8, 9]. It is also well known that scattered radiation causes similar systematic cupping artifacts in reconstructed images[10–12]. Conventional FBP reconstructions often rely on empirical data correction schemes to linearize the data prior to backprojection, in an attempt to alleviate the effects of BH and scatter. However, residual cupping artifacts often remain for objects of larger size or composition that deviates considerably from water.
The specific long-term radiotherapy application for this work is in improving patient-specific dose calculation accuracy for low energy brachytherapy. For low energy kV brachytherapy sources, such as I-125, Pd-103, or the new Xoft electronic brachytherapy source, tissue composition differences have been shown to lead to significant dose deviations of up to 30% from the water equivalent composition assumed by TG-43[13–17]. Acquiring patient-specific tissue composition information has been identified as one of the critical tasks needed for more accurate model-based dose calculation such as Monte Carlo in low energy brachytherapy[18, 19].
Single-energy CT (SECT) data can be used to estimate electron density for heterogeneity corrections in the MeV range where Compton scattering dominates, but is unsuitable for the low keV range due to the increased probability of photoelectric absorption, which is strongly dependent on a material’s atomic number. Dual-energy CT (DECT) has been proposed as one potential method for estimating the patient-specific material information for model-based dose calculation in this energy range. However, Williamson et al. have shown that the DECT models are highly sensitive to errors in the reconstructed images; for example 1% reconstructed image error propagates to 5% cross-section uncertainty through the DECT process[6]. Other interesting methods of utilizing multi-energy CT information to estimate material composition show promise in the literature, for example using energy-resolved photon counting detectors[20], however this requires specialized detector hardware that will certainly increase system cost. Our group’s goal is to investigate the feasibility of performing DECT cross-section estimation on existing commercial CT scanners that utilize more conventional energy-integrating detectors in support of improved low energy dose calculation.
While conventional FBP algorithms are fast and efficient, the sensitivity of the DECT process to reconstructed image errors from model-data mismatch makes FBP suboptimal for performing DECT on commercial polyenergetic energy-integrating CT scanner platforms. Model-based statistical iterative reconstruction (SIR) algorithms are well-suited to reducing these systematic image reconstruction errors, as they offer the flexibility of incorporating a more physically realistic model of CT signal formation. Indeed, previous studies have shown that incorporating the polyenergetic nature of the x-ray spectrum directly into the reconstruction reduces the systematic bias of the cupping artifact from beam-hardening[21–26]. For example, De Man et al.[25] presented a SIR algorithm that incorporates a polyenergetic x-ray spectrum estimate in its data model. Both synthetic (noiseless and scatter-free) datasets and measured sinogram datasets exported from a commercial Siemens scanner were used to qualitatively illustrate improved image quality relative to FBP. Elbakri et al.[22] also employed a simulation study to quantify the reduction of systematic error from beam-hardening for their polyenergetic SIR algorithm. In addition, they used energy-uncompensated sinogram data acquired on a table-top x-ray CT system of a 15 cm diameter water phantom to validate their polyenergetic statistical algorithm’s estimation of density to within 1.2% for potassium phosphate solutions of varying concentrations.
The work reported here employs one such model-based statistical iterative reconstruction algorithm, the Alternating Minimization (AM) algorithm, to reduce systematic image errors reconstructed from data acquired on a commercially available CT scanner, which will in turn minimize the uncertainty that is propagated through the highly sensitive DECT process to estimated photon cross-sections. As discussed in Beister et al.’s review paper on iterative reconstruction methods[27], one challenge with incorporating the polyenergetic nature of a scanner’s x-ray beam into the SIR physical model is that detailed knowledge of the x-ray spectrum is required. Effects of bowtie filters, detector material and geometry, and tube filtration must all be incorporated in the spectral model. Presented here is a framework for characterizing the spectrum and scatter information of a commercially available CT scanner for reconstruction with the model-based Alternating Minimization algorithm. In comparison to the previous polyenergetic SIR work of Elbakri et al.[21, 22] and De Man et al.[25], we employ a measurement-based approach to estimate the CT scanner’s equivalent x-ray spectrum. The scanner’s x-ray spectral distribution is estimated from measured attenuation curves for a series of aluminum and copper filters. The affect of the bowtie filter on the spectrum is computationally modeled using the known geometry. The signal contribution from scatter is estimated using a beam-stop technique.
Other than the estimation of potassium phosphate concentrations by Elbakri and colleagues[22], the previous assessments of the polyenergetic SIR algorithm’s accuracy has been largely qualitative or limited to well-controlled simulation studies. Here we present a novel method to quantitatively assess the accuracy of our algorithm’s data model in reconstructing commercially acquired CT data. Homogeneous cylinders of water, PMMA and Teflon with varying diameters are scanned as test objects. A single-basis object model that is matched to the cylinder material is used for polyenergetic AM reconstruction, allowing comparison to an expected ground truth value. Conventional FBP reconstruction is also performed for comparison of image uniformity and object-size dependence. In addition, an example of the sensitivity of the reconstructed images to spectral mismatch is presented and residual artifacts presented for future investigation.
In light of the clinical rationale for the project, we hypothesize that the polyenergetic AM algorithm with a carefully commissioned data model can reconstruct images with less than 0.5% systematic uncertainty, in support of our intended radiotherapy application of dual-energy CT photon cross-section estimation[6]. The methods and analysis presented here form the first steps of ongoing and future projects that utilize the polyenergetic AM algorithm for reconstruction of data acquired on a commercial CT scanner.
2. Materials and methods
2.1. The polyenergetic Alternating Minimization reconstruction algorithm
CT image reconstruction was carried out for axial data acquired on the Philips Brilliance Big Bore CT scanner as described in section 2.2 below. The 2-D image space, x, is composed of 512 × 512 rectangular image pixels, each with a length of 1.0 mm on a side. The CT sinogram data space, y=(γ,β), is defined by the angle of each source-detector ray, γ, and each gantry angle, β.
The polyenergetic Alternating Minimization (AM) algorithm is only briefly presented here. For a more complete description and derivation of the algorithm, the reader is referred to O’Sullivan’s 2007 paper[23]. An object is represented in image space as a map of linear attenuation coefficients, µ(x,E), that depend on spatial location, x, and energy, E. The AM algorithm’s object-model, thus represents the material at location x as a weighted sum of N basis materials:
| (1) |
where µi(E) denotes the linear attenuation spectrum of the i-th basis material. The AM algorithm will reconstruct N images that represent the partial density of each basis material in each voxel, ci(x).
The polyenergetic forward model, i.e. the data model, is used to calculate the expected data means from the current image estimate, c(x) = (c1(x),⋯,cN(x)) according to
| (2) |
Here I0(y,E) denotes the x-ray particle fluence spectrum incident on the scan subject. The dependence on y allows for x-ray spectra that vary for each detector element γ, for example when a bowtie filter is utilized, and each gantry angle β, e.g., for example when tube current modulation is employed. Incorporating the x-ray energy spectrum directly in the AM algorithm’s forward model represents an implicit beam-hardening correction. Thus, the polyenergetic AM algorithm operates on energy-uncompensated data. Acquiring data from the scanner without beam-hardening correction is described in section 2.2. Accounting for effects such as energy-integrating detectors and the bowtie filter in the spectral model is discussed in detail in section 2.3. An estimate of background events, i.e., scattered radiation, can also be incorporated in the data model and is represented by σ(y), which can also vary for each source-detector ray and gantry angle. Scatter estimation is described in section 2.4. The system matrix, h(y | x), is the average distance traveled by photons crossing pixel x that are incident on the face of detector γ for gantry angle β and is pre-computed to increase the speed of the iterative algorithm.
The AM algorithm reformulates the classic maximization of the Poisson log-likelihood as an alternating minimization of Csiszar’s I-divergence[28], an information-theoretic measure of discrepancy between two functions, the measured data d(y) and the expected data means g(y:c):
| (3) |
where c′ is the current image estimate. The I-divergence is proportional to the negative of the Poisson log-likelihood, which means that minimization of the I-divergence is equivalent to maximization of the log-likelihood. Even though transmission CT measurements are more accurately described by the compound Poisson distribution[29], the simple Poisson distribution is commonly assumed by statistical iterative reconstruction algorithms for computational efficiency. Lasio et al. have shown the use of a simple Poisson-based SIR algorithm in reconstructing Compound Poisson projection data does not significantly affect the reconstructed image even for data with very low SNR[30].
The AM algorithm’s iterative update strategy, described in detail in O’Sullivan et al.’s detailed description of the AM algorithm[23], will reconstruct N images that represent the partial density of each basis material in each voxel, ci(x) that minimize the difference, according to the I-divergence discrepancy metric, between the measured data and the data model’s expected mean value. In this work, a single basis object model (N=1) is employed to assess the accuracy with which the data model, g(y:c) of equation (2), is commissioned. In the case of a single-basis object-model (N=1) that is matched to the material of the scan subject, we expect the reconstructed image to be c(x) = 1.0.
A log-cosh penalty term is added to the data discrepancy metric, the I-divergence, in the AM algorithm’s objective function to enforce the a priori assumption of image smoothness:
| (4) |
where the Lagrange multiplier, α, controls the relative weight of the penalty function. A value of α=3−4 was used for all AM reconstructions. This value was empirically chosen from prior work investigating the noise and resolution properties of the log-cosh penalized AM algorithm in comparison to conventional FBP[31]. The roughness penalty computes the penalty for each pixel x as a function of its neighboring pixel intensities. The edge-preserving log-cosh penalty function[22, 32] used in this work is defined as
| (5) |
where N(x) is the set of pixels in the local neighborhood about x. Here the four directly adjacent pixels are weighted as w(x′) = 1 and all other pixels as w(x′) = 0. The parameter δ controls the pixel intensity difference for which the penalty transitions from quadratic to linear growth. The value of δ = 15 used in this study corresponds to a transition at intensity differences of 10% from background. As the purpose of this work is to assess systematic errors, image noise was not matched between the AM and FBP images of the same data. For a more detailed discussion of the log-cosh penalty function in the AM algorithm, the reader is referred to Evans et al.[31, 33]. Ordered subsets were utilized to increase the convergence rate[34]. AM images were reconstructed using 512 to 1024 iterations and 33 ordered subsets, which was found to ensure that convergence was achieved in all cases investigated.
2.2. CT data acquisition and processing
All of the CT data in this work was acquired on a Philips Brilliance Big Bore 16-slice scanner. The Brilliance scanner is a 3rd generation, i.e., rotate-rotate, scanner used in Virginia Commonwealth University’s radiation oncology clinic. All data was acquired with an axial acquisition protocol, (identified as the “axial pelvis” protocol in the vendor’s software) with detector slice thickness of 0.75 mm and beam collimation of 3.0 mm, allowing 4 slices per rotation to be acquired. The raw data, corrected only for dark current, were then exported to a PC for processing and reconstruction.
Proprietary software provided by Philips enabled us to apply or omit any of the standard data preprocessing corrections to the exported data. Standard system corrections such as detector gain, reference detector normalization, slice normalization and crosstalk were applied to all data in this work. Two sets of processed data were generated from each raw dataset; one with the vendor’s proprietary empirical beam hardening (BH) correction turned on for comparison to conventional FBP reconstruction, and one with the BH correction omitted for reconstruction with the polyenergetic AM algorithm. The vendor’s BH correction is a water-equivalent polynomial fit. Also of note is that the Brilliance scanner utilizes a 1-D anti-scatter grid (ASG) for physical scatter rejection and does not apply any additional scatter correction to the data.
2.3 Equivalent x-ray energy spectrum estimation
The x-ray spectrum for a particular scanner model may be obtained from the manufacturer, as in De Man et al.’s 2001 article[25]. Monte Carlo methods can also be used to estimate a scanner’s x-ray energy spectrum, as in Elbakri et al.’s 2003 study, but this requires the CT scanner’s beam transport and x-ray tube geometry to be fully and accurately characterized, along with the electrical potential waveform between the cathode and anode. However, both methods may contain residual errors from the “ideal” manufacturer model of the scanner due to scanner-specific differences. These spectrum discrepancies can affect the quantitative accuracy of the model-based statistical reconstruction[22]. In Liangjun Xie’s Ph.D. thesis on early work with the polyenergetic AM algorithm, a simulation study illustrated that a spectrum having mean energy in error by 2keV caused systematic errors in the reconstructed image intensities of 2%; enough to compromise the accuracy of our intended DECT application.
In this work, a measurement-based method of spectrum estimation is employed to allow scanner-specific spectrum differences to be incorporated in the data model. While measurement using an energy-selective detector is the most direct method to quantify the energy spectrum of a given x-ray beam, it is time consuming and costly as it requires specialized equipment. As an alternative, we adopted Boone’s equivalent spectrum method[35, 36] in which a spectrum model is fit to measured attenuation data. The equivalent x-ray spectrum is thus an idealized x-ray energy distribution that matches the attenuation properties of the actual scanner’s spectrum.
The work herein utilized the well-established Birch-Marshall (BM) semi-empirical model for a tungsten-anode x-ray tube[37], which includes characteristic x-rays. The BM model, ΦBM (E | kVp,mmAl), is a function of the known anode angle and two unknown free parameters, tube potential (kVp) and millimeters of inherent aluminum filtration (mmAl). It has been shown that the BM model using the known tube parameters overestimates the high-energy component of the spectrum, though Ay et al. found the differences between the BM modeled and measured spectra to be not statistically significant[38]. The equivalent spectrum method described here ensures that the estimated spectrum has a proper distribution of high and low energy photons, since the BM model parameters are fit to the energy-dependence of measured attenuation data.
For each tube potential investigated in this work (90, 120 and 140 kVp), attenuation through stacks of aluminum (Al) and copper (Cu) of varying total thickness was measured on central-axis (CAX). Fitting to attenuation curves of two materials with different energy dependence has been shown to better condition the equivalent spectrum estimation, since there are two main interaction mechanisms in the diagnostic energy range[39]. Fifteen Al thicknesses from 2.1 mm to 42.9 mm and fifteen Cu thicknesses from 1.0 mm to 15.4 mm were used, with the maximum thickness for each material chosen to attenuate the beam to roughly 10−3 of the primary intensity. A 2.1 mm thick Al filter was always placed immediately downstream of the Cu filter stack to avoid contaminating the detected signal with the 9 keV characteristic x-rays of Cu.
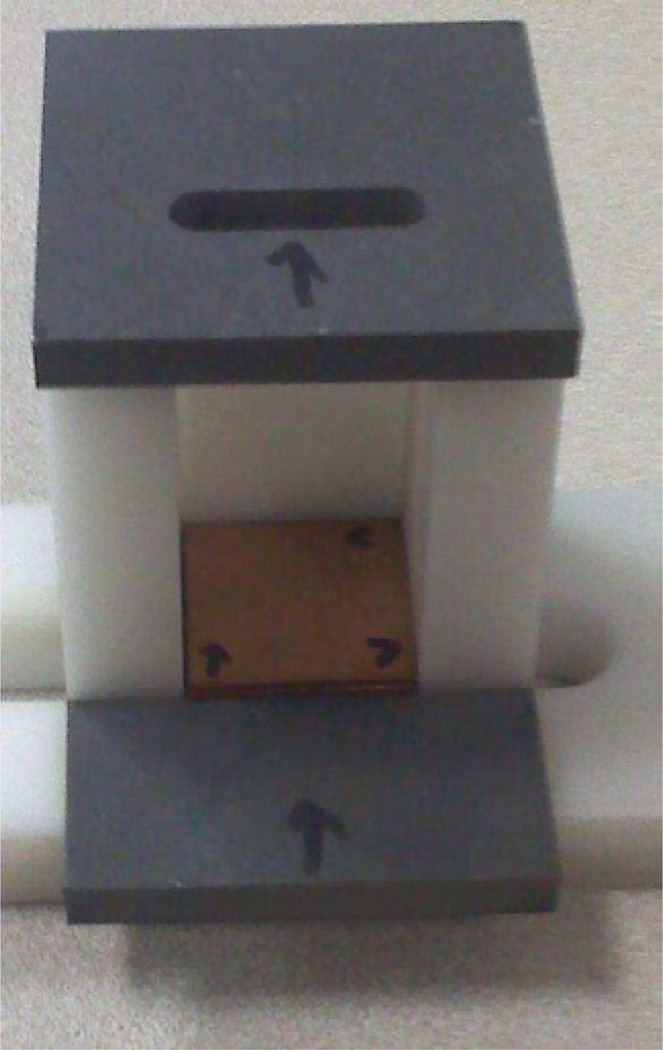
Narrow beam geometry was achieved by use of a collimator assembly as shown in figure 1. The phantom was immobilized such that the collimator opening was aligned to the central-axis (CAX) detector position (γ=0), and was hung off the front of the CT table to avoid table attenuation and scatter. The collimator opening is ¼” wide allowing for roughly 5 to 6 detectors near the central axis to be irradiated. The scanner was operated in scout view mode with the gantry parked at the 6 o’clock position (β=180°) and the table translated through the beam (z-direction) to collect multiple readings through each filter stack. In the Brilliance scanner, the same bowtie filter is used in scout view as for the axial data acquisition mode. At least 100 detector readings from the center of the collimator opening were averaged from the projection data to reduce statistical variation in each measurement. All data acquired for estimation of the x-ray spectrum were processed with all the vendor-supplied system corrections, except for the BH correction which was omitted. The ratio of detector signals I through the collimator assembly with and without a filter stack in place form the experimental measurement of attenuation, where t indexes the 30 measurements through stacks of Al and Cu of varying total thickness:
| (6) |
Figure 1.
The attenuation measurement collimator assembly used for equivalent spectrum fitting. Stacks of high purity Al and Cu filters are placed in the phantom. The lead collimators are ¼” thick to block scattered radiation. The collimator opening is ¼” wide allowing approximately 5 to 6 detectors to be irradiated per view, and ¾” long in the z-direction allowing approximately 400 views to be acquired as the table translates in surview mode.
The expected transmission for a BM model spectrum ΦBM (E | kVp,mmAl), through a stack of filters t with total thickness lt is calculated by:
| (7) |
Attenuation coefficients µt (E) for the Al and Cu filters were calculated using NIST[40] mass-attenuation coefficients and measured physical densities of the metals. Impurities in the metal, such as iron zinc and silicon, were accounted for in the NIST mass-attenuation coefficients using certificates of analysis provided by the supplier. The thickness of each individual filter lt was measured with a micrometer. The BM spectrum model and linear attenuation coefficients were all calculated on 1 keV energy steps. The BM model returns the particle-fluence spectrum of the x-ray beam, incident on the detector array. As the CT detectors are energy-integrating, multiplying by E converts to energy fluence. The term Detect(E) represents a first-order correction for the quantum efficiency of the detector crystal of thickness ldet. BT(E) represents the attenuation of the spectrum by the known central-axis bowtie filter (BT) thickness lBT (γ=0). The equivalent spectrum thus represents the photon-counting spectrum just upstream of the BT filter. The use of the CT detector array for transmission measurements, versus use of an independent ionization chamber, forms a closed measurement-model loop to account for residual errors in our simple detector-response model and the actual signal-formation process, i.e. the equivalent spectrum fit to the measurements will absorb any residual modeling errors.
The equivalent spectrum is defined here as minimizing the sum of squared relative differences between the measured and modeled transmission values:
| (8) |
The equivalent spectrum parameters kVpeq and mmAleq were found by performing a 2-D exhaustive search over a grid of BM parameter values; kVp and mmAl. Grid spacing was set such that ΔkVp = 1 keV and ΔmmAl = 0.1 mm.
For detectors away from central-axis, i.e., γ ≠ 0, both the mean photon energy and the total incident energy fluence will be considerably modulated by the Brilliance’s bowtie filter. Accounting for the detector-dependent energy distribution of the x-ray beam is essential for the polyenergetic AM algorithm to generate artifact-free image reconstructions. Inadequate modeling of the varying x-ray energy distribution across the detector array will cause systematic artifacts relative to the imaging FOV center for AM reconstruction. From an engineering diagram of the bowtie filter provided by the manufacturer, the pathlength for each source-detector ray through the bowtie filter, lBT (γ), was calculated. The spectrum was further hardened by a 1/ cos γ correction for oblique filtration through an aluminum slab of thickness mmAleq from the equivalent Birch-Marshall spectrum model’s inherent filtration. In terms of the central-axis equivalent spectrum , the equivalent detector-dependent spectrum is given by:
| (9) |
.
As the AM algorithm’s forward model (2) does not explicitly incorporate detector modeling, the first-order detector model from (7) is applied to the equivalent detector-dependent spectrum before being provided to the AM algorithm as input data:
| (10) |
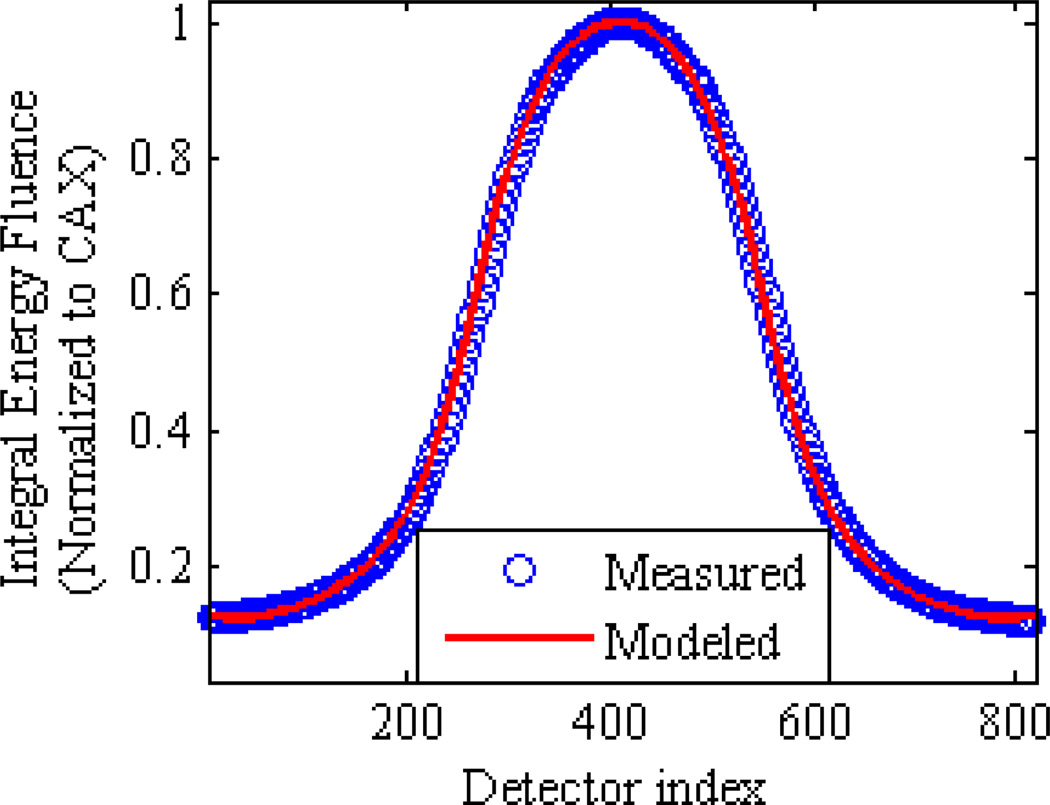
The off-axis hardening model (9) was validated by comparing the expected in-air energy-fluence profile to measured in-air energy-fluence profiles d(β,γ:c = 0)/d(β,γ=0:c=0).
The sensitivity of the AM algorithm to x-ray spectrum errors is assessed in the real-data case by reconstructing two test cases in which the equivalent x-ray spectrum is perturbed from the best-fit equivalent spectrum. In the first example an x-ray spectrum with a mean energy 2keV higher than the best-fit spectrum is used. In the second example the off-axis hardening due to the bowtie filter is omitted, and the best-fit spectrum measured on central axis is used for all source-detector rays.
2.4. Scatter estimation using a beam-stop method
While the 1-D anti-scatter grid (ASG) on the Brilliance CT scanner can be expected to effectively reject large angle scatter, a non-trivial component of the scatter signal is due to small angle coherent scattering[41], which will bypass the ASG foils and contaminate the detected signal. This residual scatter signal was experimentally measured in this work with a beam-stop technique similar to that of Johns and Yaffe[42]. The scattered signal intensity was estimated from four measurements (M1,…,M4) for the CAX source-detector ray (γ=0) at all three tube potentials for each cylindrical test phantom described in section 2.5,. As a first-order correction, the signal intensity from scattered radiation in the AM algorithm’s data model was assumed to be constant for all detectors γ and all gantry angles β.
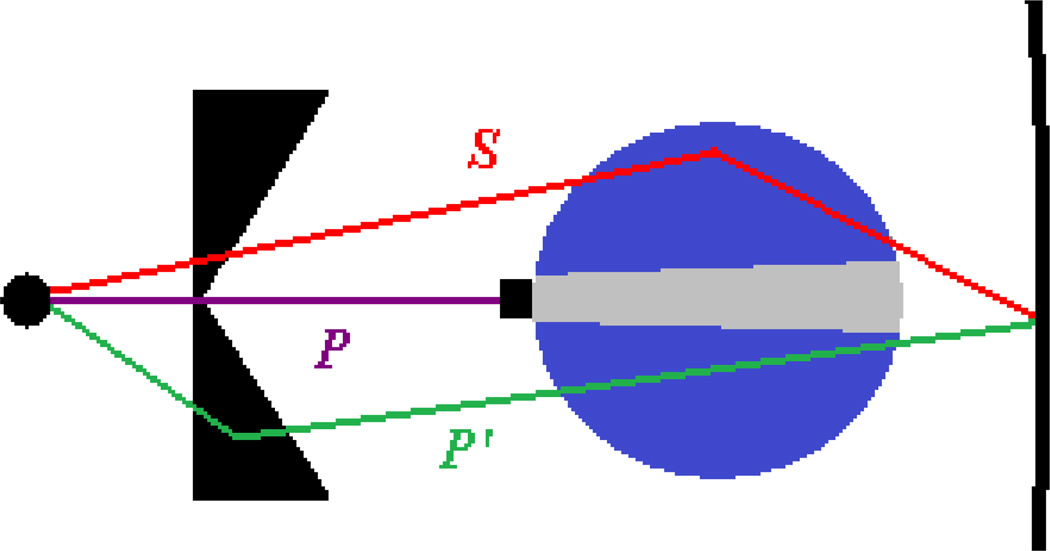
Using Endo’s[10] notation, the detected signal measured behind the scan subject M1 is composed of three components as illustrated in figure 2:
| (11) |
where P is the signal from primary radiation originating from the focal spot, P’ is the signal from off-focal radiation due to photon scattering upstream of the patient, e.g. in the BT filter, and S is the signal due to radiation scattered by the scan subject. A second measurement M2 was taken with a ¼” thick lead block having finite width w inserted on CAX, which effectively blocks the signal from primary radiation (P = 0):
| (12) |
As the off-focal signal P′ does not originate from the focal spot, it passes around the beam-stop and is still present in M2. Here and SB(w) represent the reduction in off-focal and scatter components due to shadowing of the finite lead block of width w. To correct for block shadowing, M2 (w) was measured for 3 block widths (w = 6, 10, and 15 mm) and the signal for a block of zero width, M2 (w=0) = P′ + S, was estimated as the intercept of a linear fit to the 3 blocker measurements. The effect of block shadowing and this corrective method are well illustrated in Endo et al[10]. The detected signal from primary radiation passing through the scan subject was then estimated as P = M1 – M2 (w=0).
Figure 2.
Diagram of the beam-stopper method for scatter estimation. Primary radiation P is absorbed by the beamstopper allowing the scattered radiation, S, to be estimated. Off-focal radiation P’ bypasses the beam-stopper and will mimic subject scatter if not accounted for. The shadowing of the beam-stopper, shown as the light gray area, is accounted for by measurements acquired with varying stopper widths and extrapolating to a zero width blocker..
The off-focal signal intensity is present in the absence of a scan subject, and is therefore considered as effective primary radiation. Neglecting to estimate and remove the off-focal component of signal intensity leads to an overestimation of the subject-scatter component. Estimation of the off-focal signal component was achieved by air measurements, i.e., with no scan subject present. Measurement of unblocked air signal will contain both primary and off-focal components:
| (13) |
The in-air off-focal signal component was estimated by in air measurement M4 that uses the lead beam-stopper to block primary intensity (Pair = 0):
| (14) |
The block shadowing was again removed by repeating M4 (w) for the three lead block widths and extrapolating to w=0 to give the in-air off-focal signal component .
Since the radiation reaching the detector with the 1-D ASG in place is largely small angle scatter with little energy loss[41], the off-focal component is assumed to travel the same pathlength through the scan subject as the primary component. The ratio of the primary signal with and without the scan subject (P / Pair) was used to estimate the off-focal signal component attenuated by the scan subject:
| (15) |
With the estimate of off-focal signal component passing through the scan subject, P’, the component of detected intensity due to scatter from the scan subject, S, was calculated from (11). Similar to the spectrum measurements, the beam-stop scatter measurements were performed in scout view mode with a fixed gantry angle and table translation. The lead beam-stoppers each have a length in z of 21 mm, allowing at least 100 detector readings centered behind the beam-stop to be averaged to reduce statistical variability.
2.5 Physical phantoms for assessment of the AM algorithm’s data model accuracy
A total of eight homogeneous cylindrical phantoms of water, polymethyl methacrylate (PMMA) and Teflon were used to assess the accuracy of the AM algorithm’s data model. The water cylinder (Victoreen CT performance phantom) consists of 20.3 cm diameter of water enclosed by a 6 mm thick acrylic shell. PMMA cylinders of four diameters (5.1 cm, 15.9 cm, 20.3 cm and 30.5 cm) and Teflon cylinders of three diameters (5.1 cm, 11.4 cm and 17.8 cm) were reconstructed to investigate the effect of object size. The largest PMMA and Teflon diameters transmit roughly 10−3 of the primary beam to approximate typical clinical patient scans. The cylinders were immobilized to hang off the end of the CT table so that the table was not in the FOV. All cylinders were scanned at tube potentials of 90, 120 and 140 kVp giving a total of 24 centered-cylinder datasets. To investigate the dependence of location within the FOV, the cylinders were scanned both when centered and when shifted approximately 9 cm from the center of rotation.
Weighted filtered back-projection[43] was performed for comparison to the penalized Alternating Minimization algorithm. The filter, H(f), is a modified ramp filter defined in frequency space as
| (16) |
where s is a constant scale factor that ensures the image intensities represent the correct units of linear attenuation, mm−1, and |f| is the ramp function. W(f) is a rectangular window function up to frequencies of 90% of Nyquist, which then rolls off with a raised cosine function to zero at Nyquist frequency[31]. For consistency, our in-house FBP algorithm was used for all comparisons to ensure that both AM and FBP reconstruction utilized the same system matrix h(y | x).
Four reconstructions of each CT dataset were performed: polyenergetic AM without a scatter estimate (AMSc-OFF), polyenergetic AM with a constant scatter estimate (AMSc-ON), FBP from BH-corrected data (FBPBH-ON) and FBP of BH-uncorrected data (FBPBH-OFF). FBP reconstruction with and without BH corrections applied to the data illustrates the effect of the vendor-supplied empirical BH correction. The reconstruction of AMSc-ON images allows investigation into the effect of incorporating a constant scatter estimate in the AM algorithm’s data model.
2.6. Assessment of systematic bias
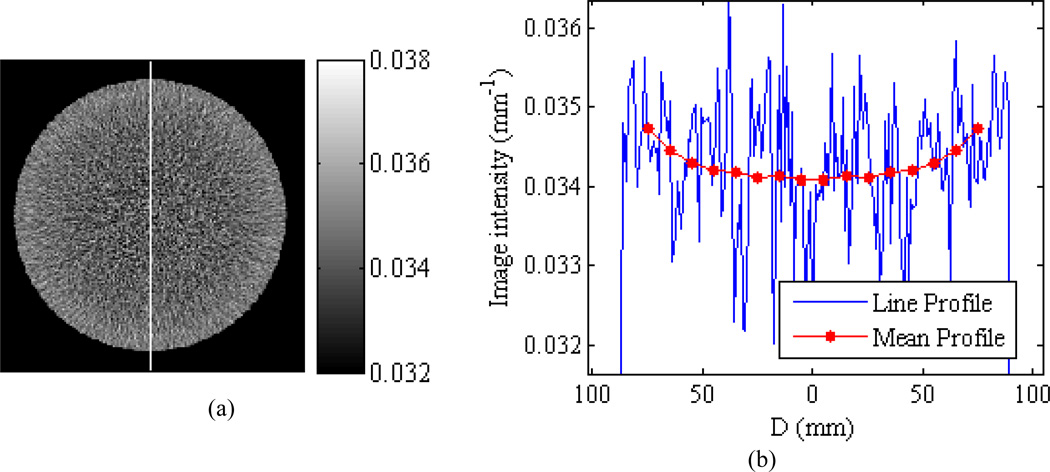
With the goal of assessing systematic bias in the reconstructed images, spatial averaging was employed to reduce the effect of random image noise. By exploiting the radial symmetry of the scanned cylinders, image pixels were binned according to their radial distance to the cylinder centroid D using bin widths of 0.5 cm for the smallest cylinders (5.1 cm diameter) and bin widths of 1.0 cm for all other cylinders. Only pixels greater than 4 mm from the cylinder-air interface were included. The mean image intensity in each radial bin (henceforth referred to as the ‘radial bin mean’) as a function of the radial bin’s median distance, D, to the cylinder centroid, µ̅(D), represents the mean profile and was used in the subsequent assessments of systematic bias. Figure 3 shows an example of the radial averaging method for the 17.8 cm Teflon cylinder reconstructed with FBPBH-ON which shows visible cupping.
Figure 3.
Illustration of the radial averaging method. (a) The cupping artifact can be visualized in FBPBHON reconstruction of the 17.8 cm Teflon cylinder scanned at 120 kVp with 220 mAs. (b) However, image noise makes it difficult to quantify the cupping artifact from a traditional line profile [location denoted by the vertical white line in (a)]. The mean profile, calculated by averaging pixels based on their radial distance to the cylinder centroid D, reveals the structure of the cupping artifact and allows assessment of the systematic bias.
As stated previously, the AM algorithm was employed with a single-basis object model using the material composition of the scan subject. AM accuracy was assessed by calculating the percent difference of all radial bin means from the expected c(x) = 1.0. Assessing AM accuracy in reference to an expected ground truth is performed to give confidence that the detector-dependent x-ray energy spectrum was properly modeled and to investigate the effect of scattered radiation on the quantitative reconstruction accuracy.
To assess the criterion that intensity be independent of location within the subject, the uniformity of image intensities within a homogeneous cylinder was calculated. The uniformity index (UI) metric is defined as
| (17) |
where µ̅central and µ̅peripheral refer to the radial bin means for the pixels that are closest and furthest from the cylinder centroid respectively. A positive UI indicates image cupping (center < periphery) while a negative UI indicates image capping (center > periphery). The UI was calculated for each reconstructed cylinder image to compare systematic intensity deviations within a cylinder for AM and FBP reconstructions.
3. Results
3.1. Equivalent x-ray spectrum estimation
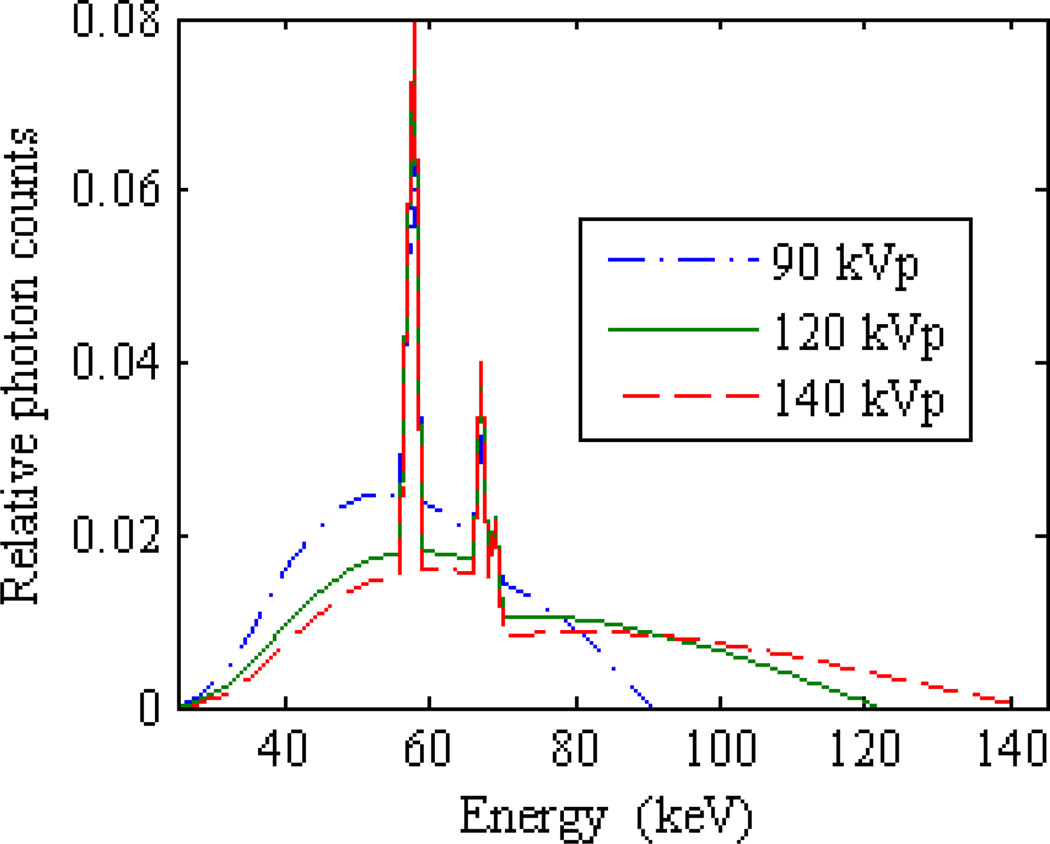
The CAX equivalent spectra derived from measured Al and Cu attenuation curves for the three investigated tube potentials are illustrated in figure 4. Table 1 summarizes equivalent BM spectrum model parameters that fit the measured attenuation data to within 1.34% root-mean-square error. It is seen that the equivalent kVp of the BM model is within 1 keV of the nominal accelerating potential, and the equivalent millimeters of inherent aluminum filtration span a range of 0.3 mm across the three cases. In support of the off-axis spectral hardening model, the computed in-air energy fluence profiles of all three potentials closely match the measured air profiles as illustrated in figure 5.
Figure 4.
Equivalent Birch-Marshall x-ray spectra for three nominal tube potentials investigated in this work. All three spectra were normalized to have unit area for this plot.
Table 1.
Equivalent Birch-Marshall spectrum parameters fit to attenuation measurements through Al and Cu filters on central axis (CAX). The root-mean-square and maximum errors between modeled and measured transmissions are reported as a percent of the measured values.
| Nominal kVp (keV) |
kVpeq (keV) |
mmAleq (mm) |
RMSE (%) |
Max residual error (%) |
|---|---|---|---|---|
| 90 | 90 | 12.5 | 1.34 | 3.81 |
| 120 | 121 | 12.3 | 1.07 | 1.54 |
| 140 | 141 | 12.6 | 1.20 | 2.03 |
Figure 5.
Example of excellent agreement between the measured and modeled in-air profiles for the 120 kVp nominal tube potential. Similar agreement was achieved for the 90 and 140 kVp tube potentials.
3.2. Measured scatter on central axis
Table 2 reports the measured scatter-to-primary ratios (SPRs) as a percentage of the primary intensity for the cylindrical phantoms investigated in this work. Only the largest PMMA and Teflon cylinders, with diameters of 30.5 cm and 17.8 cm respectively, have estimated SPRs greater than 1%. From the beam-stop measurements made in air, the off-focal radiation, P’, was estimated to constitute 1.7% to 2.2% of the total signal for 90 kVp to 140 kVp respectively, which is in agreement with the literature[42]. If not accounted for in the beam-stop measurements, the off-focal radiation leads to the SPR being overestimated by an additive 1.7% to 2.2% for all object sizes. For example, the smallest 5.1 cm PMMA disk at 120 kVp would have an estimated SPR of 2.25% if ignoring the off-focal radiation compared to 0.17% when accounting for the off-focal component.
Table 2.
Measured scatter-to-primary ratios (%) for the 8 cylinders investigated in this work. With 3 mm beam collimation and the 1D-ASG, only the largest Teflon and PMMA cylinders have SPR > 1%.
| Material | Water | PMMA | Teflon | |||||
|---|---|---|---|---|---|---|---|---|
| Diameter (cm) | 20.3 | 5.1 | 15.9 | 20.3 | 30.5 | 5.1 | 11.4 | 17.8 |
| 90 kVp | 0.20 | 0.13 | 0.44 | 0.68 | 2.91 | 0.09 | 0.49 | 1.36 |
| 120 kVp | 0.59 | 0.17 | 0.34 | 1.00 | 3.00 | 0.21 | 0.80 | 1.93 |
| 140 kVp | 0.39 | 0.18 | 0.48 | 0.63 | 3.63 | 0.27 | 0.59 | 2.72 |
3.3. Reconstructed image results – centered cylinders
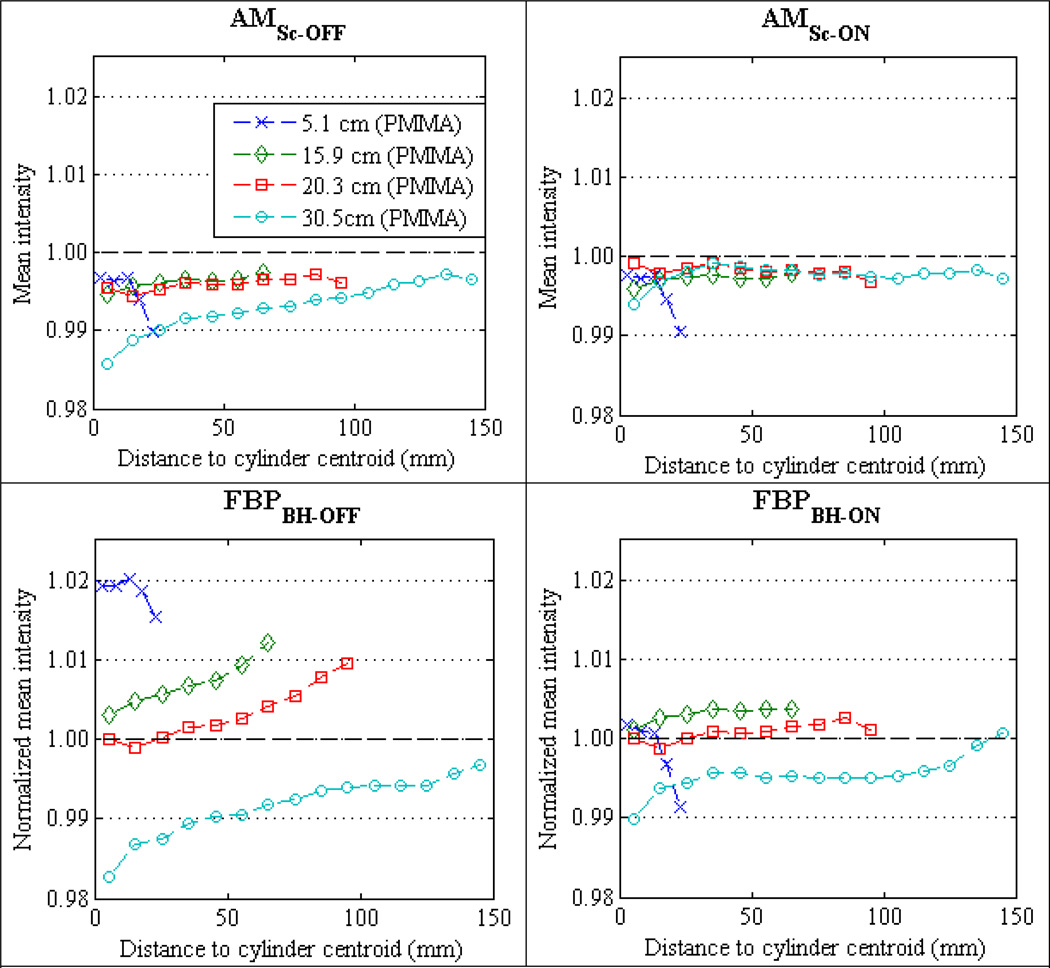
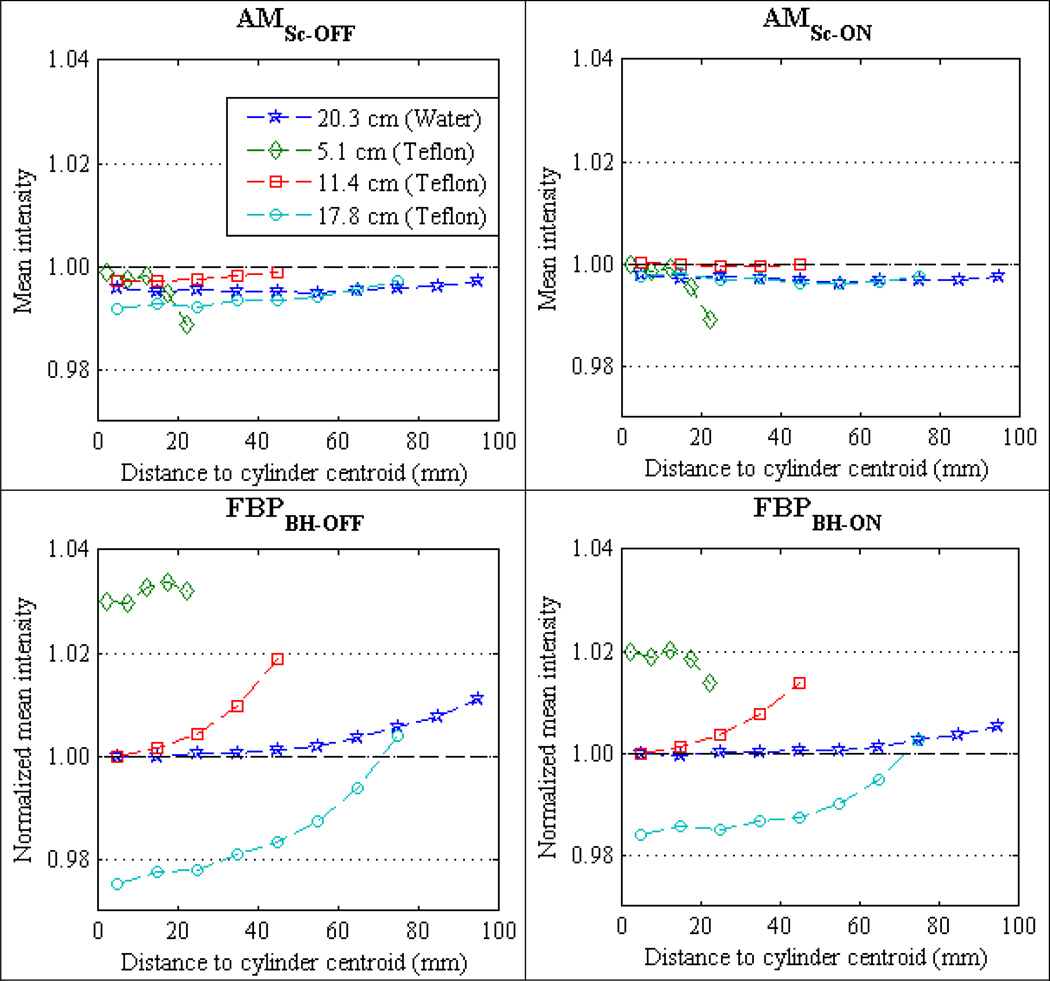
Recall that radial averaging (section 2.6) was employed to assess the systematic intensity variations across reconstructed images of the homogeneous cylindrical phantoms. Figure 6 compares the mean radial profiles for the four PMMA phantom cylinders reconstructed with FBP of data without BH correction [FBPBH-OFF], FBP of BH-corrected data [FBPBH-ON], polyenergetic AM with no scatter estimate [AMSc-OFF], and polyenergetic AM including a constant scatter estimate [AMSc-ON]. Figure 7 displays mean profiles of the same four reconstruction methods for the 20.3 cm water cylinder and the three Teflon cylinders. All data presented in this section are for the cylinders centered in the FOV; the off-centered reconstruction results are presented in section 3.5. All data in figures 6 and 7 were acquired at 120 kVp tube potential; the 90 kVp and 140 kVp results for the cylinders centered in the FOV exhibit identical trends.
Figure 6.
Mean radial profiles for centered PMMA cylinders scanned at 120 kVp. Results for 90 kVp and 140 kVp are similar. The AM mean profiles (top row) are absolute reconstructed intensities to display the error relative to expected ground truth intensity of 1.0. The FBP profiles (bottom row) have been normalized to the centermost radial bin mean of the 20.3 cm cylinder to display the intensity variation for objects of varying size and for varying locations within the same phantom.
Figure 7.
Mean radial profiles for centered Water and Teflon cylinders scanned at 120 kVp. Results for 90 kVp and 140 kVp are similar. The AM mean profiles (top row) are absolute reconstructed intensities to display the error relative to expected ground truth intensity of 1.0. The FBP profiles (bottom row) have been normalized to the centermost radial bin mean (11.4 cm for Teflon and 20.3 cm for water) to display the intensity variation for objects of varying size and for varying locations within the same phantom.
The polyenergetic AM mean profiles in figures 6 and 7 are absolute values of c(x) using the single-basis object model (equation (1)) matched to the scan subject material. As the expected AM truth intensity is 1.0, absolute accuracy and relative % variations are easily visualized. The mean FBP profiles in figures 6 and 7 are normalized independently for each material type. All PMMA mean profiles are normalized to the centermost bin mean of the 20.3 cm cylinder, all Teflon mean profiles to the centermost bin mean of the 11.4 cm cylinder, and the 20.3 cm water cylinder is normalized to the centermost bin mean. Normalizing the mean FBP profiles for each material in figure 5 allows relative % variations due to object-size for a given material to be more easily visualized.
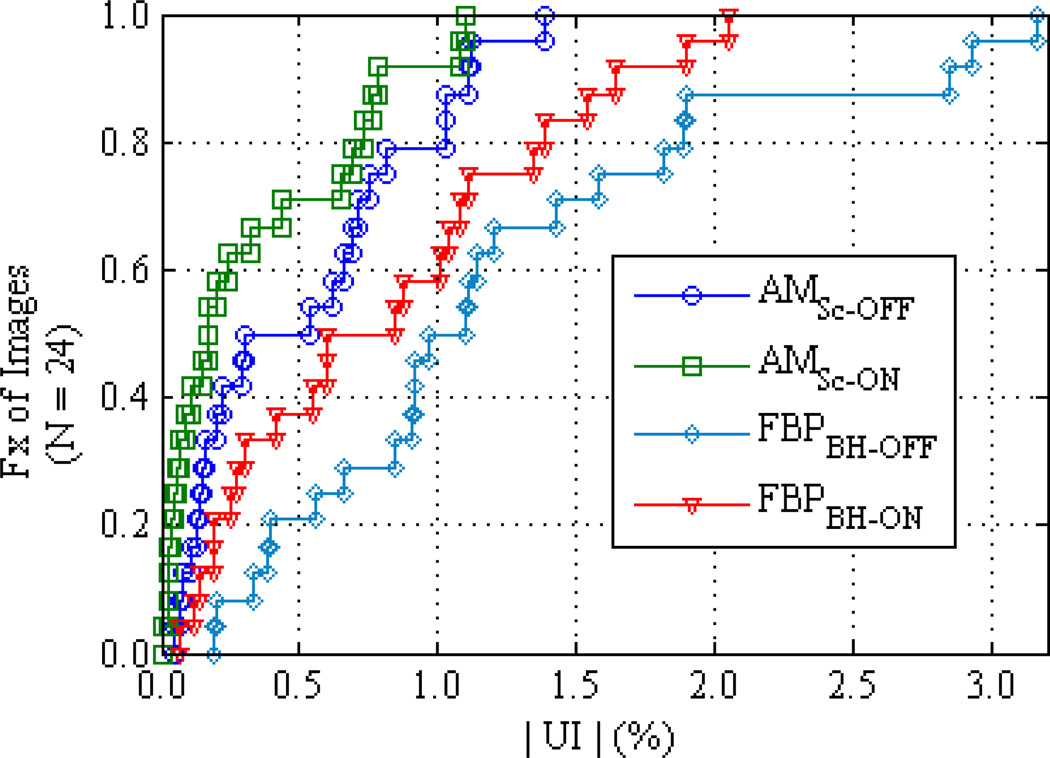
The shape of the cupping artifact is easily discerned in the FBP mean profiles of figures 6 and 7. The uniformity index (UI) was calculated to summarize the variation of image intensity within each homogeneous cylinder. Grouping all 24 image cases, i.e., all materials, all cylinder diameters and all tube potentials, figure 8 plots the cumulative distribution function of the UI values for each of the four reconstruction methods. Although the vendor’s pre-reconstruction BH-correction improves FBP uniformity relative to uncorrected data, the polyenergetic AM algorithm employed here performs better. The advantage of the polyenergetic AM algorithm is most substantial for the largest cylinders, since the x-ray spectrum has experienced more hardening. Taking the largest Teflon cylinder (17.8 cm) at 120 kVp for example, the UI for AMSc-OFF is 0.5% compared to 1.9% for FBPBH-ON. It should be noted that the largest UI values for the AM curves in figures 5 and 6 are due to error trends observed in both AM and FBP images, discussed in more detail later in this section, while the largest FBP UI values are from cupping in the largest Teflon cylinders.
Figure 8.
Cumulative distribution functions of the Uniformity Index for all reconstructed cylinders (8 cylinders at 3 tube potentials) sorted by reconstruction algorithm. Comparing the FBP reconstruction with and without BH corrections applied to the data (triangles and diamonds respectively) shows the improvement in image flatness by the current clinically implemented BH correction. It is seen that the implicit BH correction of the polyenergetic AM algorithm (circles) outperforms the FBP algorithm and that a scatter correction (squares) further enhances freedom from systematic cupping artifacts.
The mean profiles of FBPBH-OFF and FBPBH-ON in figure 6, not only show that the vendor-supplied BH correction reduces the systematic variations within a homogeneous object, but also reduces variations between objects of the same material and differing size. Comparing the overall mean intensity within each reconstructed cylinder (i.e., the average of all radial bin means), FBPBH-ON reconstructs all four PMMA cylinders (figure 6) to within 0.75% mean intensity of each other. However, the mean intensity of the three Teflon cylinders using FBPBH-ON (figure 7) varies up to 2.5%. In comparison, polyenergetic AMSc-OFF reconstructs both the PMMA and Teflon cylinders with overall mean intensities that vary less than 0.5% across all cylinder diameters.
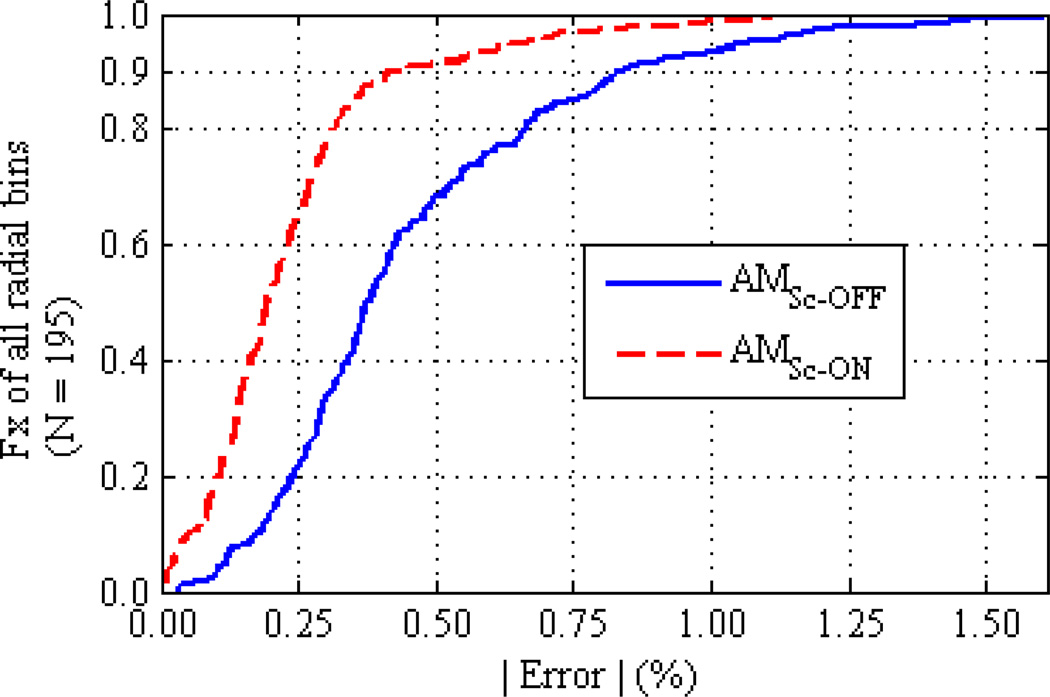
The percent error of each polyenergetic AM radial bin mean is calculated in relation to the expected truth intensity of 1.0 to assess the commissioning of the AM algorithm’s data model on the Philips Brilliance CT scanner. The overall accuracy of the polyenergetic AM reconstructions is summarized in figure 9, which plots the cumulative distribution of radial bin mean errors for all centered cylinder experiments. The radial bin means for all materials, object sizes, and tube potentials are grouped together. AM reconstruction using a constant scatter estimate from the beam-stop measurements (AMSc-ON) is shown to bring most (90%) of the radial bins to within 0.45% of truth compared to AMSc-OFF with 90% of radial bins within 0.84% of truth. The reduction in bias afforded by scatter correction is greatest for larger disks where SPR was greater than 1%. This effect is easily visualized in the AMSc-OFF and AMSc-ON mean profiles of the largest PMMA and Teflon cylinders in figures 6 and 7, respectively.
Figure 9.
Cumulative distribution functions comparing the % error from expected truth of all polyenergetic AM radial bin means reconstructed with and without a constant scatter correction. Radial bin means from all cylinders and all tube potentials are grouped together into each CDF. It is seen that AM reconstruction with a constant scatter estimate from the central-axis beam-stopper measurements brings 90% of all radial bin means to within 0.45% of truth. Comparatively, AM without a constant scatter estimate reconstructs 90% of all radial bin means to within 0.84% of truth.
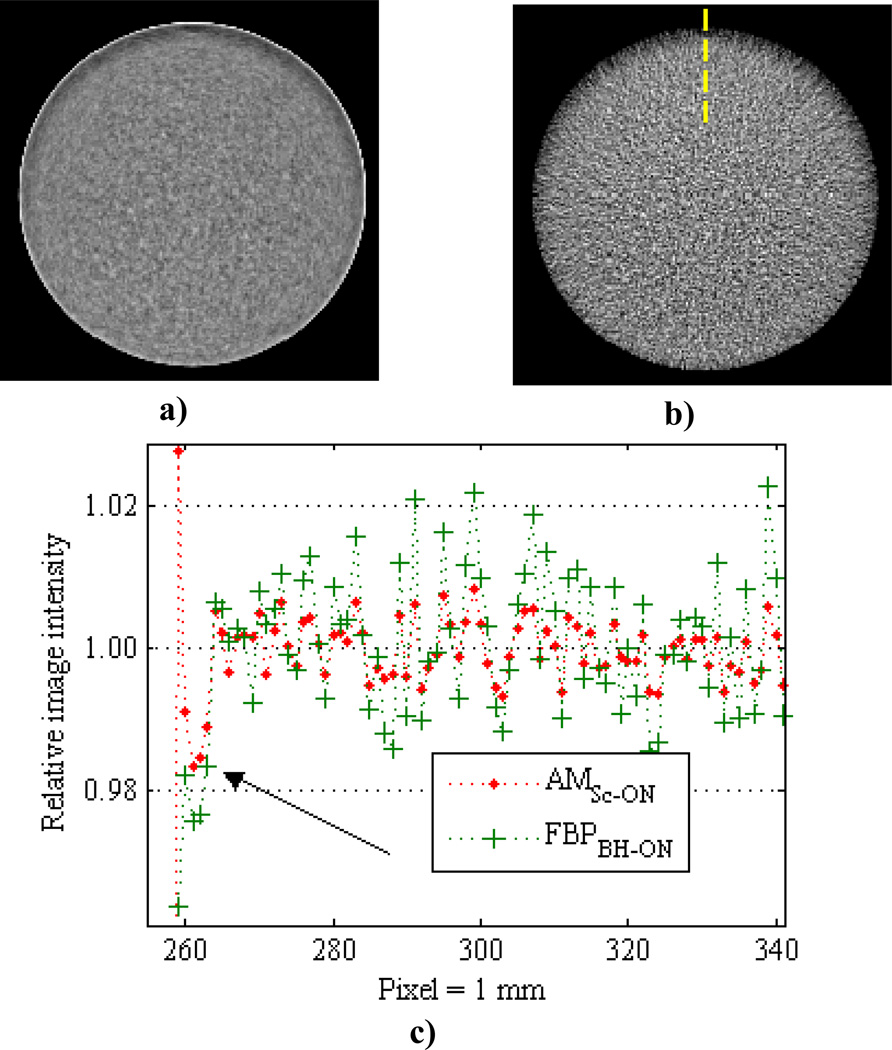
The largest errors seen in the CDF tails of figure 9 are a result of the same error trends mentioned previously that give the largest UI values for AM reconstruction. The first trend is an underestimation of intensity in the periphery of the 5.1 cm diameter Teflon and PMMA cylinders observed at all tube potentials. The mean profiles in figures 6 and 7 show that the magnitude of this “peripheral roll-off” for the 5.1 cm cylinders is approximately 1% and is present in both AM and FBP reconstructions. Figure 10 displays reconstructed images of the 5.1 cm PMMA cylinder at 120 kVp using the AM algorithm (10a) and the Philips clinical algorithm (10b) that illustrate the peripheral roll-off error trend. These data were acquired with the Philips “axial pelvis” protocol that was used throughout this work. However, as shown in figure 10c, the peripheral roll-off artifact is absent when utilizing the Philips “axial brain” protocol for data acquisition and reconstruction of the same phantom cylinder. The “axial brain” protocol acquires more projections per rotation and uses a different reconstruction kernel than the “axial pelvis” protocol.
Figure 10.
120 kVp images of the 5.1 cm PMMA disk scanned in air reconstructed with (a) AMSc-ON and (b) the Philips axial pelvis protocol illustrate the presence of the peripheral roll-off error trend observed in the mean profiles of the smallest 5.1 cm diameter PMMA and Teflon cylinders. A narrow window of ± 2% around the centermost radial bin mean is used for each image to display the 1% roll-off trend. Utilizing the (c) Philips axial brain protocol reconstructs and image that does not exhibit the roll-off artifact. Note the AM image pixels (a) are 1.0 mm on a side, and the Philips pixels (b & c) are 0.488 mm on a side.
The second error trend is an apparent underestimation for the centermost radial bins of the largest 30.5 cm diameter PMMA cylinder, again observed in images at all three tube potentials. The 120 kVp mean profiles of the 30.5 cm PMMA cylinder in figure 6 exhibit a relatively sharp drop in mean intensity of approximately 0.5% over the centermost two radial bins for both AM and FBP reconstructions. As both error trends afflict FBP and AM images reconstructed from data acquired with the Philips “axial pelvis” protocol, these are not thought to be inherent limitations of the AM algorithm.
3.4 Sensitivity to spectral mismatch
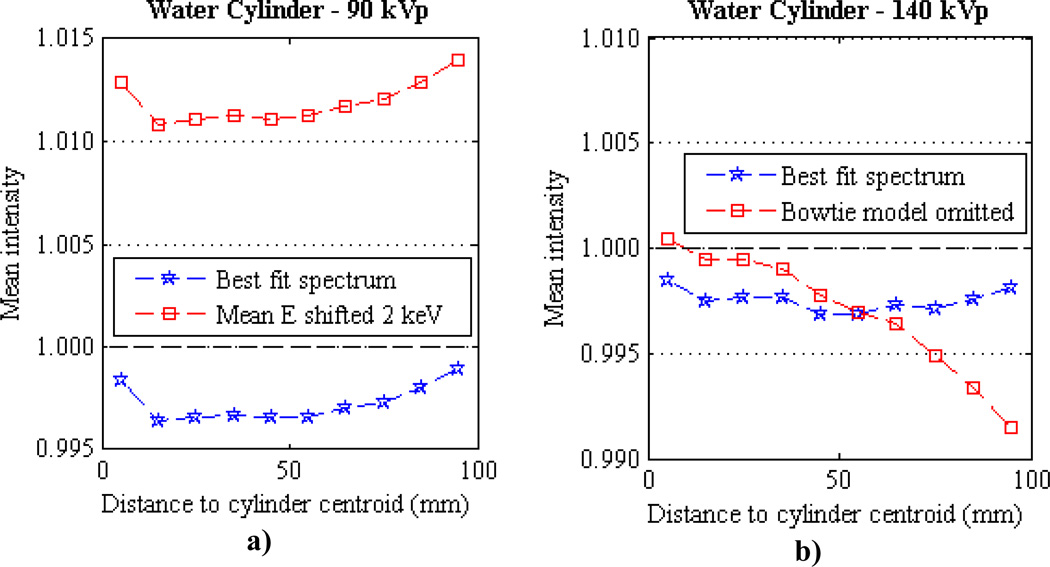
The effect of spectral mismatch on the reconstruction accuracy of the polyenergetic AM algorithm is illustrated with two examples in which acquired sinogram data of the 20.3 cm water cylinder is reconstructed using a spectrum with a known perturbation from the best fit spectrum. In the first example, an over-hardened CAX equivalent spectrum for the 90 kVp beam is generated using Birch-Marshall model parameters of 93 kVp and 14.5 mmAl. The over-hardened BM spectrum has a mean energy 2 keV higher than the best fit BM parameters reported in Table 1 of 90 kVp and 12.5 mmAl. The bowtie filter model for off-axis detectors described in equation (18) is still applied to the over-hardened 90 kVp spectrum and the constant scatter correction described in sections 2.6 and 3.2 are used in the reconstruction. The mean radial profiles of the water cylinder reconstructed with this over-hardened 90 kVp spectrum and the best fit spectrum are shown in figure 11a. Here it is seen that the shift in spectrum mean energy leads to a systematic increase in reconstructed image intensity. This example shows us that a spectrum mean energy shift of 2 keV leads to a shift of approximately 1.5% for the 90 kVp data.
Figure 11.
Mean radial profiles for centered water cylinders reconstructed using spectra with intentional errors. (a) Water cylinder reconstructed with a 90 kVp spectrum with mean energy shifted +1.9 keV from the best fit spectrum. (b) Water cylinder reconstructed with a 140 kVp spectrum in which the bowtie filter model was not included, i.e., the central axis best fit spectrum was assumed for all off axis detectors. Each plot also contains the mean profile reconstructed using the best fit Birch-Marshall spectrum for comparison.
In the second spectral error example, the best fit BM parameters for the 140 kVp beam are used from Table 1, but the bowtie filter model of equation (19) is not applied, i.e., the central axis spectrum is assumed for all off-axis detectors. Since the data was acquired with a bowtie filter in place, the spectrum with the bowtie model omitted will be under-hardened. The mean radial profiles of the water cylinder reconstructed with the bowtie-omitted and the bowtie-included 140 kVp spectra are shown in figure 11b. Here it is seen that the mean intensity decreases away from the center of the cylinder since the spectrum is increasingly under-hardened with increasing distance from the field-of-view center. These examples highlight the sensitivity of the polyenergetic AM reconstruction to spectral mismatch and support the efforts described here to estimate the appropriate distribution of photon energies in the spectrum.
3.5. Off-centered cylinder results
Shifting the cylinders away from the imaging axis center allows for assessment of the quantitative CT consistency criterion that image intensities for a given material be independent of subject location in the FOV. Figure 12 displays 140 kVp AMSc-ON and FBPBH-ON reconstructions of the 15.9 cm PMMA cylinder shifted 9 cm away from the FOV center. It is seen that the intensities on the proximal edge, i.e., nearest to the FOV center, are systematically underestimated. This error trend was observed in the off-centered cylinders for all materials, object sizes, tube potentials, and both AM and FBP reconstruction algorithms. The magnitude of the proximal edge depression varied between approximately 0.5% and 1.5% for the varying cylinder sizes. Excluding the peripheral radial bin, the off-centered results of image intensity consistency and AM absolute accuracy are nearly identical to the centered cylinder results presented above. Including a constant scatter estimate in the polyenergetic AM reconstruction of the off-centered cases decreased the systematic error in the same manner as seen for the centered cases shown in figure 9. However, the magnitude of the proximal edge depression was unaffected by use of a constant scatter estimate.
Figure 12.
140 kVp images of the 15.9 cm PMMA cylinder shifted ~ 9 cm down in the FOV reconstructed with AMSc-ON and (b) FBPBH-ON illustrate the proximal edge depression. Images are displayed with a narrow window of ± 3% around the centermost radial bin mean. (c) Vertical line profiles through the images [location shown by dashed line in (b)] normalized to the centermost radial bin mean. The proximal edge depression is observed in all off-centered cylinder reconstructions, i.e. all algorithms, all materials, all object sizes, and all tube potentials.
4. Discussion
Reported here is a framework for commissioning the polyenergetic AM algorithm’s data model in support of quantitative CT imaging applications. Spectral characterization is one of the challenges to performing model-based statistical reconstruction on commercial CT scanners[27]. Spectral mismatch directly leads to errors in the quantitative accuracy of reconstructed image intensities as shown here in figure 11, Liangjun Xie’s Ph.D. thesis[44] on the Alternating Minimization algorithm, and Elbakri et al.’s[22] study on polyenergetic statistical reconstruction. The methods of characterizing and evaluating the polyenergetic data model of the AM algorithm presented here can be applied to other model-based SIR algorithms as well.
The presented accuracy of reconstructed AM intensities to within 0.5% for a range of materials, cylinder diameters and locations within the FOV gives us confidence in the spectrum and scatter estimates required in the data model, supporting future Alternating Minimization research projects utilizing data acquired on commercial energy-integrating CT scanners. Initial results assessing the physically realizable accuracy of our target radiotherapy application, DECT photon cross-section estimation, using simple phantoms with heterogeneities of know composition scanned on the Brilliance fan-beam scanner are encouraging and are currently in preparation for journal submission.
Incorporating an estimate of scatter in the polyenergetic AM data model further improved the relative signal uniformity and was found necessary to bring mean AM intensities to within 0.5% for the largest cylinders. Even for a 3rd generation geometry CT scanner with a highly collimated beam (3.0 mm width in the z-direction) and a 1-D anti-scatter grid, scatter signals of greater than 1% were measured and were sufficiently large to compromise quantitative accuracy. For our target quantitative application of dual-energy CT cross-section estimation, the loss of quantitative accuracy associated with neglecting scatter corrections would result in cross-section estimation errors exceeding 3%[6]. Increased cone angle, i.e., longitudinal beam coverage, of multi-detector[45] and cone-beam geometries[46] allow greater amounts of scatter to be geometrically accepted in the detector, making scatter correction for quantitative CT applications increasingly important in these scenarios.
Excluding the radial bin furthest from the cylinder centroid, the absolute AM accuracy and relative consistency results of the off-centered cases is nearly identical to those of the centered cases. However, all off-centered cylinder reconstructions were seen to suffer from a systematic underestimation on the proximal edge on the order of 0.5% to 1.5% (figure 12). When shifting the cylinder away from the FOV center, the scatter can no longer be assumed to be symmetric across the detector array or constant for each gantry angle. We hypothesize that this proximal edge depression can be alleviated by incorporating detector and gantry angle dependent scatter estimates in image reconstruction. Future work is planned to assess this hypothesis by estimating detector and gantry angle dependent scatter profiles using an in-house x-ray CT Monte Carlo code[47] modified for the geometry of our 3rd generation commercial CT scanner.
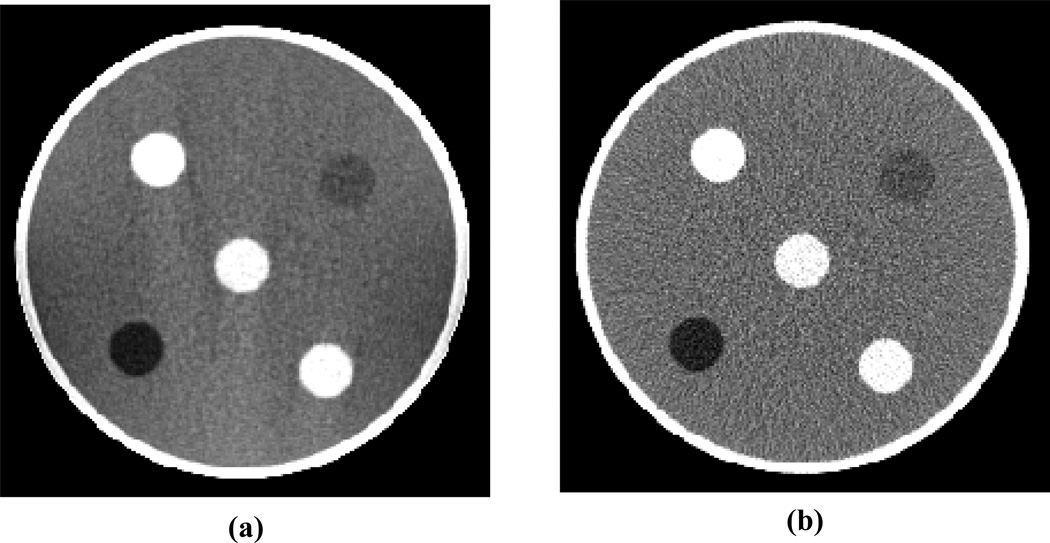
As previously noted in section 3.3 both AM and FBP reconstruction were seen to suffer from two other error trends. The largest 30.5 cm PMMA cylinder shows an apparent depression of central mean values of about 0.5%. Also, both of the smallest 5.1 cm PMMA and Teflon cylinders show a roll-off of peripheral mean intensities when scanned in-air. This roll-off artifact was not observed when utilizing the vendor’s Axial Brain protocol for data acquisition and reconstruction (figure 10). Figure 13 displays AM and FBP reconstructed images of the 20.3 cm water cylinder with 2.5 cm diameter rods of various compositions including Teflon, PMMA and polystyrene. The roll-off artifact is also not observed for the 2.5 cm diameter objects inside of the surrounding water bath. As both polyenergetic AM and FBP reconstruction exhibits the same error trends, and cases where the errors are absent, they are not thought to arise from inherent AM algorithm limitations. While these error trends are yet to be fully explained, the results presented in figure 10 point to the data acquisition protocol and the Philips reconstruction kernel as subjects of future investigation.
Figure 13.
120 kVp images of the 20.3 cm water cylinder with 2.5 cm plastic inserts of various compositions including PMMA, Teflon and polystyrene reconstructed with (a) AMSc-ON using water as a basis substance and (b) FBPBH-ON. Images are displayed with a window of ± 10% of the mean water intensity. Streaks are visible in the AM image; a result of the mis-match between the algorithm’s single-material water basis and the actual rod composition.
Also of note is the presence of an edge-overshoot artifact at the air-phantom interface in the AM images, visible in figures 10a and 13a. The literature[48, 49] has shown these artifacts are in fact inherent to likelihood estimation methods and arise from sampling mismatches between the forward projection of a discrete object model and the measured projection data of a continuous physical object. Zbijewski[49] shows that statistical reconstruction on a finer voxel grid effectively alleviates the edge-overshoot artifact as the inconsistency between discrete forward projections and measured data is reduced, but at the expense of longer computing times.
In comparison to FBP reconstruction using the vendor’s pre-reconstruction beam-hardening correction, the polyenergetic AM algorithm better meets the consistency criteria for quantitative CT applications. The matched single-basis AM images show improved freedom from systematic cupping artifacts as evidenced by comparing uniformity within the homogeneous cylinders. For the criterion of object-size independence, AM was found to reconstruct both PMMA and Teflon cylinders of various diameters to within 0.5% overall mean intensity, while FBP showed variation of up to 3% for the Teflon cylinders.
The use of a single-basis object model matched to the cylinder material was utilized in this work to provide a ground truth for quantitatively assessing the accuracy of reconstructed AM image intensities. However, it must be noted that reconstructed AM intensities derived from the single-basis object model, equation (1), will have a different interpretation when the subject material is not matched to the basis-model material. In the case of subject-to-basis material mismatches, we expect that AM reconstructed image intensities will be proportional to the spectrum-weighted ratio of subject-to-basis material linear attenuation coefficients. This is similar to the interpretation of FBP intensities as attenuation coefficients at the spectrally-averaged effective energy.
The multiple component phantom reconstructed with a single-material (water) object model shown in figure 13a, an example of a subject-to-basis material mismatch, exhibits streaking on the order of 1.0% to 1.5%. Streaking is a characteristic beam-hardening artifact, manifested here since the energy-dependence of the assumed single-object basis material in the AM algorithm does not match that of the actual materials in the scan subject. This is another challenge facing model-based SIR algorithms as outlined in Beister et al.’s 2012 review article[27]; to incorporate material composition information to accurately model the energy- and material-dependent nature of photon attenuation. Dual-energy CT, our target quantitative CT application[50], can be used to estimate material composition. Alternatively for single-energy CT scanning, images can be segmented based on a priori assumptions of material composition prior to SIR reconstruction. Another promising approach proposed in Elbakri et al.’s 2003 paper is to utilize a constrained two-basis object model to perform composition estimation without the need for image segmentation. While not the focus of the current manuscript, incorporating material composition is certainly an important challenge to model-based SIR algorithms. Future projects incorporating multi-component basis models are planned that utilize the methods of spectral estimation and data model assessment presented here.
5. Conclusions
A framework is presented for commissioning a polyenergetic model-based SIR algorithm, Alternating Minimization, for reconstructing data acquired on a commercial CT scanner. Measurement-based methods for estimating scatter, the equivalent x-ray spectrum, in-air calibration profiles, and modeling off-axis spectral hardening effects from the bowtie filter are described. A method to quantitatively assess the accuracy of the commissioned data model is presented in which an object-model matched to the material of the scan subject. The results from reconstructing sinogram data of homogeneous cylinders of various compositions, densities, and sizes at three tube potentials on a commercial fan-beam CT scanner illustrate that the methodological framework is capable of supporting polyenergetic AM reconstruction to within 0.5% of the expected ground truth. Meticulous attention to details such as contaminant elements in the x-ray transmission filters and test phantom cylinders and the presence of off-focal radiation in the x-ray spectra and scatter measurements is necessary to achieve this target accuracy. It is demonstrated that even in low scatter environments, i.e., narrow beam collimation and the presence of a 1-D anti-scatter grid, a scatter correction is necessary to reconstruct mean image intensities with an accuracy of 0.5% or better. To further improve the accuracy and applicability of polyenergetic AM reconstruction to more complex geometries, current and future research projects are focused on Monte Carlo simulation to improve scatter correction accuracy, incorporation of a multi-component object-model, and assessing the practical accuracy of dual-energy CT cross-section estimation for our target radiotherapy problem of improving low energy brachytherapy dose calculation.
Acknowledgements
This work was supported in part from a grant (R01 CA 75371, J. Williamson, Principal Investigator) awarded by the National Institutes of Health and a grant funded by Varian Medical Systems.
Footnotes
Publisher's Disclaimer: This is a PDF file of an unedited manuscript that has been accepted for publication. As a service to our customers we are providing this early version of the manuscript. The manuscript will undergo copyediting, typesetting, and review of the resulting proof before it is published in its final citable form. Please note that during the production process errors may be discovered which could affect the content, and all legal disclaimers that apply to the journal pertain.
References
- 1.Cann CE. Quantitative CT for Determination of Bone Mineral Density: A Review. Radiology. 1988;166:509–522. doi: 10.1148/radiology.166.2.3275985. [DOI] [PubMed] [Google Scholar]
- 2.Boden SD, Goodenough DJ, Stockham CD, Jacobs E, Dina T, Allman RM. Precise measurement of vertebral bone density using computed tomography without the use of an external reference phantom. J Digit Imaging. 1989;2:31–38. doi: 10.1007/BF03168013. [DOI] [PubMed] [Google Scholar]
- 3.Konig M. Brain perfusion CT in acute stroke: current status. Eur J Radiol. 2003;45(Suppl 1):S11–S22. doi: 10.1016/s0720-048x(02)00359-5. [DOI] [PubMed] [Google Scholar]
- 4.Valdiviezo C, Ambrose M, Mehra V, Lardo AC, Lima JA, George RT. Quantitative and qualitative analysis and interpretation of CT perfusion imaging. J Nucl Cardiol. 2010;17:1091–1100. doi: 10.1007/s12350-010-9291-6. [DOI] [PubMed] [Google Scholar]
- 5.Bazalova M, Carrier JF, Beaulieu L, Verhaegen F. Dual-energy CT-based material extraction for tissue segmentation in Monte Carlo dose calculations. Phys Med Biol. 2008;53:2439–2456. doi: 10.1088/0031-9155/53/9/015. [DOI] [PubMed] [Google Scholar]
- 6.Williamson JF, Li S, Devic S, Whiting BR, Lerma FA. On two-parameter models of photon cross sections: application to dual-energy CT imaging. Med Phys. 2006;33:4115–4129. doi: 10.1118/1.2349688. [DOI] [PubMed] [Google Scholar]
- 7.Wang G, Yu H, De Man B. An outlook on x-ray CT research and development. Med Phys. 2008;35:1051–1064. doi: 10.1118/1.2836950. [DOI] [PubMed] [Google Scholar]
- 8.Brooks RA, Di Chiro G. Beam hardening in x-ray reconstructive tomography. Phys Med Biol. 1976;21:390–398. doi: 10.1088/0031-9155/21/3/004. [DOI] [PubMed] [Google Scholar]
- 9.Joseph PM, Ruth C. A method for simultaneous correction of spectrum hardening artifacts in CT images containing both bone and iodine. Med Phys. 1997;24:1629–1634. doi: 10.1118/1.597970. [DOI] [PubMed] [Google Scholar]
- 10.Endo M, Mori S, Tsunoo T, Miyazaki H. Magnitude and effects of x-ray scatter in a 256-slice CT scanner. Med Phys. 2006;33:3359–3368. doi: 10.1118/1.2239366. [DOI] [PubMed] [Google Scholar]
- 11.Joseph PM, Spital RD. The effects of scatter in x-ray computed tomography. Med Phys. 1982;9:464–472. doi: 10.1118/1.595111. [DOI] [PubMed] [Google Scholar]
- 12.Glover GH. Compton scatter effects in CT reconstructions. Med Phys. 1982;9:860–867. doi: 10.1118/1.595197. [DOI] [PubMed] [Google Scholar]
- 13.Rivard MJ, Coursey BM, DeWerd LA, Hanson WF, Huq MS, Ibbott GS, et al. Update of AAPM Task Group No. 43 Report: A revised AAPM protocol for brachytherapy dose calculations. Med Phys. 2004;31:633–674. doi: 10.1118/1.1646040. [DOI] [PubMed] [Google Scholar]
- 14.Afsharpour H, Pignol JP, Keller B, Carrier JF, Reniers B, Verhaegen F, et al. Influence of breast composition and interseed attenuation in dose calculations for post-implant assessment of permanent breast 103Pd seed implant. Phys Med Biol. 2010;55:4547–4561. doi: 10.1088/0031-9155/55/16/S09. [DOI] [PubMed] [Google Scholar]
- 15.Carrier JF, D'Amours M, Verhaegen F, Reniers B, Martin AG, Vigneault E, et al. Postimplant dosimetry using a Monte Carlo dose calculation engine: a new clinical standard. Int J Radiat Oncol Biol Phys. 2007;68:1190–1198. doi: 10.1016/j.ijrobp.2007.02.036. [DOI] [PubMed] [Google Scholar]
- 16.Chibani O, Williamson JF, Todor DA. Dosimetric effects of seed anisotropy and interseed attenuation for [sup 103]Pd and [sup 125]I prostate implants. Med Phys. 2005;32:2557–2566. doi: 10.1118/1.1897466. [DOI] [PubMed] [Google Scholar]
- 17.Landry G, Reniers B, Murrer L, Lutgens L, Gurp EB, Pignol JP, et al. Sensitivity of low energy brachytherapy Monte Carlo dose calculations to uncertainties in human tissue composition. Med Phys. 2010;37:5188–5198. doi: 10.1118/1.3477161. [DOI] [PubMed] [Google Scholar]
- 18.Rivard MJ, Venselaar JL, Beaulieu L. The evolution of brachytherapy treatment planning. Med Phys. 2009;36:2136–2153. doi: 10.1118/1.3125136. [DOI] [PubMed] [Google Scholar]
- 19.Thomadsen BR, Williamson JF, Rivard MJ, Meigooni AS. Anniversary paper: past and current issues, and trends in brachytherapy physics. Med Phys. 2008;35:4708–4723. doi: 10.1118/1.2981826. [DOI] [PubMed] [Google Scholar]
- 20.Xu Q, Yu H, Bennett J, He P, Zainon R, Doesburg R, et al. Image reconstruction for hybrid true-color micro-CT. IEEE Trans Biomed Eng. 2012;59:1711–1719. doi: 10.1109/TBME.2012.2192119. [DOI] [PMC free article] [PubMed] [Google Scholar]
- 21.Elbakri IA, Fessler JA. Statistical image reconstruction for polyenergetic X-ray computed tomography. IEEE Trans Med Imaging. 2002;21:89–99. doi: 10.1109/42.993128. [DOI] [PubMed] [Google Scholar]
- 22.Elbakri IA, Fessler JA. Segmentation-free statistical image reconstruction for polyenergetic x-ray computed tomography with experimental validation. Phys Med Bio. 2003;48:2453–2477. doi: 10.1088/0031-9155/48/15/314. [DOI] [PubMed] [Google Scholar]
- 23.O'Sullivan JA, Benac J. Alternating minimization algorithms for transmission tomography. IEEE Trans Med Imaging. 2007;26:283–297. doi: 10.1109/TMI.2006.886806. [DOI] [PubMed] [Google Scholar]
- 24.Yan CH, Whalen RT, Beaupre GS, Yen SY, Napel S. Reconstruction algorithm for polychromatic CT imaging: application to beam hardening correction. IEEE Trans Med Imaging. 2000;19:1–11. doi: 10.1109/42.832955. [DOI] [PubMed] [Google Scholar]
- 25.De Man B, Nuyts J, Dupont P, Marchal G, Suetens P. An iterative maximum-likelihood polychromatic algorithm for CT. IEEE Trans Med Imaging. 2001;20:999–1008. doi: 10.1109/42.959297. [DOI] [PubMed] [Google Scholar]
- 26.Chueh HS, Tsai WK, Chang CC, Chang SM, Su KH, Chen JC. Development of novel statistical reconstruction algorithms for poly-energetic X-ray computed tomography. Comput Methods Programs Biomed. 2008;92:289–293. doi: 10.1016/j.cmpb.2008.04.002. [DOI] [PubMed] [Google Scholar]
- 27.Beister M, Kolditz D, Kalender WA. Iterative reconstruction methods in X-ray CT. Phys Med. 2012;28:94–108. doi: 10.1016/j.ejmp.2012.01.003. [DOI] [PubMed] [Google Scholar]
- 28.Csiszar I. Why least squares and maximum entropy? An axiomatic approach to inference for linear inverse problems. Annals of Statistics. 1991;19:2032–2066. [Google Scholar]
- 29.Whiting BR, Massoumzadeh P, Earl OA, O'Sullivan JA, Snyder DL, Williamson JF. Properties of preprocessed sinogram data in x-ray computed tomography. Med Phys. 2006;33:3290–3303. doi: 10.1118/1.2230762. [DOI] [PubMed] [Google Scholar]
- 30.Lasio GM, Whiting BR, Williamson JF. Statistical reconstruction for x-ray computed tomography using energy-integrating detectors. Phys Med Biol. 2007;52:2247–2266. doi: 10.1088/0031-9155/52/8/014. [DOI] [PubMed] [Google Scholar]
- 31.Evans JD, Politte DG, Whiting BR, O'Sullivan JA, Williamson JF. Noise-resolution tradeoffs in x-ray CT imaging: a comparison of Penalized Alternating Minimization and Filtered Backprojection algorithms. Med Phys. 2011;38:1444–1458. doi: 10.1118/1.3549757. [DOI] [PMC free article] [PubMed] [Google Scholar]
- 32.Green PJ. Bayesian reconstructions from emission tomography data using a modified EM algorithm. IEEE Trans Med Imaging. 1990;9:84–93. doi: 10.1109/42.52985. [DOI] [PubMed] [Google Scholar]
- 33.Evans JD, Politte DG, Whiting BR, O'Sullivan JA, Williamson JF. Effect of contrast magnitude and resolution metric on noise-resolution tradeoffs in x-ray CT imaging: a comparison of non-quadratic penalized alternating minimization and filtered backprojection algorithms. Proc of SPIE - Physics of Medical Imaging. 2011;7961:79612C. doi: 10.1118/1.3549757. [DOI] [PMC free article] [PubMed] [Google Scholar]
- 34.Hudson HM, Larkin RS. Accelerated image reconstruction using ordered subsets of projection data. IEEE Trans Med Imaging. 1994;13:601–609. doi: 10.1109/42.363108. [DOI] [PubMed] [Google Scholar]
- 35.Boone JM. Equivalent spectra as a measure of beam quality. Med Phys. 1986;13:861–868. doi: 10.1118/1.595811. [DOI] [PubMed] [Google Scholar]
- 36.Boone JM. The three parameter equivalent spectra as an index of beam quality. Med Phys. 1988;15:304–310. doi: 10.1118/1.596223. [DOI] [PubMed] [Google Scholar]
- 37.Birch R, Marshall M. Computation of bremsstrahlung X-ray spectra and comparison with spectra measured with a Ge(Li) detector. Phys Med Biol. 1979;24:505–517. doi: 10.1088/0031-9155/24/3/002. [DOI] [PubMed] [Google Scholar]
- 38.Ay MR, Sarkar S, Shahriari M, Sardari D, Zaidi H. Assessment of different computational models for generation of x-ray spectra in diagnostic radiology and mammography. Med Phys. 2005;32:1660–1675. doi: 10.1118/1.1906126. [DOI] [PubMed] [Google Scholar]
- 39.Sidky E, Yu L, Pan X, Zou Y, Vannier M. A robust method of x-ray source spectrum estimation from transmission measurements: Demonstrated on computer simulated, scatter-free transmission data. Journal of Applied Physics. 2005;97:124701. [Google Scholar]
- 40.Hubbell JH, Seltzer SM. Tables of X-Ray Mass Attenuation Coefficients and Mass Energy-Absorption Coefficients 1 keV to 20 MeV for Elements Z=1 to 92 and 48 Additional Substances of Dosimetric Interest. National Institutes of Standards and Technology. 1995 [Google Scholar]
- 41.Engel K, Baumer C, Weigert J, Zeitler G. Spectral analysis of scattered radiation in CT. Proceedings of SPIE - Physics of Medical Imaging. 2008:6913. [Google Scholar]
- 42.Johns PC, Yaffe M. Scattered radiation in fan beam imaging systems. Med Phys. 1982;9:231–239. doi: 10.1118/1.595076. [DOI] [PubMed] [Google Scholar]
- 43.Kak AC, Slaney M. Principles of Computerized Tomographic Imaging. New York: IEEE Press; 1988. [Google Scholar]
- 44.Xie L. X-ray computed tomography image reconstruction: Energy-integrating detector and performance analysis [Dissertation] St. Louis: Washington University in St. Louis; 2008. [Google Scholar]
- 45.Ohnesorge B, Flohr T, Klingenbeck-Regn K. Efficient object scatter correction algorithm for third and fourth generation CT scanners. Eur Radiol. 1999;9:563–569. doi: 10.1007/s003300050710. [DOI] [PubMed] [Google Scholar]
- 46.Siewerdsen JH, Jaffray DA. Cone-beam computed tomography with a flat-panel imager: magnitude and effects of x-ray scatter. Med Phys. 2001;28:220–231. doi: 10.1118/1.1339879. [DOI] [PubMed] [Google Scholar]
- 47.Lazos D, Williamson JF. Monte Carlo evaluation of scatter mitigation strategies in cone-beam CT. Medical Physics. 2010;37:5456–5470. doi: 10.1118/1.3488978. [DOI] [PMC free article] [PubMed] [Google Scholar]
- 48.Snyder DL, Miller MI, Thomas LJ, Politte DG. Noise and edge artifacts in maximum-likelihood reconstructions for emission tomography. IEEE Trans Med Imaging. 1987;6:228–238. doi: 10.1109/TMI.1987.4307831. [DOI] [PubMed] [Google Scholar]
- 49.Zbijewski W, Beekman FJ. Characterization and suppression of edge and aliasing artefacts in iterative x-ray CT reconstruction. Phys Med Biol. 2004;49:145–157. doi: 10.1088/0031-9155/49/1/010. [DOI] [PubMed] [Google Scholar]
- 50.O'Sullivan JA, Benac J, Williamson JF. Alternating Minimization Algorithm for Dual Energy X-ray CT. Proc IEEE International Symposium on Biomedical Imaging. 2004:579–582. [Google Scholar]


