

Abstract
Background
Peripheral carbidopa (CD) levels directly impact on central dopamine (DA) production in Parkinson disease (PD) through extracerebral inhibition of dopa decarboxylase (AADC) resulting in an increase in levodopa (LD) bioavailability.
Objective
Recent data suggests that higher CD doses than those presently used in PD treatment may result in improved clinical response. Optimizing CD doses in individual patients may, therefore, result in ideal individualized treatment.
Methods
A single center, randomized, double-blind study was carried out recruiting 5 Parkinson’s disease (PD) patients already on LD/CD and 1 treatment naïve PD patient using stable isotope labeled LD-1-13C as a substrate for a noninvasive breath test to evaluate individual AADC enzyme activity. Each patient was studied five times, receiving 200 mg LD-13C at each visit along with one of five randomized CD doses (0, 25, 50, 100 and 200 mg). The metabolite 13CO2 in breath was measured for evaluating AADC enzyme activity and plasma metabolite levels for LD-13C and homovanillic acid (HVA) were measured for 4 hours.
Results
HVA in plasma and 13CO2 in breath are metabolic products of LD. We found a significant positive correlation of 13CO2 DOB AUC0–240 with serum HVA AUC0–240 following the oral dose of LD-1-13C for all 5 doses of CD (r2 = 0.9378). With increasing inhibition of AADC enzyme activity with CD, we observed an increase in the plasma concentration of LD. We found an inverse correlation of the 13CO2 DOB AUC with serum LD-13C AUC. Our studies indicate the optimal dose of CD for maximal suppression of AADC enzyme activity can be determined for each individual from 13CO2 generation in breath.
Conclusions
The LD-breath test can be a useful noninvasive diagnostic tool for evaluation of AADC enzyme activity using the biomarker 13CO2 in breath, a first step in personalizing CD doses for PD patients.
Keywords: Parkinson’s disease, personalized therapy, dopa decarboxylase, L-DOPA-13C breath test
INTRODUCTION
The introduction of levodopa (LD) in the 1960’s revolutionized the treatment of Parkinson’s disease (PD) and remains the “gold standard” of treatment. Unfortunately, only about 1–3% of administered LD actually enters the brain intact. There are two dominant metabolic pathways for administered LD involving two major enzymes: aromatic L-amino acid decarboxylase (AADC) also known as DOPA decarboxylase (DDC), and catechol O-methyl transferase (COMT) (Fig. 1). Most of LD is metabolized extracerebrally, predominantly by decarboxylation to dopamine (DA), which does not penetrate the blood-brain barrier (BBB). To reduce the extracerebral conversion of LD to DA standard LD tablets include an inhibitor of AADC, which also does not cross the BBB, such as carbidopa (CD) or benserazide [1].
Figure 1.

Biotransformation pathways for L-DOPA (LD)
A diminished duration of response to LD characterizes progression of PD [2]. Approximately 50% of PD patients, when treated with L-dopa for more than 5 years, experience motor fluctuations such as the “wearing-off” phenomenon or the “on-off” phenomenon [3]. Disease progression also results in increase of both the total dose and frequency of LD doses per day a few years after treatment initiation [4].
There is strong evidence to suggest that LD bioavailability may be responsible for these sub optimal responses in later stage disease [5, 6]. CD has a critical impact on LD bioavailability since it reduces the extracerebral breakdown of LD by inhibiting LD decarboxylation and allowing more LD to enter brain, the site of clinical action [7]. Studies with administered stable isotope labeled LD demonstrate that amounts of CD in serum directly impact cerebral DA production [8]. Consequently, providing adequate and stable central DA levels for each patient by optimizing systemic LD bioavailability would seem a preferred target of CD/LD therapy.
Sinemet tablets are available by prescription in a 1 : 4 and 1 : 10 ratio of CD to LD fixed dose pills. However, without the evaluation of AADC enzyme activity in each patient it is impossible for physicians to select the optimal initial dose of CD to prevent the extracerebral conversion of LD to DA. The optimum daily dosage of CD-LD is currently determined by titration in each patient. This approach is not always successful as frequent fluctuations in LD response persist despite perceived optimal clinical titration. Recent data suggests an improvement in duration of LD response with daily CD doses 3–4 times greater than CD doses currently used in practice underscoring the inadequacy of current titration techniques in determining optimal CD dosing [9].
The major early species measured after administration of LD are 3,4-dihydroxyphenylacetic acid (DOPAC) and homovanillic acid (HVA) in a 1 : 1 ratio, which shifts toward HVA with time [10, 11]. An AADC inhibitor like CD or benzeraside increases the uptake of LD and 3-O-methyl-DOPA and delays the accumulation of DOPAC and HVA. Since DA is more difficult to measure due to its transient nature (half life of 2 minutes in plasma) its metabolites are better indicators of LD metabolism in PD patients. HVA, a major end product of dopamine metabolism, [12] has been used as a biomarker for LD metabolism for several years [13–16].
Stable isotope-labeled substrates can be used to provide rapid in vivo phenotype assessment of drug metabolizing enzymes. A few rapid, non-invasive, phenotype breath tests have been researched using [13C]- pantoprazole [17], [13C]-dextromethorphan [18], [13C]-uracil [19, 20] and [13C]-methacetin [21] for assessing CYP2C19, CYP2D6, Dihydropyrimidine Dehydrogenase (DPD) and CYP1A2 enzyme activity. Recently, the 13C-acetate breath test (13CABT) was used to demonstrate that gastric emptying (GE) was commonly delayed in PD patients and that delayed GE did not differ between PD patients with and without motor fluctuations [22].
In the present study we investigated the use of the L-DOPA-13C breath test (LD-BT) to evaluate AADC activity in PD patients using several doses of CD (0, 25, 50, 100 and 200 mg) with 200 mg 13C-LD. We also evaluated LD and HVA levels in plasma for correlation with 13CO2 in breath. In theory, finding the optimal inhibition of AADC by CD for each patient would enable physicians to improve clinical response and potentially lower the amount and frequency of LD dosing required to achieve desired circulating plasma levels of LD and consequently, adequate levels of LD crossing the BBB for conversion into DA.
METHODS
Patients
Informed consent was obtained from each patient who participated in this Institutional review board approved study at the Boston VA Healthcare System. The study was also reviewed and approved by the FDA (IDE application# G090270). Six male PD patients were enrolled in the study (Table 1). Five patients were receiving only CD-LD and were stable responders to medication (no fluctuations or wearing off on their daily CD-LD dosing schedule). One patient was newly diagnosed receiving no treatment for his PD. PD patients were given one of the following oral doses of CD 0 mg, 25 mg, 50 mg, 100 mg, 200 mg along with 200 mg of 13C-LD (manufactured by Cambridge Isotopes Laboratories Inc., Andover, MA) following an overnight fast (8 h) without food or PD medication. Each participant was studied 5 times (once on each CD dose) with random order of CD dose. The LD-BT was administered with at least 3 days apart using the 5 different doses of CD.
Table 1.
Clinical characteristics of PD patients enrolled in the study
| Patient | Weight kg |
Height cms |
BMI | Age | Sinemet use (years) |
Sinemet dose LD:CD daily |
Disease stage Hoehn Yahr |
Co-medications | Duration of disease |
|---|---|---|---|---|---|---|---|---|---|
| 1 | 85 | 183 | 25 | 65 | 20 | 800:200 | III | none | 20 |
| 2 | 80 | 168 | 28 | 59 | 1.5 | 1200:300 | II | none | 6 |
| 3 | 75 | 185 | 22 | 74 | 2 | 450:112.5 | III | none | 3 |
| 4 | 71 | 168 | 25 | 75 | 3 | 600:150 | III | none | 4 |
| 5 | 67 | 170 | 23 | 75 | 10 | 800:200 | II | none | 11 |
| 6 | 94 | 178 | 30 | 75 | 0 | 0 | II | LD naive | 0.75 |
Breath test
A breath sample was collected at baseline in a 1.3 L aluminum lined breath bag (Otsuka Pharmaceuticals) and at 10, 20, 30, 40, 50, 60, 90, 120, 150, 180, 210 and 240 minutes post ingestion of CD/LD-13C in a 300 mL aluminum lined breath bag. The breath samples were analyzed for 13CO2 content using a commercial IR spectrophotometer UBiT IR 300 with AS-10 autosampler. The ratio of 13CO2 to 12CO2 in breath samples collected at baseline and at multiple time points post ingestion of LD-13C was measured using infrared spectrometry. Delta-over-baseline (DOB) values were calculated from baseline and postdose 13CO2/12CO2 ratios, reflecting AADC enzyme activity. The DOB values for breath samples reflected the amount of 13CO2 generated by the decaboxylation of 13C-LD.
DOB = 1000 × [(13CO2/12CO2) Postdose - [(13CO2 /12CO2) Baseline]/RPDB] where DOB is expressed in units of per mil (‰), and RPDB = 0.012373 is 13C/12C in PDB (international standard Pee Dee Belemnite).
Breath test data was also analyzed to compute % AADC activity inhibition using the following formula: % AADC activity inhibition (at CD dose = n) = 100× [1– {DOB AUC0–240 (CD = n)/DOB AUC0–240 (CD = 0)}]
Plasma samples
Plasma samples were drawn at baseline prior to ingestion of CD/LD-13C and at 10, 20, 30, 40, 60, 90, 120, 180 and 240 minutes for LD and HVA levels. The plasma samples were analyzed by high performance liquid chromatography with electrochemical detection [23, 24].
RESULTS
The breath 13CO2 levels (represented as DOB values) and plasma HVA levels are seen to peak, respectively, 30 to 90 minutes and 60 to 120 minutes after LD-13C dose administration (Fig. 2a and b). The breath 13CO2 curves and the plasma HVA curves follow similar patterns. Most importantly, it should be observed that both breath 13CO2 and plasma HVA levels are seen to decrease significantly with increased CD doses and both do so monotonically with increasing CD dose up to ~100 mg. This can be observed most clearly when the breath DOB area-under-the–curve (AUC) and corresponding plasma HVA AUC vs Time are evaluated for the various CD doses for all 6 patients. The correlations found between breath DOB AUC and plasma HVA AUC are summarized in Table 2. As the results in Table 2 reveal, good positive linear correlations were found for all 6 subjects.
Figure 2.

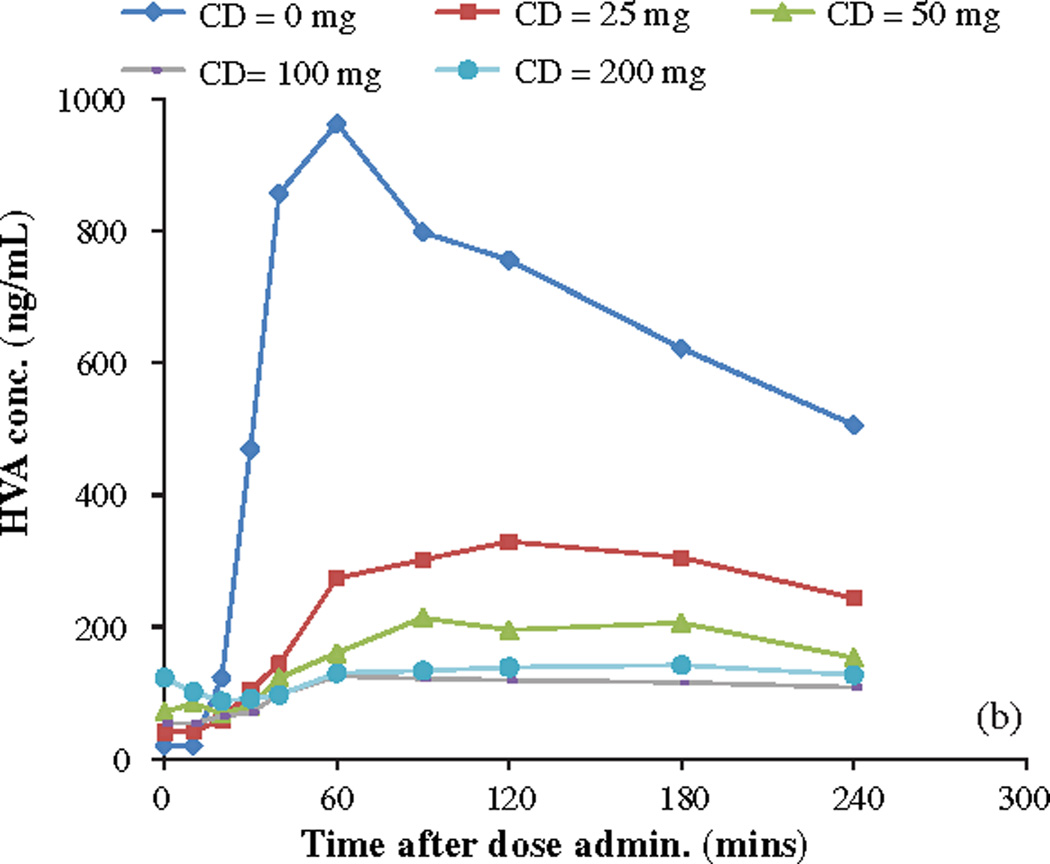
a) Breath 13CO2 levels represented as DOB values vs time after LD-13C dose with different CD doses. Patient 5; fixed 200 mg LD-13C dose. b) Plasma HVA levels vs time after LD-13C dose with different CD doses. Patient 5; fixed 200 mg LD-13C dose.
Table 2.
Summary of correlations found between breath DOB AUC and plasma HVA AUC for all 6 patients studied; AUCs to 240 and 120 minutes
| Correlations r2 | Patient 1 | Patient 2 | Patient 3 | Patient 4 | Patient 5 | Patient 6 | Mean | Median |
|---|---|---|---|---|---|---|---|---|
| Breath DOB AUC240 & Plasma HVA AUC240 | 0.821 | 0.948 | 0.946 | 0.952 | 0.983 | 0.840 | 0.915 | 0.947 |
| Breath DOB AUC120 & Plasma HVA AUC120 | 0.913 | 0.944 | 0.958 | 0.942 | 0.987 | 0.884 | 0.938 | 0.943 |
Data was also analyzed to quantify the correlation between breath 13CO2 levels and corresponding plasma HVA and LD levels Fig. 3. There is a strong positive linear correlation (R2 = 0.968 between the two metabolic products 13CO2 and HVA for the given LD dose with both showing elevated levels at low CD dose and reduced levels at high CD doses. There is also a good inverse correlation (R2 = 0.919) between average DOB AUC0–240 minutes vs corresponding average plasma LD AUC0–240 minutes.
Figure 3.


a) Linear correlation of breath Average DOB AUC240 vs Average plasma HVA AUC240 ng/mL /h n = 6; R2 = 0.983. b) Linear correlation of breath Average DOB AUC240 vs Average plasma LD AUC240 ng/mL /h n = 6; R2 = 0.929.
Data analyses were also performed in an attempt to determine a preliminary breath test-based criterion for the “optimal” CD dose for each subject in our study. We first considered simply defining the optimal CD dose as that which yields the minimum DOB AUC0–240 and, hence, maximum AADC inhibition (relative to CD = 0 dose), in each individual. All 6 subjects achieved minimum DOB AUC and maximum AADC inhibition with the maximum CD dose of 200 mg (Table 3a and b). However, when we also examined the results obtained for plasma LD AUC0–240 we found that maximal circulating LD in each individual often occurred at lower CD doses than 200 mg (see Table 3c). In fact, for Patients 1, 4, and 6 maximal LD AUC0–240 occurred with CD = 50mg and for Patient 2 with CD = 100 mg. In light of these results, we decided to alternatively look for a breath test derived “cut-point” for DOB AUC or breath test derived AADC inhibition that might better predict CD doses which yielded maximal circulating LD AUC. The results of that analysis led us to conclude that, at least for this limited data set, a ‘cut-point’ of DOB AUC0–240 <37 ((0/00)-hr) or % AADC inhibition (relative to CD= 0 dose) >55% works best for predicting CD doses producing maximal circulating LD (LD AUC). Using either of these criteria for selecting the optimal CD dose, the CD dose yielding maximal circulating LD levels in each subject was correctly predicted for 4 of the 6 subjects. Table 3b and c.
Table 3.
Tables of calculated DOB AUC0–240, corresponding % AADC inhibition (relative to 0 mg CD dose) and normalized LD AUC0–240 achieved with various CD doses in the six subjects studied
| Table 3a | ||||
|---|---|---|---|---|
| DOB AUC0–240 ((0/00)-hr) | ||||
| Patient | CD = 25 mg | 50 mg | 100 mg | 200 mg |
| 1 | 38.9 | 29.3 | 28.9 | 23.5 |
| 2 | 35.6 | 36.8 | 31.6 | 23.2 |
| 3 | 49.9 | 42.5 | 39.9 | 36.7 |
| 4 | 35.8 | 37.2 | 34.9 | 26.2 |
| 5 | 52.4 | 37 | 38.8 | 30.1 |
| 6 | 41.4 | 37 | 38.4 | 28.5 |
| Table 3b | ||||
|---|---|---|---|---|
| % AADC inhibition (relative to CD = 0 mg) from breath DOB AUC0–240 | ||||
| Patient | CD = 25 mg | 50 mg | 100 mg | 200 mg |
| 1 | 51 | 63 | 64 | 70 |
| 2 | 51 | 49 | 56 | 68 |
| 3 | 42 | 51 | 54 | 58 |
| 4 | 57 | 55 | 58 | 68 |
| 5 | 59 | 71 | 70 | 76 |
| 6 | 50 | 56 | 54 | 66 |
| Table 3c | ||||
|---|---|---|---|---|
| Intraindividual Normalized Plasma LD AUC0–240 vs CD dose | ||||
| Patient | CD = 25 mg | 50 mg | 100 mg | 200 mg |
| 1 | 0.438 | 1.00 | 0.673 | 0.632 |
| 2 | 0.410 | 0.900 | 1.00 | 0.808 |
| 3 | 0.827 | 0.986 | 0.436 | 1.00 |
| 4 | 0.415 | 1.00 | 0.761 | 0.772 |
| 5 | 0.935 | 0.939 | 0.991 | 1.00 |
| 6 | 0.941 | 1.00 | 0.792 | 0.841 |
Minimum patient DOB AUC values highlighted with grey shading; proposed “optimal” values (DOB AUC at lowest CD dose needed to achieve DOB AUC ≤35) in bold font (see text for discussion).
Maximum patient AADC activity inhibition with grey shading; proposed “optimal” values (% AADC inhibition at lowest CD dose needed to achieve AADC inhibition >55%) in bold font (see text for discussion).
Maximum patient normalized LD AUC0–240 in bold font.
DISCUSSION
Most PD patients typically 4–7 years into their disease develop motor complications while taking LD. The most prominent of these complications tends to be a diminished duration of response to LD frequently characterized by loss of benefit prior to the patient’s next LD dose (e.g., “wearing off”). One commonly accepted explanation is a persistent loss of nigrostriatal terminals related to continuing nigral cell loss resulting in a diminished capacity to store and/or buffer DA striatal concentrations. Consequently, in later stage disease there is a change towards emphasizing peripheral LD pharmacokinetics as being most important in maintaining central DA levels. Data in rats shows that peripheral LD kinetics is similar to striatal LD and dopamine kinetics [25–28]. The measurement of plasma LD concentration could be useful to predict DA kinetics in the striatum and to treat the motor fluctuations of parkinsonian patients [29]. A non-invasive test that can predict optimal decarboxylation inhibition and reflect serum LD levels might prove useful in individualizing CD-LD therapy both in recently diagnosed and in later stage PD patients when peripheral LD pharmacokinetics significantly influence motor complications.
We expected that LD serum levels would closely mirror decarboxylation at all CD doses. This is not the case at CD doses of 100 and 200 mg. This lack of clear correlation with higher CD doses may simply reflect our small sample size. Conversely, it may be possible that higher serum LD levels generated by greater decarboxylation inhibition are distributed into other compartments or subject to the other metabolic pathway. In this regard shunting from the decarboxylation pathway to methylation with increasing decarboxylation inhibition is a possibility. It has been shown that normal AADC mediated catabolism of LD typically dominates over the COMT mediated LD breakdown. However, as AADC activity is inhibited COMT activity can become the dominant pathway [30]. With regard to distribution there is evidence in animals that pretreatment with CD results in higher LD AUC levels in systemic compartments other than blood [31].
In our study, stable isotope labeled 13C-LD was decarboxylated by AADC to generate DA and 13CO2 through loss of 13C in the carboxyl group Fig. 4. The biomarker 13CO2 in exhaled breath was measured using a commercially available POCone infrared spectrophotometer (Photal Electronics, Japan). A diminished amount of exhaled 13CO2 generation indicated better inhibition of peripheral LD decarboxylation. HVA is a downstream metabolic product of DA after ingestion of LD [32] (Fig. 1). HVA can thus act as biomarker for the peripheral and cerebral conversion of LD to DA via AADC.
Figure 4.

Metabolic pathway of 13C-LD to generate 13CO2 DA and HVA.
The LD-BT study has shown a direct correlation of 13CO2 generation in breath with HVA levels in plasma and an inverse correlation of 13CO2 content in breath with circulating LD levels in plasma. We have demonstrated that the LD-BT can be used as a direct, non invasive diagnostic probe for extracerebral AADC enzyme activity and may enable physicians to select the optimal dose of CD required for optimal suppression of AADC enzyme activity thus minimizing extracerebral degradation of LD to DA.
The present study was designed primarily to determine if the LD-BT is capable of evaluating AADC enzyme activity. It was not designed to select the optimal dose of CD for each patient. Patients were administered the LD-BT after an 8 to 12 hr overnight fast with abstention from any LD medications for the same duration. Thus, patients were tested after nearly full clearance of CD from their bloodstreams. This did not reflect the patient’s daily PD regimens. 5 of the 6 patients studied normally took Sinemet 3 to 6 times per day (see Table 1). Thus optimal CD doses for these patients could be considerably lower if the LD-BT was administered in the normal dosing schedule when there is a probable build-up of CD in their bloodstreams. Future studies need to be performed for selection of individual optimized CD doses. Another issue that was not addressed with this study is the plasma LD degradation due to extracerebral COMT activity. It has been shown that AADC breakdown of LD typically dominates COMT breakdown as a peripheral LD loss pathway. It has also been shown that as AADC activity is inhibited COMT activity can upregulate and become the dominant pathway [19]. The degradation of LD through the COMT pathway is probably why circulating LD levels typically did not continue to increase at the highest CD doses even while the AADC inhibition rose (see Fig. 1). It should be noted that none of the patients receiving LD-CD in this study received COMT inhibitors. Future studies should be designed to address the involvement of COMT pathway to degradation of LD.
Future studies with fully 13C labeled LD would enable physicians to optimize the extracerebral enzyme activity inhibition of both AADC using breath 13CO2 as a biomarker and COMT using single point measurement of 13C labeled 3-OMD in plasma as a biomarker. With maximal AADC and COMT inhibition extracerebral LD degradation could be optimally minimized resulting in lowered and less frequent LD dose administration. Future studies should be performed to correlate the optimal inhibition of LD degradation with improvement in clinical outcomes in PD patients.
Clearly, additional studies must be performed in the future with greater numbers of subjects to more accurately determine optimized “cut-points” for the breath test. It should be noted that the advantage of being able to use a breath test derived ‘cut point’ based on an absolute DOB AUC value instead of % AADC inhibition criterion is that the former does not require a “baseline” breath test for CD = 0 to be performed.
CONCLUSIONS
The dose of CD in Sinemet tablets especially in the 1 : 10:: CD:LD is not adequate in most PD patients to optimally suppress AADC. The LD-BT provides physicians a diagnostic tool to rapidly and non invasively evaluate AADC enzyme activity for each PD patient using various randomized doses of CD, a first step towards personalizing CD therapy.
ACKNOWLEDGMENTS
Supported by an STTR grant (1R41NS063487) from the National Institute of Neurological Disorders and Stroke.
Footnotes
COMPETING INTERESTS
Dr. A.S. Modak is the Associate Director at Medical Products R&D at Cambridge Isotope Laboratories Inc., Andover, Massachusetts, U.S.A. which manufactures the 13C substrate used in the study for the breath test. Commercialization of the LD breath test could be financially beneficial to the company.
The other authors declare no conflict of interest.
REFERENCES
- 1.Calne DB, Reid JL, Vakil SD, et al. Idiopathic Parkinsonism treated with an extracerebral decarboxylase inhibitor in combination with levodopa. Br Med J. 1971;3:729–732. doi: 10.1136/bmj.3.5777.729. [DOI] [PMC free article] [PubMed] [Google Scholar]
- 2.Rascol O, Payoux P, Ory F, Ferreira JJ, Brefel-Courbon C, Montastruc JL. Limitations of current Parkinson’s disease therapy. Ann Neurol. 2003;53(Suppl 3):S3–S12. doi: 10.1002/ana.10513. discussion S-5. [DOI] [PubMed] [Google Scholar]
- 3.Nutt JG, Holford NH. The response to levodopa in Parkinson’s disease: Imposing pharmacological law and order. Ann Neurol. 1996;39:561–573. doi: 10.1002/ana.410390504. [DOI] [PubMed] [Google Scholar]
- 4.Suchowersky O. Parkinson’s disease: Medical treatment of moderate to advanced disease. Curr Neurol Neurosci Rep. 2002;2:310–316. doi: 10.1007/s11910-002-0006-5. [DOI] [PubMed] [Google Scholar]
- 5.Nutt JG, Woodward WR, Hammerstad JP. The “on-off” phenomenon in Parkinson’s disease: Relation to levodopa absorption and transport. New Engl J Med. 1984;310:483–488. doi: 10.1056/NEJM198402233100802. [DOI] [PubMed] [Google Scholar]
- 6.Mouradian MM, Juncos JL, Fabbrini G, Chase TN. Motor functions in Parkinson’s disease: Pathogenetic and therapeutic studies. Ann Neurol. 1987;22:475–479. doi: 10.1002/ana.410220406. [DOI] [PubMed] [Google Scholar]
- 7.Nutt JG, Woodward WR, Anderson JL. The effect of carbidopa on the pharmacokinetics of intravenously administered levodopa: The mechanism of action in the treatment of Parkinsonism. Ann Neurol. 1985;18:537–543. doi: 10.1002/ana.410180505. [DOI] [PubMed] [Google Scholar]
- 8.Durso R, Evans JE, Josephs E, Szabo G, Evans B, Fernandez HH, Browne TR. Variable absorption of carbidopa affects both peripheral and central levodopa metabolism. J Clin Pharmacol. 2000;40:854–860. doi: 10.1177/00912700022009585. [DOI] [PubMed] [Google Scholar]
- 9.Nutt J, Alfred J, Brod L. Does the dose of carbidopa matter? A randomized clinical trial in Parkinson’s disease. Mov Disord. 2012;27:750–753. doi: 10.1002/mds.24998. [DOI] [PMC free article] [PubMed] [Google Scholar]
- 10.Maki Okada, Ryuji Nakao, Rie Hosoi, Ming-Rong Zhang, Toshimitsu Fukumura, Kazutoshi Suzuki, Osamu Inoue Microdialysis with radiometric monitoring of –[β-11C]DOPA to assess dopaminergic metabolism: Effect of inhibitors of amino acid decarboxylase, monoamine oxidase, and catechol-O-methyltransferase on rat striatal dialysate. J Cereb Blood Flow Metab. 2011;31(1):124–131. doi: 10.1038/jcbfm.2010.58. [DOI] [PMC free article] [PubMed] [Google Scholar]
- 11.Goodall MC, Gitlow SE, Alton H. Decreased noradrenaline (norepinephrine) synthesis in familial dysautonomia. J Clin Invest. 1971;50:2734–2740. doi: 10.1172/JCI106774. [DOI] [PMC free article] [PubMed] [Google Scholar]
- 12.Elchisak MA, Polinsky RJ, Ebert MH, Kopin IJ. Kinetics of homovanillic acid and determination of its production rate in humans. J Neurochem. 1982;38:380–385. doi: 10.1111/j.1471-4159.1982.tb08640.x. [DOI] [PubMed] [Google Scholar]
- 13.Durso R, Evans JE, Josephs E, Szabo G, Handler J, Jennings D, Browne TR. Central levodopa metabolism in Parkinson’s disease after stable isotope labeled levodopa. Ann Neurol. 1997;42:300–304. doi: 10.1002/ana.410420305. [DOI] [PubMed] [Google Scholar]
- 14.LeWitt PA, Galloway MP, Matson W, Milbury P, McDermott M, Srivastava DK, et al. Markers of dopamine metabolism in Parkinson’s disease. Neurology. 1992;42:2111–2117. doi: 10.1212/wnl.42.11.2111. [DOI] [PubMed] [Google Scholar]
- 15.Dingemanse J, et al. Pharmacodynamics of benserazide assessed by its effects on endogenous and exogenous levodopa pharmacokinetics. Br J Clin Pharmacol. 1997;44:41–48. doi: 10.1046/j.1365-2125.1997.00610.x. [DOI] [PMC free article] [PubMed] [Google Scholar]
- 16.Szabo G, Davoudi HG, Durso R. High-performance liquid chromatographic method for measuring homovanillic acid in cerebrospinal fluid using electrochemical detection with internal standardization. J Chromatog. 1988;430:112–117. doi: 10.1016/s0378-4347(00)83139-4. [DOI] [PubMed] [Google Scholar]
- 17.Desta Z, Modak A, Nguyen PD, Lemler SM, Kurogi Y, Li L, Flockhart DA. Rapid identification of the hepatic cytochrome P450 2C19 activity using a novel and noninvasive [13C]-pantoprazole breath test. J Pharmacol Exp Ther. 2009;329:297–305. doi: 10.1124/jpet.108.147751. [DOI] [PMC free article] [PubMed] [Google Scholar]
- 18.Leeder JS, Pearce RE, Gaedigk A, Modak A, Rosen DI. Evaluation of a [13C]-dextromethorphan breath test to assess CYP2D6 phenotype. J Clin Pharmacol. 2008;48:1041–1051. doi: 10.1177/0091270008319709. [DOI] [PMC free article] [PubMed] [Google Scholar]
- 19.Mattison L, Hany Ezzeldin H, Carpenter M, Modak A, Johnson M, Diasio R. Rapid identification of dihydropyrimidine dehydrogenase deficiency by using a novel 2-13C-uracil breath test. Clin Can Res. 2004;10:2652–2659. doi: 10.1158/1078-0432.ccr-03-0374. [DOI] [PubMed] [Google Scholar]
- 20.Mattison L, Fourie J, Renee A, Desmond R, Modak A, Saif M, Diasio R. Racial Differences in dihydropyrimidine dehydrogenase activity: Increased prevalence of DPD deficiency in African Americans Compared to Caucasians. Clin Can Res. 2006;12:5491–5495. doi: 10.1158/1078-0432.CCR-06-0747. [DOI] [PubMed] [Google Scholar]
- 21.Lalazar G, Adar T, Ilan Y. Point-of-care continuous 13C-methacetin breath test improves decision making in acute liver disease: Results of a pilot clinical trial. World J Gastroenterol. 2009;15:966–972. doi: 10.3748/wjg.15.966. [DOI] [PMC free article] [PubMed] [Google Scholar]
- 22.Tanaka Y, Tomohiro Kato T, Nishida H, Araki H, Murase M, Nagaki M, Moriwaki H, Inuzuka T. Is there a difference in gastric emptying between Parkinson’s disease patients under long-term L-dopa therapy with and without motor fluctuations? An analysis using the 13C-acetate breath test. J Neurol. 2009;256:1972–1976. doi: 10.1007/s00415-009-5220-5. [DOI] [PubMed] [Google Scholar]
- 23.Miho Murata Pharmacokinetics of L-dopa Special reference to food and aging. J Neurol. 2006;253(3):47–52. [Google Scholar]
- 24.Kuoppamäki M, Al-Barghouthy G, Jackson MJ, Smith LA, Quinn N, Jenner P. L-dopa dose and the duration and severity of dyskinesia in primed MPTP-treated primates. J Neural Transm. 2006;114(9):1147–1153. doi: 10.1007/s00702-007-0727-3. [DOI] [PubMed] [Google Scholar]
- 25.Rahman MK, Toshiharu N, Takeshi K. Aromatic l-amino acid decarboxylase activity in central and peripheral tissues and serum of rats with l-dopa and l–5-hydroxytryptophan as substrates. Biochem Pharmacol. 1981;30(6):645–649. doi: 10.1016/0006-2952(81)90139-8. [DOI] [PubMed] [Google Scholar]
- 26.Hoffman J, Meiega W, Hawk T, Grafton S, Luxen A, Mahoney DK, Barrio J, Huang SC, Mazziotta J, Phelps M. The effects of carbidopa administration on 6-[18F]-Fluoro-L-DOPA kinetics in positron emission tomography. J Nucl Med. 1992;33(8):1472–1477. [PubMed] [Google Scholar]
- 27.Gancher ST, Nutt JG, Woodward WR. Peripheral pharmacokinetics of levodopa in untreated, stable, and fluctuating parkinsonian patients. Neurology. 1987;37(6):940–947. doi: 10.1212/wnl.37.6.940. [DOI] [PubMed] [Google Scholar]
- 28.Fabbrini G, Juncos J, Mouradian MM, Serrati C, Chase TN. Levodopa pharmacokinetic mechanisms and motor fluctuations in Parkinson’s disease. Ann Neurol. 1987;21(4):370–376. doi: 10.1002/ana.410210409. [DOI] [PubMed] [Google Scholar]
- 29.The Parkinson Study Group. Levodopa and the Progression of Parkinson’s Disease. N Engl J Med. 2004;351:2498–2508. doi: 10.1056/NEJMoa033447. [DOI] [PubMed] [Google Scholar]
- 30.Heikkinen H, et al. Entacapone improves the availability of L-dopa in plasma by decreasing its peripheral metabolism independent of L-dopa/carbidopa dose. Br J Clin Pharmacol. 2002;54:363–371. doi: 10.1046/j.1365-2125.2002.01654.x. [DOI] [PMC free article] [PubMed] [Google Scholar]
- 31.Deleu D, Sarre S, Ebinger G, Michotte Y. The Effect of Carbidopa and Entacapone pretreatment on the l-dopa pharmacokinetics and metabolism in blood plasma and skeletal muscle in beagle dog: An in vivo microdialysis study. J Pharmacol Exper Ther. 1995;273:1323–1331. [PubMed] [Google Scholar]
- 32.Lewitt PA. Recent advances in CSF biomarkers for Parkinson’s disease. Parkinsonism Relat Disord. 2012;18:S49–s51. doi: 10.1016/S1353-8020(11)70017-7. [DOI] [PubMed] [Google Scholar]