

Abstract
We report the results of an association study of melanoma based on the genome-wide imputation of the genotypes of 1,353 cases and 3,566 controls of European origin conducted by the GenoMEL consortium. This revealed a novel association between several single nucleotide polymorphisms (SNPs) in intron 8 of the FTO gene, including rs16953002, which replicated using 12,313 cases and 55,667 controls of European ancestry from Europe, the USA and Australia (combined p=3.6×10⁻¹², per-allele OR for A=1.16). As well as identifying a novel melanoma susceptibility locus, this is the first study to identify and replicate an association with SNPs in FTO not related to body mass index (BMI). These SNPs are not in intron 1 (the BMI-related region) and show no association with BMI. This suggests FTO’s function may be broader than the existing paradigm that FTO variants influence multiple traits only through their associations with BMI and obesity.
Cutaneous melanoma is a disease predominantly of fair-skinned individuals. Established risk factors include a family history of melanoma1, pigmentation phenotypes such as inability to tan2–5 and number of melanocytic naevi6,7. Established genetic risk factors include rare highly-penetrant variants, at least 11 common variants of lower effect identified by genome-wide association studies (GWAS)8,9 (many related to pigmentation or naevus count10,11) and mutations of intermediate effect in the MITF gene identified through sequencing multiple-affected melanoma families12,13.
The FTO gene was first found to be associated with obesity in GWAS of type 2 diabetes14 and obesity15,16. Most14,17–21 but not all22, 23 studies found no association between FTO and type 2 diabetes risk after adjustment for BMI. The strongest associations were with variants in intron 1 of FTO, but linkage disequilibrium (LD) stretches across introns 1 and 2 and exon 2. No SNP outside intron 1 has previously been associated with any trait and no SNP within intron 1 has been associated with any trait unrelated to BMI.
The GenoMEL consortium focuses on genetic susceptibility to melanoma and has conducted two melanoma GWAS (Phase 1 and Phase 2) using samples from populations of European or Israeli ancestry9,11. Genotypes of the 1,373 cases and 3,571 controls from Phase 1 of the GenoMEL GWAS of melanoma9 were imputed, giving 2.6M SNPs, each tested for association with melanoma risk using geographic region as a covariate (see Online Methods). The most significant SNP in a region not previously associated with melanoma was in FTO. Three SNPs in intron 8 of the gene FTO were significant at p<10−5, the most significant being rs16953002 (p=5.59×10⁻⁶, per-allele OR=1.33, risk allele A, risk allele frequency=0.19) and rs12596638 (p=4.4310−6, per-allele OR=1.34, risk allele A, risk allele frequency=0.19) (in strong LD: r2=0.96). Imputation quality was confirmed by subsequent genotyping (see Online Methods).
Following this finding, a region 1Mb either side of rs16953002 was imputed for 1,449 cases and 4,043 controls in GenoMEL melanoma GWAS Phase 211 and SNP dosage regressed on melanoma case-control status with geographic region as a covariate. In this analysis rs16953002 was genotyped (p=0.015, OR=1.16) and rs12596638 imputed (p=0.023, OR=1.15). Combining all GenoMEL GWAS gave 5 SNPs within 18kb with p<10−4 in intron 8 of FTO and over 250 kb from the closest SNP associated with BMI (Fig. 1).
Figure 1.
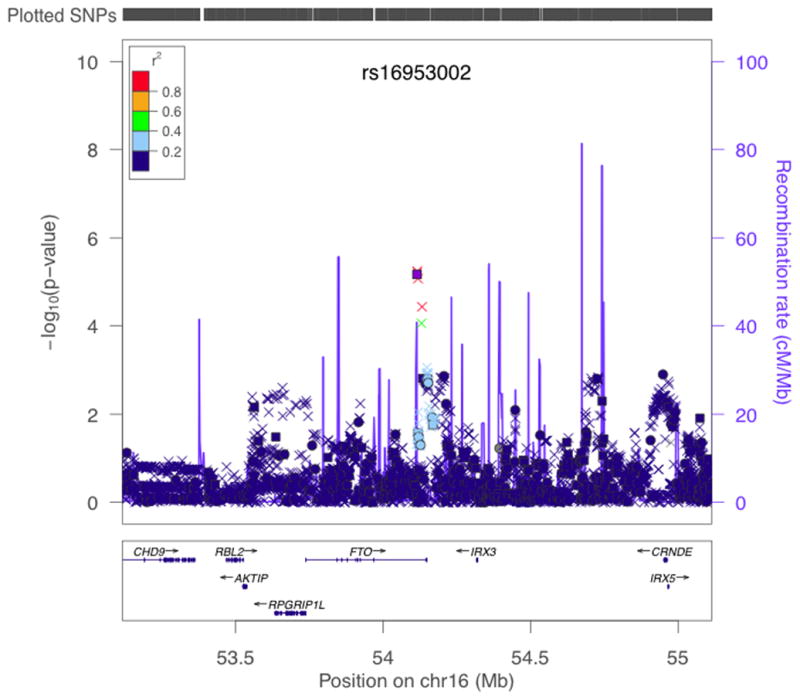
Results of stratified trend tests of imputed data for association with melanoma in region around FTO in GenoMEL Phase 1 and 2 data combined. −log10p values for association between SNPs in the region of FTO and melanoma case-control status are shown adjusted for geographic region. Colour of points indicates degree of LD with rs16953002 (indicated by purple square). SNPs genotyped in all GenoMEL samples are plotted as circles, SNPs imputed in all samples as crosses and SNPs genotyped in some samples and imputed in others (as a result of chip differences) as squares. Positions of genes are given underneath the graph and estimated recombination rates also given by the blue line along the bottom, with scale on the right hand axis. Plot produced using LocusZoom39.
Replication (mainly using existing GWAS data) was sought using other samples of European ancestry from Europe, Australia and the USA, totalling 10,865 cases and 51,624 controls (Supplementary Table 1). Combined, the replication samples showed association between rs16953002 and melanoma with an allelic OR of 1.14, p = 4.8×10⁻⁹, with all sample sets showing OR estimates in the same direction as the original finding and with no evidence of heterogeneity. Combined with the GenoMEL samples, strong evidence of association with melanoma was observed: p=3.6×10⁻¹², per-allele OR=1.16, 95% confidence interval (1.11,1.20), I2=0 (Fig 2).
Figure 2.
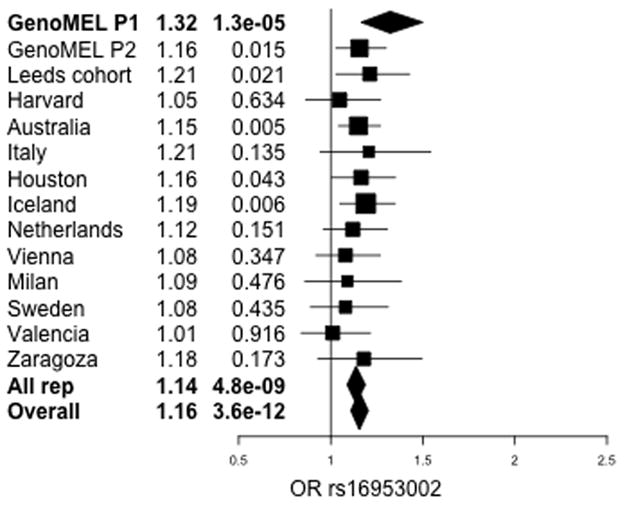
Forest plot of estimated per-allele ORs and p-values for effect of rs16953002 on melanoma risk. Horizontal bars indicate 95% confidence intervals. Results shown for GenoMEL Phase 1 discovery data and subsequent replication data with meta-analysis for replication data only and all data.
BMI has, at best, a weak effect on risk of melanoma24,25. Given the clear association between variants in FTO and BMI, we investigated whether the melanoma-associated SNPs showed any association with BMI or, conversely, whether the known BMI-associated SNPs showed any association with melanoma.
BMI data were available for 37% of cases and 59% of controls (many of the GenoMEL samples and 7 replication sets) (Supplementary Table 1), with additional Icelandic controls to give 63,518 Icelandic samples with BMI and 14,222 from elsewhere with BMI. Adjusting log(BMI) for age and age2 and regressing this on SNP genotype, with case-control status and sex as covariates, there was no significant association between rs16953002 and BMI with a combined p-value of p=0.15 (Supplementary Fig. 1). A more powerful dataset for assessing BMI-SNP associations is that of the GIANT consortium26 (http://www.broadinstitute.org/collaboration/giant/index.php/GIANT_consortium_data_files). In the GIANT consortium data allele A of rs16953002 was very weakly associated with decreased BMI (p=0.0156 in 123,852 individuals, indicating at most a very small effect size).
In contrast the genotyped SNP in the FTO region most strongly associated with BMI in the GenoMEL data was rs8050136 (p=8.7×10−56 in all our datasets combined, Supplementary Fig. 2 and Supplementary Fig. 3). In the GIANT dataset this association with BMI reaches p=1×10−59.
We also find very little LD between the two SNPs (r2=0.000039 in 35,583 Icelandic controls and <0.006 in every other control set). In a recent study that sequenced FTO, only SNPs in intron 1 were associated with BMI27. It could be that the rs16953002-BMI association in the GIANT data is due to a very well-powered dataset picking up on slight LD. The great difference between the strength of association between BMI at rs8050136 and at rs16953002 can clearly be seen in a plot of the GIANT results (Supplementary Fig. 4).
rs8050136 was not associated with melanoma, having a combined meta-analysis p-value with GenoMEL of 0.19 (per-allele OR=1.02) (Supplementary Fig. 5). Therefore from our data the known BMI-related SNPs are associated with BMI, but not with melanoma risk, and the melanoma-associated SNPs show no evidence of association with BMI. We also found no association between melanoma risk and adjusted BMI in the GenoMEL data (p=0.96).
The association between rs16953002 and melanoma risk is consistent across geographic regions (Fig. 2 and Supplementary Fig. 6) and we found no significant difference in effect across subsets of the GenoMEL data defined by sex, tumour site, family history, early onset of disease and multiple primary tumours or association with any established melanoma-related trait (naevus count, sun sensitivity) (data not shown). The association between rs16953002 and melanoma risk persists in the subset of samples with BMI recorded even after adjusting for BMI (p=0.01) despite a substantial reduction in sample size (Supplementary Table 2 and Supplementary Methods).
We split the GenoMEL data into quartiles defined by adjusted BMI of controls and regressed case/control status on rs16953002 with sex as a covariate in each quartile. The association was stronger for those samples in the first quartile (lowest BMI) than those in the other quartiles (OR=1.66, p=3.00×10⁻⁵ versus max OR=1.03, min p=0.82) (Supplementary Fig. 7), a difference that is significant (p=0.0005). This is consistent with rs16953002 only being associated with melanoma risk in those people with low BMI. Attempting to replicate the results, defining BMI quartiles within each population, the Australian data showed a similar effect (p=0.003), but other non-UK replication sets gave more equivocal results (Supplementary Fig. 7) (p=0.6 for all replicate samples and p=0.06 with GenoMEL samples included). However in the 9 replication studies for which BMI data were available, rs16953002 always had the greatest association with melanoma risk for those in quartile 1 or 2.
While the functional effect(s) of FTO is far from understood, evidence points to a variety of possible effects on BMI-related traits. However, a loss-of-function mutation in FTO caused gross developmental defects in nine members of a Palestinian family, suggesting a broader function for FTO28.
FTO has been associated with end-stage renal disease29, acute coronary syndrome30, myocardial infarction31, all-cause mortality32, Alzheimer’s disease33 and osteoarthritis34. Even after adjustment for BMI, some BMI-related traits show association with FTO variants, but it may be BMI simply correlates with a weight-related factor acting more directly on the trait of interest. Given that BMI is a risk factor for many cancers, the BMI-related SNPs in intron 1 of FTO have been studied in a number of cancers. A study of lung, kidney and upper aero-digestive cancers showed no significant effect overall after correction for multiple testing35. The largest study of FTO and endometrial cancer found an association with a known BMI-associated SNP (p=0.01)36 that disappears after adjustment for BMI.
Thus there is little evidence of variants in FTO being associated with any trait unrelated to BMI. It may be that the melanoma-associated SNPs are in LD with functional SNPs outside of FTO, but given the low level of LD in the region (Fig. 1) this seems unlikely. It should be noted that our most significant SNP, rs16953002, is only 31kb from exon 9 of FTO, over 146kb from exon 8 of FTO and over 202kb from the nearest other gene, IRX3. SNPs overlapping regulatory elements, such as transcription factor binding sites can be identified using the recent ENCODE data as well other data sources37,38. Looking up the FTO gene, 2,148 SNPs are identified, only 8 of which reach the highest score possible without eQTL data (score 2a - “Likely to affect binding”). Six of these are in intron 1, the location of most of the BMI-associated SNPs, 5 of these in a 5.4kb region less than 1kb from rs8050136. The other two SNPs are 13kb apart from one another in intron 8 and, interestingly, one of these is rs16953002, the melanoma-associated SNP (see Supplementary material for further details).
In conclusion, this is the first time to our knowledge that any variant in FTO has been shown to have a replicable association with a trait without being associated with BMI. It is also the first time that any variant in FTO outside intron 1 has been shown to have any association with any trait. As such this will be of interest to researchers in the fields of both cancer genetics and obesity research.
URLs
GenoMEL, http://www.genomel.org/; Wellcome Trust Case Control Consortium http://www.wtccc.org.uk/; RegulomeDB, http://RegulomeDB.org/
Methods
Samples
Phase 1 of the original GenoMEL GWAS consisted of cases and controls collected from 8 centres across 6 different European countries. These were supplemented with controls from the Wellcome Trust Case Control Consortium (WTCCC)19. Standard quality control (QC) measures were applied to both samples and SNPs, giving a total of 1,353 cases and 3,571 controls. Phase 2 of the GenoMEL GWAS consisted of cases and controls from 10 centres (4 not in Phase 1) in 8 different European countries and Israel, supplemented again by samples from the WTCCC. In both phases cases were preferentially selected to have a family history of melanoma, multiple primary tumours or an early age of onset. After QC 1,450 cases and 4,047 controls remained (see 11 for details of QC and samples). 680 supplementary UK cases and 1,785 controls were obtained from a population-based study of incident melanoma cases diagnosed between September 2000 and December 2006 from a geographically defined area of Yorkshire and the Northern region of the UK9,40,41. Controls were ascertained by contacting general practitioners to identify eligible individuals. These controls were frequency-matched with cases for age and sex from general practitioners who had also had cases as part of their patient register. A further 220 controls were sex- and age-matched and from the same primary care practice as incident cases of colorectal cancer recruiting from hospitals in Leeds42.
The only GenoMEL centre that collected BMI data was Leeds. Within Leeds, two studies were used, a family-based study that did not collect BMI and a case-control study that did collect BMI (see Supplementary Table 1).
For details of replication samples see Supplementary Note.
Genotyping
Most GenoMEL Phase 1 samples were genotyped on the Illumina HumanHap300 BeadChip version 2 duo array (with 317k tagging SNPs), with the exception of the French cases which were genotyped on the Illumina HumanCNV370k array. The GenoMEL Phase 2 samples were genotyped on the Illumina 610k array.
In the genotyping of the UK case-control samples, rs16953002 and rs12596638 were genotyped using the Taqman assays C__34511379_10 and C__11776446_10 respectively (Applied Biosystems). 2ul PCR reactions were performed in 384 well plates using 10ng of DNA (dried), using 0.05 ul assay mix and 1ul Universal Master Mix (Applied Biosystems) according to the manufacturer’s instructions. End point reading of the genotypes was performed using an ABI 7900HT Real-time PCR system (Applied Biosystems).
Imputation
Imputation was conducted genome-wide on the GenoMEL Phase 1 samples, excluding SNPs with MAF<0.03, HWE p-value<10−4 (in controls) and missingness >0.03. IMPUTEv243,44 was used and the reference panel consisted of 120 European samples from HapMap release #24 (NCBI build36, Nov 2008). After the initial genome-wide imputation had identified the FTO region as a candidate region, further imputation of this region (1Mb either side of rs16953002, Chr16: 53,114,824–55,114,824) was conducted based on the 1000 Genomes Phase 1 integrated variant set (March 2012 release, excluding SNPs with MAF<0.001 in the CEU European samples). The number of well-imputed SNPs (INFO score>0.8) in the region increased from 1,245 to 4,874, although the most significant three SNPs remained the same. The first p-values quoted for rs16953002 and rs12596638 (p=5.59×10⁻⁶ and p=4.4310−6 respectively) were from the genome-wide imputation but all subsequent analyses are based on the FTO-regional imputation.
Imputed genotypes were analysed as expected genotype counts based on the posterior probabilities (gene dosage) using SNPTEST245 assuming an additive model with geographic region as a covariate. Only those with an ‘info’ score >0.8 are considered to be of sufficient quality. The FTO region was imputed and analysed in the GenoMEL Phase 2 data in the same way.
Imputation quality was confirmed by genotyping 3,694 of the previously-imputed samples from GenoMEL Phase 1 at rs16953002. The imputed genotype with the highest posterior probability was correct in 97% of cases (rising to 98% if we only consider those genotypes where the maximum posterior probability is >0.8). Given this strong confirmation of the quality of the imputation, unless otherwise stated we present the result using the imputed Phase 1 results, rather than interleaving imputed and genotyped data indiscriminately. In the Supplementary Material and Supplementary Table 2 results are presented using only genotyped data for comparison with the imputed results.
In the replication samples rs16953002 and rs8050136 were genotyped, with the exception of rs8050136 being imputed in the Harvard samples.
Meta-Analysis
Meta analyses assume fixed effects unless otherwise stated. In all cases heterogeneity between studies is measured with the I2 metric; it has been suggested that values below 31% are of “little concern” and those above 56% should induce “considerable caution”46. Where I2 is>31% a random effects meta-analysis is applied. Here, the method of Dersimonian and Laird47 was used to estimate the between-studies variance, τ̂2. An overall random effects estimate was then calculated using the weights 1/(vi + τ̂2) where vi is the variance of the estimated effect. τ̂2 = 0 for the fixed effects analyses.
Supplementary Material
Table 1.
Results of association between rs16953002 and melanoma and rs8050136 and melanoma
| rs16953002 and melanoma | rs8050136 and melanoma | ||||||
|---|---|---|---|---|---|---|---|
| MAF | No of cases/controls | OR (95% CI) | P | No of cases/controls | OR (95% CI) | P | |
| GenoMEL Phase 1 | 0.16 | 1,353 / 3,566 | 1.32 (1.17,1.50) | 1.3×10⁻⁵ | 1,353 / 3,566 | 1.09 (0.99,1.19) | 0.08 |
| All replicates | 0.17 | 12,314 / 55,667 | 1.14 (1.09,1.19) | 4.8×10⁻⁹ | 11,707 / 57,160 | 1.01 (0.98,1.05) | 0.45 |
| Overall | 0.17 | 13,667 / 59,233 | 1.16 (1.11,1.20) | 3.6×10⁻¹² | 13,060 / 60,726 | 1.03 (0.97,1.10) | 0.37 |
Acknowledgments
Thanks to Mark I. McCarthy and Cecilia M. Lindgren for assistance with the results of the GIANT study.
The GenoMEL study was funded by the European Commission under the 6th Framework Programme (contract no. LSHC-CT-2006-018702), by Cancer Research UK Programme Awards (C588/A4994 and C588/A10589), by a Cancer Research UK Project Grant (C8216/A6129) and by a grant from the Us National Institutes of Health (NIH; CA83115). This research was also supported by the intramural Research Program of the NIH, National Cancer Institute (NCI), Division of Cancer Epidemiology and Genetics.
This study makes use of data generated by the Wellcome Trust Case Control Consortium. A full list of the investigators who contributed to the generation of the data is available from their website (see URLs). Funding for the project was provided by the Wellcome Trust under award 076113
The authors thank the Epidemiological Study on the Genetics and Environment of Asthma (EGEA) cooperative group for giving access to data of the EGEA study. We acknowledge that the biological specimens of the French Familial Melanoma Study Group were obtained from the Institut Gustave Roussy and Fondation Jean Dausset–CEPH Biobanks.
Funding specific to particular centres is given below:
Stockholm: Swedish Cancer Society, Karolinska Institutet’s research funds
Lund: Funding to be acknowledged; Swedish Cancer Society, Gunnar Nilsson Foundation.
Genoa: Italian Ministry of Education, University and Research PRIN 2008, IMI and Mara Naum foundation.
Paris: Grants from Institut National du Cancer (INCa-PL016) and Ligue Nationale Contre Le Cancer (PRE05/FD and PRE 09/FD) to F. Demenais, Programme Hospitalier de Recherche Clinique (AOM-07-195) to M.-F. Avril and F. Demenais.
Leiden: Grant provided by European Biobanking and Biomolecular Resources Research Infrastructure (BBMRI) Netherlands hub (CO18).
Spain: The research at the Melanoma Unit in Barcelona is partially funded by Grants from Fondo de Investigaciones Sanitarias P.I. 09/01393, Spain; by the CIBER de Enfermedades Raras of the Instituto de Salud Carlos III, Spain; by the AGAUR 2009 SGR 1337 of the Catalan Government, Spain.
Norway: Grants from the Comprehensive Cancer Center, Oslo University Hospital (SE0728) and the Norwegian Cancer Society (71512-PR-2006-0356).
Vienna: Supported by the Jubiläumsfonds of the Österreichische Nationalbank (project numbers 12161 and 13036) and the Hans und Blanca Moser Stiftung.
Italy replication: The Italian study was partially supported by an RO1 grant CA65558-02 (to M. T. Landi) from the National Institutes of Health (NIH), Department of Health and Human Services (DHHS) and by the Intramural Research Program of NIH, National Cancer Institute, Division of Cancer Epidemiology and Genetics.
Houston (M.D. Anderson): Support by the NIH/NCI (2P50CA093459), and by the Marit Peterson Fund for Melanoma Research.
Footnotes
Author Contributions
MMI led, designed and carried out the statistical analysis and wrote the manuscript.
MHarland was involved in the Leeds replication genotyping design
JCT carried out statistical analysis
HS, JR-M, MJ, SM and NvdS carried out genotyping and contributed to the interpretation of genotyping data
BB contributed to the design of the GWAS and supervised processing of GWAS samples
JANB led the overall consortium and contributed to study design
NAG was deputy lead of the consortium and contributed to study design
DTB and JHB designed and led the overall study
NKH, SMcG and MHL led and carried out statistical analysis of the Australian replication data
KS, SNS, PS and GT led and carried out statistical analysis of the Icelandic, Dutch, Viennese, Milanese, Valencian and Zaragozan replication data
JH carried out statistical analysis of the Harvard replication data
CIA and SF led and carried out statistical analysis of the Houston replication data
MTL and RP led and carried out statistical analysis of the Italian replication data
DZ and GML interpreted and contributed genotype data
AMG PAK EMG FD advised on statistical analysis
KMB DEE contributed to the design of the GWAS
All other authors contributed to the design and sample collection of either the initial GWAS or one of the replication studies
References
- 1.Cannon-Albright LA, Bishop DT, Goldgar C, Skolnick MH. Genetic predisposition to cancer. Important Adv Oncol. 1991:39–55. [PubMed] [Google Scholar]
- 2.Naldi L, et al. Cutaneous malignant melanoma in women. Phenotypic characteristics, sun exposure, and hormonal factors: a case-control study from Italy. Ann Epidemiol. 2005;15:545–550. doi: 10.1016/j.annepidem.2004.10.005. [DOI] [PubMed] [Google Scholar]
- 3.Titus-Ernstoff L, et al. Pigmentary characteristics and moles in relation to melanoma risk. Int J Cancer. 2005;116:144–149. doi: 10.1002/ijc.21001. [DOI] [PubMed] [Google Scholar]
- 4.Holly EA, Aston DA, Cress RD, Ahn DK, Kristiansen JJ. Cutaneous melanoma in women. I Exposure to sunlight, ability to tan, and other risk factors related to ultraviolet light. Am J Epidemiol. 1995;141:923–933. doi: 10.1093/oxfordjournals.aje.a117359. [DOI] [PubMed] [Google Scholar]
- 5.Holly EA, Aston DA, Cress RD, Ahn DK, Kristiansen JJ. Cutaneous melanoma in women. II Phenotypic characteristics and other host-related factors. Am J Epidemiol. 1995;141:934–942. doi: 10.1093/oxfordjournals.aje.a117360. [DOI] [PubMed] [Google Scholar]
- 6.Bataille V, et al. Risk of cutaneous melanoma in relation to the numbers, types and sites of naevi: a case-control study. Br J Cancer. 1996;73:1605–1611. doi: 10.1038/bjc.1996.302. [DOI] [PMC free article] [PubMed] [Google Scholar]
- 7.Chang YM, et al. A pooled analysis of melanocytic nevus phenotype and the risk of cutaneous melanoma at different latitudes. Int J Cancer. 2009;124:420–428. doi: 10.1002/ijc.23869. [DOI] [PMC free article] [PubMed] [Google Scholar]
- 8.Brown KM, et al. Common sequence variants on 20q11.22 confer melanoma susceptibility. Nat Genet. 2008;40:838–840. doi: 10.1038/ng.163. [DOI] [PMC free article] [PubMed] [Google Scholar]
- 9.Bishop DT, et al. Genome-wide association study identifies three loci associated with melanoma risk. Nat Genet. 2009;41:920–925. doi: 10.1038/ng.411. [DOI] [PMC free article] [PubMed] [Google Scholar]
- 10.Guđbjartsson DF, et al. ASIP and TYR pigmentation variants associate with cutaneous melanoma and basal cell carcinoma. Nat Genet. 2008;40:886–891. doi: 10.1038/ng.161. [DOI] [PubMed] [Google Scholar]
- 11.Barrett JH, et al. Genome-wide association study identifies three new melanoma susceptibility loci. Nat Genet. 2011;43:1108–1113. doi: 10.1038/ng.959. [DOI] [PMC free article] [PubMed] [Google Scholar]
- 12.Bertolotto C, et al. A SUMOylation-defective MITF germline mutation predisposes to melanoma and renal carcinoma. Nature. 2011;480:94–98. doi: 10.1038/nature10539. [DOI] [PubMed] [Google Scholar]
- 13.Yokoyama S, et al. A novel recurrent mutation in MITF predisposes to familial and sporadic melanoma. Nature. 2011;480:99–103. doi: 10.1038/nature10630. [DOI] [PMC free article] [PubMed] [Google Scholar]
- 14.Frayling TM, et al. A common variant in the FTO gene is associated with body mass index and predisposes to childhood and adult obesity. Science. 2007;316:889–894. doi: 10.1126/science.1141634. [DOI] [PMC free article] [PubMed] [Google Scholar]
- 15.Dina C, et al. Variation in FTO contributes to childhood obesity and severe adult obesity. Nat Genet. 2007;39:724–726. doi: 10.1038/ng2048. [DOI] [PubMed] [Google Scholar]
- 16.Scuteri A, et al. Genome-wide association scan shows genetic variants in the FTO gene are associated with obesity-related traits. PLoS Genet. 2007;3:e115. doi: 10.1371/journal.pgen.0030115. [DOI] [PMC free article] [PubMed] [Google Scholar]
- 17.Zeggini E, et al. Replication of genome-wide association signals in UK samples reveals risk loci for type 2 diabetes. Science. 2007;316:1336–1341. doi: 10.1126/science.1142364. [DOI] [PMC free article] [PubMed] [Google Scholar]
- 18.Scott LJ, et al. A genome-wide association study of type 2 diabetes in Finns detects multiple susceptibility variants. Science. 2007;316:1341–1345. doi: 10.1126/science.1142382. [DOI] [PMC free article] [PubMed] [Google Scholar]
- 19.Wellcome Trust Case Control Consortium. Genome-wide association study of 14,000 cases of seven common diseases and 3,000 shared controls. Nature. 2007;447:661–678. doi: 10.1038/nature05911. [DOI] [PMC free article] [PubMed] [Google Scholar]
- 20.Zeggini E, et al. Meta-analysis of genome-wide association data and large-scale replication identifies additional susceptibility loci for type 2 diabetes. Nat Genet. 2008;40:638–645. doi: 10.1038/ng.120. [DOI] [PMC free article] [PubMed] [Google Scholar]
- 21.Voight BF, et al. Twelve type 2 diabetes susceptibility loci identified through large-scale association analysis. Nat Genet. 2010;42:579–589. doi: 10.1038/ng.609. [DOI] [PMC free article] [PubMed] [Google Scholar]
- 22.Hertel JK, et al. FTO, type 2 diabetes, and weight gain throughout adult life: a meta-analysis of 41,504 subjects from the Scandinavian HUNT, MDC, and MPP studies. Diabetes. 2011;60:1637–1644. doi: 10.2337/db10-1340. [DOI] [PMC free article] [PubMed] [Google Scholar]
- 23.Li H, et al. Association of genetic variation in FTO with risk of obesity and type 2 diabetes with data from 96,551 East and South Asians. Diabetologia. 2012;55:981–995. doi: 10.1007/s00125-011-2370-7. [DOI] [PMC free article] [PubMed] [Google Scholar]
- 24.Renehan AG, Tyson M, Egger M, Heller RF, Zwahlen M. Body-mass index and incidence of cancer: a systematic review and meta-analysis of prospective observational studies. Lancet. 2008;371:569–578. doi: 10.1016/S0140-6736(08)60269-X. [DOI] [PubMed] [Google Scholar]
- 25.Pothiawala S, Qureshi AA, Li Y, Han J. Obesity and the incidence of skin cancer in US Caucasians. Cancer Causes Control. 2012;23:717–726. doi: 10.1007/s10552-012-9941-x. [DOI] [PMC free article] [PubMed] [Google Scholar]
- 26.Speliotes EK, et al. Association analyses of 249,796 individuals reveal 18 new loci associated with body mass index. Nat Genet. 2010;42:937–948. doi: 10.1038/ng.686. [DOI] [PMC free article] [PubMed] [Google Scholar]
- 27.Sällman Almén M, et al. Determination of the obesity-associated gene variants within the entire FTO gene by ultra-deep targeted sequencing in obese and lean children. Int J Obes (Lond) 2012 doi: 10.1038/ijo.2012.57. in press. [DOI] [PMC free article] [PubMed] [Google Scholar]
- 28.Boissel S, et al. Loss-of-function mutation in the dioxygenase-encoding FTO gene causes severe growth retardation and multiple malformations. Am J Hum Genet. 2009;85:106–111. doi: 10.1016/j.ajhg.2009.06.002. [DOI] [PMC free article] [PubMed] [Google Scholar]
- 29.Hubacek JA, et al. The FTO gene polymorphism is associated with end-stage renal disease: two large independent case-control studies in a general population. Nephrol Dial Transplant. 2012;27:1030–1035. doi: 10.1093/ndt/gfr418. [DOI] [PMC free article] [PubMed] [Google Scholar]
- 30.Hubacek JA, et al. A FTO variant and risk of acute coronary syndrome. Clin Chim Acta. 2010;411:1069–1072. doi: 10.1016/j.cca.2010.03.037. [DOI] [PubMed] [Google Scholar]
- 31.Doney AS, et al. The FTO gene is associated with an atherogenic lipid profile and myocardial infarction in patients with type 2 diabetes: a Genetics of Diabetes Audit and Research Study in Tayside Scotland (Go-DARTS) study. Circ Cardiovasc Genet. 2009;2:255–259. doi: 10.1161/CIRCGENETICS.108.822320. [DOI] [PMC free article] [PubMed] [Google Scholar]
- 32.Zimmermann E, et al. Fatness-associated FTO gene variant increases mortality independent of fatness--in cohorts of Danish men. PLoS One. 2009;4:e4428. doi: 10.1371/journal.pone.0004428. [DOI] [PMC free article] [PubMed] [Google Scholar]
- 33.Keller L, et al. The obesity related gene, FTO, interacts with APOE, and is associated with Alzheimer’s disease risk: a prospective cohort study. J Alzheimers Dis. 2011;23:461–469. doi: 10.3233/JAD-2010-101068. [DOI] [PubMed] [Google Scholar]
- 34.arcOGEN Consortium and arcOGEN Collaborators. Identification of new susceptibility loci for osteoarthritis (arcOGEN): a genome-wide association study. Lancet. 2012;380:815–823. doi: 10.1016/S0140-6736(12)60681-3. [DOI] [PMC free article] [PubMed] [Google Scholar]
- 35.Brennan P, et al. Obesity and cancer: Mendelian randomization approach utilizing the FTO genotype. Int J Epidemiol. 2009;38:971–975. doi: 10.1093/ije/dyp162. [DOI] [PMC free article] [PubMed] [Google Scholar]
- 36.Lurie G, et al. The obesity-associated polymorphisms FTO rs9939609 and MC4R rs17782313 and endometrial cancer risk in non-Hispanic white women. PLoS One. 2011;6:e16756. doi: 10.1371/journal.pone.0016756. [DOI] [PMC free article] [PubMed] [Google Scholar]
- 37.Boyle AP, et al. Annotation of functional variation in personal genomes using RegulomeDB. Genome Res. 2012;22:1790–1797. doi: 10.1101/gr.137323.112. [DOI] [PMC free article] [PubMed] [Google Scholar]
- 38.Schaub MA, et al. Linking disease associations with regulatory information in the human genome. Genome Res. 2012;22:1748–1759. doi: 10.1101/gr.136127.111. [DOI] [PMC free article] [PubMed] [Google Scholar]
- 39.Pruim RJ, et al. LocusZoom: regional visualization of genome-wide association scan results. Bioinformatics. 2010;26:2336–2337. doi: 10.1093/bioinformatics/btq419. [DOI] [PMC free article] [PubMed] [Google Scholar]
- 40.Newton-Bishop JA, et al. Melanocytic nevi, nevus genes, and melanoma risk in a large case-control study in the United Kingdom. Cancer Epidemiol Biomarkers Prev. 2010;19:2043–2054. doi: 10.1158/1055-9965.EPI-10-0233. [DOI] [PMC free article] [PubMed] [Google Scholar]
- 41.Newton-Bishop JA, et al. Relationship between sun exposure and melanoma risk for tumours in different body sites in a large case-control study in a temperate climate. Eur J Cancer. 2011;47:732–741. doi: 10.1016/j.ejca.2010.10.008. [DOI] [PMC free article] [PubMed] [Google Scholar]
- 42.Barrett JH, et al. Investigation of interaction between N-acetyltransferase 2 and heterocyclic amines as potential risk factors for colorectal cancer. Carcinogenesis. 2003;24:275–282. doi: 10.1093/carcin/24.2.275. [DOI] [PubMed] [Google Scholar]
- 43.Marchini J, Howie B, Myers S, McVean G, Donnelly P. A new multipoint method for genome-wide association studies via imputation of genotypes. Nat Genet. 2007;39:906–913. doi: 10.1038/ng2088. [DOI] [PubMed] [Google Scholar]
- 44.Howie BN, Donnelly P, Marchini J. A flexible and accurate genotype imputation method for the next generation of genome-wide association studies. PLoS Genet. 2009;5:e1000529. doi: 10.1371/journal.pgen.1000529. [DOI] [PMC free article] [PubMed] [Google Scholar]
- 45.Marchini J, Howie B, Myers S, McVean G, Donnelly P. A new multipoint method for genome-wide association studies via imputation of genotypes. Nat Genet. 2007;39:906–913. doi: 10.1038/ng2088. [DOI] [PubMed] [Google Scholar]
- 46.Higgins JP, Thompson SG. Quantifying heterogeneity in a meta-analysis. Stat Med. 2002;21:1539–1558. doi: 10.1002/sim.1186. [DOI] [PubMed] [Google Scholar]
- 47.Dersimonian R, Laird N. Meta-analysis in clinical trials. Control Clin Trials. 1986;7:177–188. doi: 10.1016/0197-2456(86)90046-2. [DOI] [PubMed] [Google Scholar]
Associated Data
This section collects any data citations, data availability statements, or supplementary materials included in this article.