

Abstract
Although protective effects of the cochlea's efferent feedback pathways have been well documented, prior work has focused on hair cell damage and cochlear threshold elevation and, correspondingly, on the high sound pressure levels (>100 dB SPL) necessary to produce them. Here we explore the noise-induced loss of cochlear neurons that occurs with lower-intensity exposures and in the absence of permanent threshold shifts. Using confocal microscopy to count synapses between hair cells and cochlear nerve fibers, and using measurement of auditory brainstem responses and otoacoustic emissions to assess cochlear presynaptic and postsynaptic function, we compare the damage from a weeklong exposure to moderate-level noise (84 dB SPL) in mice with varying degrees of cochlear de-efferentation induced by surgical lesion to the olivocochlear pathway. Such exposure causes minimal acute threshold shifts and no chronic shifts in mice with normal efferent feedback. In de-efferented animals, there was up to 40% loss of cochlear nerve synapses and a corresponding decline in the amplitude of the auditory brainstem response. Quantitative analysis of the de-efferentation in inner versus outer hair cell areas suggested that outer hair cell efferents are the most important in minimizing this neuropathy, presumably by virtue of their sound-evoked feedback reduction of cochlear amplification. The moderate nature of this acoustic overexposure suggests that cochlear neurons are at risk even in everyday acoustic environments, so the need for cochlear protection is plausible as a driving force in the design of this feedback pathway.
Introduction
Overexposure to intense sound can damage or destroy cochlear sensory cells and thereby lead to permanent elevation of cochlear thresholds (Liberman and Dodds, 1984). Given the obvious importance of threshold sensitivity to auditory function, most research on noise-induced hearing loss has focused on hair cell damage and threshold shift as the key structural and functional metrics of the effects of noise. Recent studies, however, show degeneration of up to 50% of the cochlea's sensory neurons after noise exposures that have been adjusted in either level or duration so as to produce only transient threshold elevation and no loss of, or permanent damage to, the sensory cells (Kujawa and Liberman, 2009). This primary neuronal degeneration, which may be a type of glutamate excitotoxicity (Pujol et al., 1993; Pujol and Puel, 1999), appears within hours postexposure as a loss of synaptic terminals on the inner hair cells (IHCs; Robertson, 1983), which are normally innervated by 95% of the cochlea's sensory fibers (Spoendlin, 1972). Death of the neuronal somata, the spiral ganglion cells, is much slower, continuing for months to years postexposure (Liberman and Kiang, 1978; Kujawa and Liberman, 2009). This type of diffuse and subtotal neuronal loss does not elevate thresholds, but likely causes problems hearing in difficult (noisy) listening environments, a common audiological complaint (Kujawa and Liberman, 2009).
The discovery of a new metric of noise-induced cochlear damage, which has revealed deleterious effects of exposures that otherwise appear atraumatic, has led us to re-examine the role of the cochlear efferent system in protecting the ear from acoustic overexposure. Although many studies have shown that eliminating activity in this sound-evoked negative-feedback loop carried by the fibers of the olivocochlear (OC) bundle increases noise-induced threshold shifts (Kujawa and Liberman, 1997), such experiments involve exposure to sound pressure levels of 100–120 dB SPL for durations of 1–4 h. Because such continuous high-level exposures are rare in the absence of man-made devices, some have questioned the biological significance of this protective effect (Kirk and Smith, 2003), suggesting that it is an epiphenomenon that may be useful in the today's noisy world, but that it cannot represent the biological advantage that has driven the evolution of this feedback system.
The present experiments were designed to determine whether efferent feedback protects cochlear neurons from moderate-level sound exposures that are more common in the natural world. As a starting point, we chose a level, 84 dB SPL, that is well below those measured in the middle of a tree frog chorus (>90 dB SPL; Narins, 1982) and well below that of a bat echolocation call (∼100 dB SPL; Xie and Henson, 1998). The 84 dB level is also well within the federal guidelines for an 8 h/d exposure for a lifetime (http://www.osha.gov). Results show that normal mice exposed for 1 week to such a moderate-level noise with a spectrum targeting the most sensitive portion of the hearing range show no measureable permanent threshold shifts. However, confocal analysis of immunostained cochleas revealed a loss of up to 20% of the afferent synapses on IHCs in some cochlear regions. Surgical removal of efferent feedback doubles the synaptic degeneration such that up to 40% of the synapses are missing 2 weeks after the termination of the exposure. Comparison of lesions designed to selectively destroy either the lateral OC (LOC) neurons innervating the cochlear neurons or the medial OC (MOC) neurons innervating the outer hair cells (OHCs) suggests that the protection arises predominately from the MOC pathway.
Materials and Methods
Animals and groups.
Male mice of the CBA/CaJ strain entered the experimental protocol at 6–8 weeks of age and were assigned to 1 of 4 groups: (1) Control animals underwent no surgical procedure and no purposeful noise exposure, (2) Expose Only animals underwent no surgical procedure before the calibrated exposure to noise, (3) COCB Cut animals had the crossed OC bundle surgically transected 10 d before the noise exposure, and (4) LSO Injection animals had a neurotoxin (melittin) stereotaxically injected to target the lateral superior olive (LSO) on the right side (Le Prell et al., 2003) 1 week before the noise. For each animal in the Expose Only, COCB Cut, and LSO Lesion groups, cochlear function was assessed bilaterally via auditory brainstem responses (ABRs) and distortion product otoacoustic emissions (DPOAEs) both 4 d before and 10 d after the termination of the noise exposure. Immediately after the final cochlear function test, animals were fixed by intracardiac perfusion and both cochleas were removed for histological processing and subsequent confocal analysis of hair cell and synaptic degeneration. Final group sizes are given in the relevant figure captions.
Cochlear function tests.
For measuring cochlear function via ABRs and DPOAEs, animals were anesthetized with a ketamine/xylazine mixture and placed in an acoustically electrically shielded room maintained at 32°C. Acoustic stimuli were delivered through a custom EPL acoustic system consisting of two miniature dynamic earphones used as sound sources (CDMG15008–03A; CUI) and an electret condenser microphone (FG-23329-PO7; Knowles) coupled to a probe tube to measure sound pressure near the eardrum (for details, see http://www.masseyeandear.org/research/ent/eaton-peabody/epl-engineering-resources/epl-acoustic-system/). Digital stimulus generation and response processing were handled by digital I-O boards from National Instruments driven by custom software written in LabVIEW. For ABRs, stimuli were 5 ms tone pips (0.5 ms cos2 rise-fall) delivered in alternating polarity at 35/s. Electrical responses were sampled via Grass needle electrodes at the vertex and pinna with a ground reference near the tail and amplified 10,000× with a 0.3–3 kHz passband. Responses to as many as 1024 stimuli were averaged at each sound pressure level as the level was varied in 5 dB steps from below threshold up to 80 dB SPL. ABR thresholds were defined, by visual inspection of stacked waveforms, as the lowest SPL at which the wave morphology conformed to a consistent pattern (with peak latencies increasing systematically as SPL was reduced). For DPOAEs, stimuli were two primary tones, f1 and f2 (f2/f1 = 1.2), with the f1 level always 10 dB above the f2 level. Primaries were swept in 5 dB steps from 20–80 dB SPL (for f2). The DPOAE at 2f1-f2 was extracted from the ear canal sound pressure after both waveform and spectral averaging. The noise floor was defined as the average of 6 spectral points below and 6 above the 2f1-f2 point. Threshold was computed by interpolation as the primary level (f2) required to produce a DPOAE of 0 dB SPL.
Noise exposure.
Animals were exposed to an 8–16 kHz octave-band noise at 84 dB SPL for 1 week in specially modified mouse cages, with a CUI Miniature Dynamic earphone (15 mm diameter) mounted at either end of the cage near the top to prevent blockage from bedding or the mice themselves. SPLs were calibrated at the start and end of each 1 week exposure and levels varied by <1 dB at different points in the cage. Several cages were driven simultaneously and 2–4 mice were housed per cage to minimize acoustic shielding from clustering. Animals had free access to food and water throughout.
Brainstem lesions and histological verification.
For brainstem surgery, mice were anesthetized with a ketamine/xylazine mixture. COCB cuts were made with a microknife on the floor of the IVth ventricle after a posterior craniotomy and cerebellar elevation. For lesions of the LSO, the mouse was held in a stereotaxic apparatus with the scalp retracted. A micropipette filled with 10 mm melittin was lowered into the brain through an opening over the right lambdoidal suture at a position 0.49 mm caudal and 0.12 mm lateral to the bregma. At a depth of 0.69 mm, 0.2 μl of melittin was injected by a 1 μl of Hamilton syringe. Brainstems were fixed in 10% formalin, cryoprotected (30% sucrose), and cut on a freezing microtome at 40 μm in the transverse plane. Sections were treated histochemically to reveal acetylcholinesterase activity (Osen and Roth, 1969).
Cochlear processing and immunostaining.
Mice were perfused intracardially with 4% paraformaldehyde in phosphate buffer. Cochleas were decalcified, dissected into half-turns, and permeabilized by freeze/thawing. The half-turns were blocked in 5% normal horse serum with 1% Triton X-100 in PBS for 1 h, followed by incubation for ∼19 h at 37°C in primary antibodies diluted in 1% normal horse serum with 1% Triton X-100. Antibodies always included the following: mouse (IgG1) anti-C-terminal binding protein 2 (anti-CtBP2) from BD Biosciences at 1:200 and rabbit anti-vesicular acetylcholine transporter (anti-VAT) from Sigma at 1:1000 to allow quantification of presynaptic ribbons in the IHCs and cochlear efferent terminals, respectively. To quantify postsynaptic elements in the IHC area, we used either chicken anti-NF-H from Millipore at 1:1000 or mouse (IgG2) anti-GluA2 from Millipore at 1:2000. Primary incubations were followed by two sequential 60 min incubations at 37°C in species-appropriate secondary antibodies with 1% Triton X-100.
Cochlear histological analysis.
Two types of information were extracted from both the inner and OHC areas in each cochlea: counts of afferent ribbon synapses and quantification of the degree of de-efferentation. Both analyses were based on high-power confocal z-stacks obtained at half-octave intervals along the cochlear spiral (i.e., at 5.6, 8.0, 11.3, 16.0, 22.6, 32.0, 45.3, and 64 kHz). To identify regions of interest accurately, cochlear lengths were obtained for each case by tracing the spiral in low-power images of the dissected epithelial whole mounts using a custom ImageJ plugin (http://www.masseyeandear.org/research/ent/eaton-peabody/epl-histology-resources/) that translates cochlear position into frequency according to the published map for the mouse (Muller et al., 2005). Confocal z-stacks were obtained at specified cochlear frequency regions with a glycerol-immersion objective (63×, numerical aperture 1.3) at 3.17× digital zoom on a Leica TCS SP5. Image spacing in the z plane was set to 0.25 μm and the z span was carefully adjusted for each stack to include all synaptic elements in all of the 8–12 hair cells from each row included in each stack, typically requiring 75–100 images per stack. Two adjacent stacks were always obtained in each cochlear region sampled.
Synaptic counts.
Presynaptic ribbons and postsynaptic glutamate receptor patches were counted from the confocal z-stacks using the connected components tool in Amira software (Visage Imaging), which finds and displays each voxel space in an image stack containing exclusively pixel values greater than a user-set criterion. By comparing the connected components display with the maximum projection, the user can adjust the criterion to capture all elements of interest. Because the analysis is done in 3-D, the result separates accurately elements superimposed in z. To assess quantitatively the pairing of presynaptic and postsynaptic elements, we used custom software that extracts the voxel space within 1 μm around each ribbon (or receptor patch) and produces a thumbnail array of these miniature projections that can be easily scanned to count synapses (i.e., ribbons with closely apposed receptor patches) versus orphan ribbons or orphan receptor patches (Liberman et al., 2011). Synaptic counts were always expressed on a per hair cell basis. Hair cells in each stack were counted by increasing the image output-gain (gamma adjust): IHC nuclei stain faintly with the CtBP2 antibody and the OHC somata are visible via their faint background label in several confocal channels, as well as by the presence of synaptic ribbons, even when the efferent terminals are missing.
Degree of de-efferentation.
The degree of de-efferentation was assessed in both IHC and OHC areas from maximum projections of the VAT immunostaining in the z-stacks. In the OHC area, the total number of VAT-positive terminals was counted in each stack and divided by the number of hair cells (∼10 OHCs in each of the three rows). In the IHC area, because the terminals are smaller and more numerous, accurate counting is difficult. Therefore, a semiquantitative analysis was performed with a 4 point scale, with 3 = profuse, 2 = moderate, 1= sparse, and 0 = none (Darrow et al., 2007).
Results
OC lesions and their assessment
The OC pathway consists of two major divisions (Warr and Guinan, 1979), each of which has been implicated in the control of cochlear noise damage (Maison and Liberman, 2000; Darrow et al., 2007). The MOC pathway originates bilaterally from cell bodies in the ventral nucleus of the trapezoid body (Fig. 1A) and projects via myelinated axons to the OHCs (Fig. 1B), where release of acetylcholine decreases their normal contribution to cochlear mechanical amplification (for review see Guinan, 2006). The LOC pathway originates from cell bodies in the ipsilateral LSO (Fig. 1A) and projects via unmyelinated axons to synapse on the unmyelinated terminals of cochlear neurons (Fig. 1B) near their afferent synapses with the IHCs.
Figure 1.

Schematics illustrating the brainstem origins (A) and peripheral targets (B) of LOC and MOC efferent pathways to the cochlea. A, Schematic cross-section through the mouse brainstem showing the LSO, where the LOC cell bodies arise, and the COCB, made up largely of MOC fibers projecting to the opposite ear. B, Schematic cross-section through the organ of Corti showing the synaptic contacts of LOC terminals and the dendrites of cochlear nerve (afferent) fibers in the IHC area and the MOC terminals on OHCs.
To parse the contributions of MOC versus LOC pathways to the control of noise-induced cochlear neuropathy, we produced two kinds of brainstem lesions: (1) cutting the COCB (Fig. 2L) and (2) destroying one LSO by stereotaxic injection (Fig. 2I). Cutting the COCB where it passes near the dorsal surface of the brainstem at the floor of the IVth ventricle (Fig. 1A, Fig. 2J) should remove 75–80% of the MOC innervation to both ears, leaving the LOC system intact, because in the mouse, almost all of the LOC projections and only 20–25% of MOC projections to each ear arise ipsilaterally (Brown, 1993) and therefore survive a midline transection. By the same logic, destroying one LSO by unilateral neurotoxin injection can selectively destroy only the LOC to the ipsilateral ear, leaving the MOC system intact bilaterally.
Figure 2.

The success of de-efferentation was assessed by analysis of the organ of Corti (A–F) and the brainstem (G–L), which were stained for cholinergic markers. A–F, Maximum projections of confocal z-stacks of the organ of Corti viewed from the endolymphatic surface and immunostained for a cholinergic marker (VAT) in the red channel, and a synaptic ribbon marker (CtBP2) in green. A–C each show ∼10 adjacent IHCs with their unstained nuclei shown by dashed circles: A is a Control, B illustrates near-complete loss of LOC terminals after a successful LSO Lesion, and C shows near-complete sparing of LOC terminals after a successful COCB Cut. The OHCs are outside of the field of view toward the top of the images. D–F each show ∼12 OHCs from each row from the same cochlear region and the same case shown in the paired image to the left. D is a Control, where as many as 4 MOC terminals cluster under a single OHC (arrows). E shows survival of MOC terminals after a successful LSO Lesion. F shows loss of MOC terminals after a successful COCB Cut. The regular array of synaptic ribbons (arrows) shows that the OHCs are still present. Scale bar in F applies to all panels. G–K, Brainstem sections through the left (G,H) and right (J,K) superior olivary complexes stained for acetylcholinesterase to show the cell bodies of LOC and MOC neurons 6 weeks after neurotoxin injection into the right LSO in one case (G,H) or a COCB cut in another (J,K). Postsurgery survival was 6 weeks in all cases. The schematic below each pair of images (G,J) summarizes which OC projections remain in each case.
In this study, we assessed the success of de-efferentation in two ways: (1) qualitatively, by analysis of brainstem sections histochemically stained for acetylcholinesterase to reveal the cholinergic somata of LOC and MOC neurons (Fig. 2G–K), and (2) quantitatively, by analysis of cochleas immunostained for another cholinergic marker, VAT, to quantify the distributions of MOC and LOC terminals in the OHC (Fig. 2D–F) and IHC (Fig. 2A–C) areas, respectively. When viewed as epithelial whole mounts (i.e., orthogonal to the section plane schematized in Fig. 1B), VAT-positive OC terminals in a control ear are clearly visible in both the IHC (Fig. 2A) and OHC (Fig. 2D) areas. In the OHC area, the terminals are large and discrete enough to be unambiguously counted: the number of terminals per OHC is clearly reduced by a successful COCB cut (Fig. 2F). In the IHC area, the terminals are too small to count, but a successful LOC lesion can clearly eliminate virtually all of the VAT-positive puncta from the inner spiral bundle (Fig. 2B), where the LOC terminals normally intermingle with the unmyelinated dendrites of cochlear neurons near their IHC synapses, marked by the CtBP2-positive puncta (Fig. 2A–C, green symbols). The semiquantitative analysis of the LOC innervation used here was adopted from a prior study (Darrow et al., 2007); further details are provided in the Materials and Methods.
The cochlear de-efferentation analysis suggested that a successful COCB cut removes ∼80% of the MOC terminals to both ears (Fig. 3A), as predicted by the published anatomy in mouse (Brown, 1993). It also appears that the LSO injections damaged both MOC and LOC cells (Fig. 3A, purple symbols) in the majority of cases and selectively damaged the LOC system in only two cases (Fig. 3A, blue symbols). The quantitative conclusions from the cochlear analysis were consistent with those drawn more qualitatively from the brainstem sections. For example, note the clear reduction in MOC cells adjacent to the LSO injection in Figure 2H compared with the control side in Figure 2G. Similarly, note the bilateral loss of MOC cells (and the bilateral sparing of LOC cells) in the COCB cut case (Fig. 2J,K) compared with the control side of the LSO lesion case (Fig. 2G). After the LSO injections that also hit the MOC cell group, the loss of MOC cells was, on average, greater on the contralateral side than on the ipsilateral side (Fig. 3B), which is also consistent with the known anatomy (Fig. 1A).
Figure 3.

Quantification of MOC and LOC de-efferentation. A, In each case, two confocal z-stacks similar to those in Figure 2 were obtained from each of eight cochlear regions evenly spaced from the apex to the base of the spiral. Techniques for estimating the loss of MOC and LOC terminals in each stack are described in the Materials and Methods. Values for each ear represent the average of all stacks from all cochlear regions. For Controls (n = 6 ears from 3 cases), Expose Only (n = 6 ears from 3 cases), and COCB Cut (MOC lesion) cases (n = 8 ears from 4 cases), data are also averaged across both ears. For the unilateral LSO injections, only the data for the ipsilateral ear are shown. The LSO injection cases are segregated into two groups: 2 ears (from 2 cases) with “pure” LOC lesions, and the remaining 30 ears (from 15 cases) with combined LOC/MOC lesions. Data for MOC terminals are normalized with respect to Control animals. Data for LOC terminals are normalized by comparison between the two ears of one case. B, Mean survival ± SEM of MOC terminals as a function of cochlear location for each of the groups in A, with the LOC-MOC lesion group further divided to separately show the ears ipsilateral versus contralateral to the lesion (see key).
Noise-induced cochlear dysfunction with and without OC feedback
To help differentiate presynaptic and postsynaptic dysfunction in the cochlear periphery, we measured cochlear function in two ways: DPOAEs and ABRs. DPOAEs are sounds created by electrical distortions in the normal sensory epithelium that are reverse-transduced into mechanical motion, amplified by OHC “motors” (Liberman et al., 2004), and then reverse-propagated back to the eardrum, where they radiate into the ear canal as sound pressure that can be measured with a sensitive microphone. Normal DPOAEs do not require normal IHC function or a normal cochlear nerve (Takeno et al., 1994). The earliest wave of the ABR (wave 1) represents the synchronous sound-evoked spike activity in the cochlear nerve. When response diminutions in DPOAE and ABR are matched, problems likely arise from OHC dysfunction, whereas ABR anomalies in the presence of normal DPOAEs suggest the presence of cochlear neuropathy in the absence of OHC damage (Mills, 2003; Kujawa and Liberman, 2009).
In ears with a normal OC innervation (Fig. 4A, Expose Only), exposure to the 1 week 84 dB SPL noise produced only a small threshold shift (<15 dB) when measured immediately (within 1 h) after removal from the noise. This shift recovered so quickly that we tracked it only with DPOAEs, which can be acquired in ∼1/10 the time. When measured 1 week postexposure, all cochlear thresholds had returned to normal whether measured by ABRs (Fig. 4E) or DPOAEs (Fig. 4A). In contrast, in ears with a successful COCB cut (i.e., with loss of up to 80% of the MOC terminals on OHCs; Fig. 3A), there was permanent threshold shift approaching 20 dB at the high frequencies via both DPOAEs (Fig. 4B) and ABRs (Fig. 4F), suggesting the presence of minor OHC damage. Indeed, hair cell counts reveal scattered loss of OHCs in the MOC Lesion cases, but not in the Expose Only cases (Fig. 5). Among the LSO injection cases, the ipsilateral ears showed essentially complete threshold recovery, including those with selective LOC lesion (Fig. 4C,G). The persistent, high-frequency loss in the ears contralateral to LSO Injections matches the loss in the COCB Cut ears and strongly suggests that it is the crossed MOC projection that provides the protective effect against the OHC damage suggested here. Statistical analysis (by two-way ANOVA) confirmed that, of all of the pairwise preexposure versus postexposure comparisons, the only groups showing significant (p <0.05) shifts were those with MOC lesions (p = 0.002 for DPOAE and p = 0.007 for ABR) and those contralateral to the LSO injection with a combined LOC-MOC lesion (p = 0.002 for DPOAE and p <0.001 for ABR).
Figure 4.

Noise-induced threshold shifts as seen via either DPOAE (A–D) or ABR (E–H). Animals are grouped as defined in Figure 3. A, E, Animals exposed without prior de-efferentation surgery show small temporary threshold shifts when measured immediately (<1 h) after exposure (gray circles, A only). However, 1 week later, thresholds have recovered, as measured by either DPOAEs (A) or ABRs (E). Pre-exposure and 1 week postexposure measures are from 10 ears (5 cases); the 1 h postexposure measures are from 6 ears (3 cases). B, F, Animals exposed after successful COCB cuts show moderate permanent threshold shifts 1 week postexposure (n = 8 ears from 4 cases) as measured via DPOAEs (B) or ABRs (F). For C, G and D, H, animals exposed after successful LSO injections show moderate permanent threshold shifts 1 week postexposure, but only in the ear contralateral to the lesion (D,H). Pre-exposure and 1 week postexposure measures are means from 17 animals, averaged separately by ear, and segregated into two groups (LOC only vs LOC and MOC) as described in Figure 3. For each panel, shifts are computed mean thresholds for the pre-exposure data from that group. Error bars indicate ± SEM in all panels.
Figure 5.

Hair cell loss after noise exposure was restricted to the OHCs in the basal end of the cochlea and only in cases with loss of OHC efferent innervation. Mean OHC survival ± SEM is plotted as a function of cochlear location for all ears of the groups from Figure 4A,E. There was no IHC loss in any of the cases.
Prior mouse studies on cochlear effects of high-level noise (Kujawa and Liberman, 2009) noted that neither DPOAE nor ABR thresholds are sensitive to diffuse degeneration of the cochlear nerve, but suggested that such neuropathy could be revealed in the suprathreshold amplitudes of ABR wave 1 (Fig. 6E, inset). Because each synchronized neuron contributes equally to the electrical field potential, the mean decrease in ABR amplitudes should parallel the mean loss of cochlear nerve fibers so long as the function of the OHC “cochlear amplifier” is unaltered.
Figure 6.

Suprathreshold response amplitude for ABR wave 1 (E–H) is reduced at many frequencies for which DPOAEs (A–D) recover. Experimental groups are defined in Figure 3; group sizes are given in Figure 4. For DPOAEs (A–D), response amplitudes are averaged for primary levels from 60 to 80 dB SPL and then normalized to pre-exposure means for each group: negative values indicate that postexposure amplitudes were smaller than pre-exposure amplitudes. For ABRs (E–H), wave 1 amplitudes for 60–80 dB tone pips were averaged for each group at each test frequency and then normalized to pre-exposure means for the same group. Error bars indicate ± SEM in all panels. E, inset shows mean ABR waveforms (8 kHz, 80 dB SPL) before (green) versuss 1 week after (black) noise exposure: Wave 1 amplitude is indicated for the pre-exposure curve.
The data shown in Figure 6 (i.e., normalized suprathreshold amplitudes as a function of stimulus frequency) suggest that the 1 week exposure causes modest neuropathy in the normal ear, which is significantly exacerbated in the absence of MOC feedback. In the normal ear (Expose Only), the recovery of DPOAE suprathreshold amplitudes (Fig. 6A) and threshold responses (Fig. 4A) suggests full recovery of OHC function throughout the ear's dynamic range. In contrast, the decrease in wave 1 amplitudes suggest a neural loss of up to 25%, especially at the apical and basal ends of the cochlea (Fig. 6E). After loss of the MOC system (COCB Cut), the decline in neural responses grew to 60% and remained most striking in the apical and basal extremes (Fig. 6F). The diminution in OHC function at high frequencies (Fig. 4B, Fig. 5B) makes the high-frequency neural data harder to interpret, but the wave 1 amplitude decrements at low frequencies (Fig. 6F) strongly suggest primary neuropathy. The results from the LSO Injections also implicate the MOC system, because there was no wave 1 decline when the LOC projection was destroyed (Fig. 6C,G), but large declines were seen contralateral to the injection (Fig. 6D,H), where MOC degeneration is the greatest (Fig. 2I). Statistical analysis (by two-way ANOVA) confirmed that, of all the pairwise pre-exposure versus postexposure comparisons of suprathreshold amplitudes in lesion ears, ABR differences were significant only in the groups with MOC lesions or combined MOC-LOC lesions.
Noise-induced cochlear neuropathy with versus without OC feedback
To assess the loss of cochlear-nerve synapses, we concentrated on the IHC area because 95% of cochlear neurons (i.e., the type I neurons) make synaptic contact exclusively with IHCs (Spoendlin, 1972). As schematized in Figure 7F, each type I neuron contacts a single IHC via a single terminal bouton. At this synaptic contact, ultrastructural studies typically show one discrete patch of closely apposed presynaptic and postsynaptic membrane specialization and one presynaptic ribbon, an electron-dense body within the IHC surrounded by a halo of synaptic vesicles (Liberman, 1980).
Figure 7.
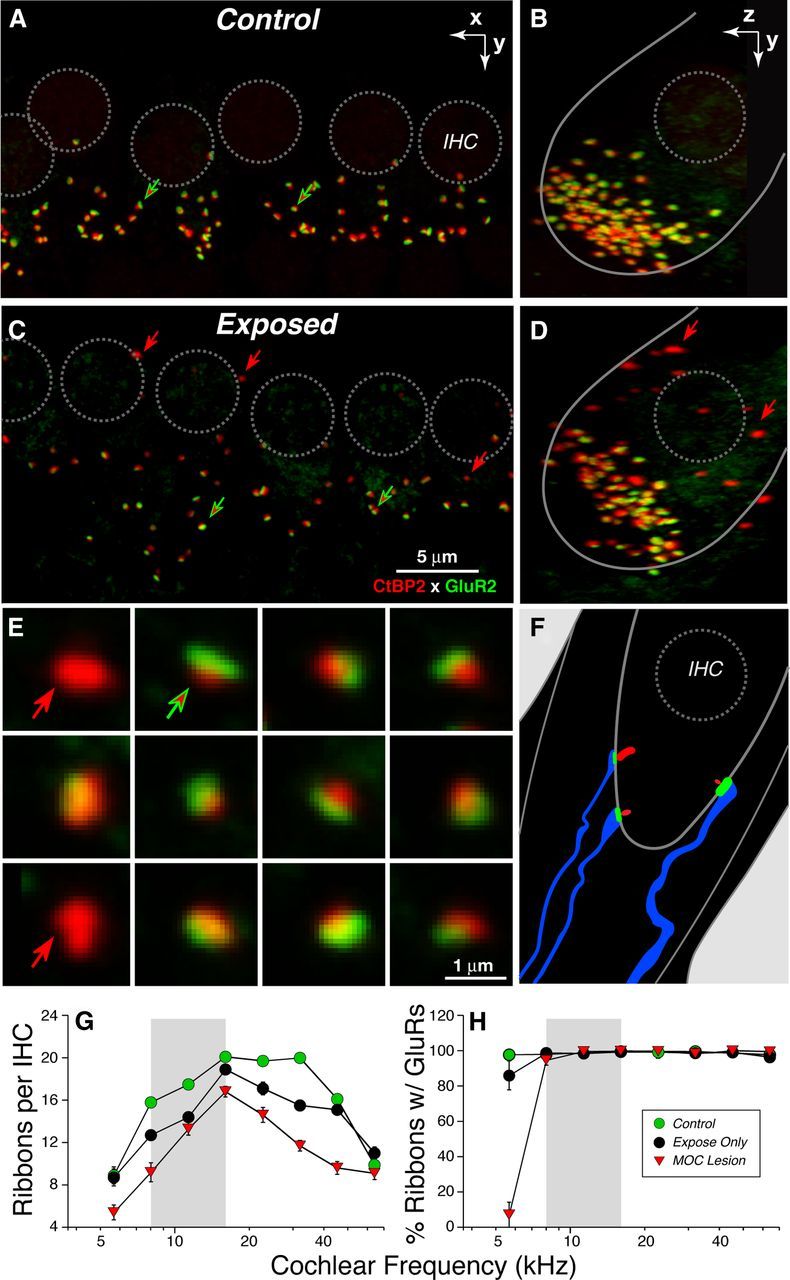
Confocal analysis shows noise-induced loss of IHC afferent synapses. A–D, Maximum projections from image stacks of the organ of Corti immunostained for a presynaptic marker (CtBP2: red) and a postsynaptic marker (GluR2: green). A and C show surface views of 5–6 adjacent IHCs from the 8 kHz region in a control (A) and an exposed (B) case: positions of IHC nuclei are shown by dashed circles. In the control ear, virtually all synaptic ribbons are paired with a glutamate receptor patch (red-fill green arrows); in exposed ears, there are a few orphan ribbons (red arrows in C). B and D display each image stack in yz projection to show that unpaired ribbons are far from the IHC's basal pole (red arrows in D). Scale bar in C applies to A–D. E, To quantify juxtaposition of presynaptic and postsynaptic elements, custom software creates an array of thumbnails, each displaying the voxel space 1 μm around each ribbon. From such arrays, orphan ribbons (red arrows) can be distinguished from complete synapses (red-fill green arrows). F, Schematic of the IHC synaptic region oriented similarly to the yz projections (B, D). G, Mean ribbon counts ± SEM from 8 cochlear locations in each ear show the noise-induced loss of synapses and its exacerbation after cutting the COCB. Group sizes were as follows: Control, 6 ears from 3 cases; Expose Only, 18 ears from 9 cases; and MOC Lesion, 8 ears from 4 cases. H, Analysis of ribbon-based thumbnail arrays (as in E) shows that, outside of the most apical cochlear regions, virtually all ribbons are part of a synaptic complex in both unexposed and exposed ears.
To quantify these afferent synapses in the confocal microscope, we use antibodies against CtBP2, a major constituent of the presynaptic ribbon (Khimich et al., 2005), and one of the AMPA-type glutamate receptors (GluA2), which is expressed in the postsynaptic terminal (Matsubara et al., 1996). When viewed in the confocal microscope in whole-mount preparations of the organ of Corti, each cochlear nerve/IHC synapse appears as a juxtaposed pair of CtBP2/GluA2 puncta (Fig. 7A, arrows) clustered in the subnuclear zone of the IHCs (Fig. 7A,B). Counts in control (unexposed) ears show from 10–20 ribbons per IHC, depending on cochlear frequency/location (Fig. 7G). To quantify accurately the juxtaposition between ribbons and receptors, we used custom software (Liberman et al., 2011) that redisplays the 3-D voxel space immediately around each identified ribbon and creates a montage of thumbnails like those shown in Figure 6E, which is easily scanned to identify ribbon/receptor pairs (red-filled green arrows) as well as orphan ribbons (red arrows). Such analyses show that, in control ears, almost every ribbon is paired with a glutamate receptor patch (Fig. 7H). Similarly, almost every glutamate receptor patch is paired with a presynaptic ribbon (data not shown).
In exposed ears, there were fewer ribbons per IHC (Fig. 7C,D), and orphan ribbons were slightly more common (Fig. 7C–E, red arrows), especially in the perinuclear region, where synapses are absent in unexposed ears (Fig. 7B,D). Ribbon counts in exposed ears suggest a synaptopathy throughout large parts of the cochlear spiral (Fig. 7G). This pathology is clearly exacerbated by cutting the COCB and thereby removing MOC feedback (Fig. 7G). Analysis of the juxtaposition between presynaptic and postsynaptic elements suggests that, even in exposed ears, ribbon counts are a good proxy for synaptic counts, except in the apical-most cochlear regions, where there are numerous orphan ribbons (and ribbon counts must underestimate the degree of neuropathy).
The magnitude and cochlear distribution of noise-induced neuropathy in our experimental groups is best seen by normalizing the ribbon counts to place-matched values from unexposed controls (Fig. 8). Synaptic loss in the Expose Only group peaked at ∼20% near the 8 and 32 kHz regions (Fig. 8A). This pattern of synaptic loss is not related in any simple fashion to the MOC innervation density in control ears, which peaked (at 2.8 terminals/OHC) at 16 kHz and decreased monotonically to values half of that at 5.6 kHz (1.2 terminals/OHC) and 64 kHz (1.4 terminals/OHC). The loss in the COCB Cut cases showed the same pattern across the cochlear spiral, but the magnitude of the mean loss was doubled to ∼40% at 8 and 32 kHz. The LSO Injection cases showed patterns reminiscent of the ABR data (Fig. 6): the neuropathy was generally no worse after LOC destruction (Fig. 8C, blue triangles), but was exacerbated when the MOC was involved, especially on the side contralateral to the injection (Fig. 7D, purple diamonds), where the largest MOC denervation is seen (Fig. 3B). Removing both MOC and LOC projections without purposeful noise exposure caused minimal synaptopathy: an average 10% loss when evaluated 4 weeks after the surgery (data not shown).
Figure 8.

IHC synaptic ribbon loss is maximal in ears with significant MOC lesions. Experimental groups (A, Expose only; B, COCB cut; C, LSO Injection—Ipsilateral side; D, LSO injection—Contralateral side) are defined in Figure 3A; group means ± SEM are shown. Ribbons were counted in 8 cochlear locations (from ∼20 adjacent IHCs in each location) in each case. Data for each group are normalized with respect to age-matched, unexposed Controls (n = 6 ears from 3 cases). The Expose Only group included 18 ears from 9 cases. Other group sizes are given in Figure 3A: note that there are only two cases in the LOC lesion group.
The analyses shown in Figure 6 and Figure 8 are based on animal groups defined using de-efferentation metrics that were averaged across the entire cochlear spiral (Fig. 3). This pan-cochlear average must introduce error if the degree of de-efferentation differs with cochlear location in each case. To minimize that error, we also analyzed the data in a regionally discrete way by plotting, for each of the eight cochlear regions analyzed, the degree of de-efferentation versus the degree of noise-induced neuropathy (Fig. 9). The data from 2 of the most highly affected regions, 8 and 45 kHz, showed a clear correlation between the two values and further underscored the conclusion that the MOC system is more important in minimizing neuropathy than the LOC system.
Figure 9.

The loss of IHC synapses is correlated with the loss of MOC innervation, in both the 8 kHz region (A) and the 45 kHz region (B), the apical and basal extremes where the neuropathy is greatest (Fig. 8). Large symbols are for group means; small symbols are for individual animals. Error bars indicate ± SEM. The percentage survival of MOC terminals is computed as described for Figure 3; the percentage survival of IHC synapses is computed as described for Figure 8. Dashed lines represent best fits to the scatterplots: slopes and y intercepts (x = 0) are 1.34 and −49.68, respectively, for A and 1.04 and −16.18, respectively, for B.
Discussion
Primary neuronal degeneration and cochlear threshold recovery
Acoustic overexposure can damage many structures of the middle and inner ear if exposure levels are high enough and exposure durations are long enough; however, the cochlear hair cells appear to be among the most vulnerable cells in the auditory periphery (Liberman and Kiang, 1978). Within minutes after an exposure severe enough to cause permanent threshold elevations, the hair cells are swollen (Wang et al., 2002), within hours they can disappear, and within days, the gaps they leave in the sensory epithelium (Bohne and Rabbitt, 1983) are resealed by the surrounding supporting cells of the organ of Corti. This rapid hair cell degeneration can occur initially without loss of any other cochlear cell type. In contrast, the time course of neuronal degeneration appears to be slower. The peripheral myelinated axons of cochlear nerve fibers begin to disappear no sooner than 1–2 weeks postexposure, and loss of their cell bodies in the spiral ganglion is not noticeable for at least 1 month (Liberman and Kiang, 1978). This stark difference in degenerative time course has led to the view that hair cell loss is the primary event in the ear's response to noise and that neural degeneration only occurs secondarily to the loss of hair cells, presumably due to loss of neurotrophic support.
Recent work has challenged this view. Within 24 h after acoustic overexposure, there can be a 40–50% loss of cochlear nerve synapses on surviving hair cells (Kujawa and Liberman, 2009). This permanent neuropathy, which appears to be a type of glutamate excitotoxicity (Pujol et al., 1993; Pujol and Puel, 1999), went unnoticed for many years because: (1) the degenerating terminals are unmyelinated and therefore impossible to see in routine light-microscopic analysis, (2) the subsequent degeneration of the (more easily visible) myelinated axons and cell bodies takes months to years, and (3) this neuropathy can occur despite complete recovery of cochlear thresholds, as measured by either ABRs or OAEs.
How can there be 40–50% loss of cochlear nerve fibers without significant threshold elevation of the ABR, which reflects the summed activity of neurons in the ascending auditory pathway starting with the cochlear nerve? One simple hypothesis is that the noise-induced degeneration is selective for that subset of cochlear neurons (40% of the total population) that normally has high thresholds and low spontaneous rates (SRs; Liberman, 1978). Single-fiber recordings in noise-exposed guinea pigs suggest that this is indeed the case (Lin et al., 2011a). Although ABR thresholds are unaffected, the neuropathy is revealed in the attenuation of ABR amplitudes at high stimulus levels, where low-SR fibers normally begin to contribute to the summed response.
Prior work on this type of primary neural degeneration (Kujawa and Liberman, 2009; Lin et al., 2011b) used noise exposures at high intensities (100–106 dB SPL) and short durations (2 h). The present study focused on a much lower level (84 dB SPL) and longer duration (1 week). The results clearly show that exposures more like those in everyday environments are also neuropathic (Fig. 8A), even when the gain-control feedback via the OC efferent system is intact. Although there may be interspecies differences in vulnerability between mice and humans, if an 84 dB exposure causing only a mild (15 dB) and transient threshold shif, can cause irreversible cochlear synaptopathy, then many common workplace and leisure exposures to noise are likely more dangerous to hearing health than current federal guidelines indicate.
Primary neuronal degeneration and OC-mediated protection
The MOC neurons constitute a sound-evoked negative feedback loop (Guinan, 2006). As the sound level increases, the MOC firing rate increases (Liberman and Brown, 1986). This feedback suppresses the normal contribution of OHCs to amplification of sound-induced motion in the sensory epithelium (Wiederhold and Kiang, 1970), which effectively decreases the intensity of the stimulus. Despite clear descriptions of the suppressive effects of MOC activation on everything from cochlear mechanics (Cooper and Guinan, 2006) to cochlear nerve response (Guinan and Stankovic, 1996), its functional significance remains controversial. Is it designed to protect the ear from acoustic injury (Rajan, 1988), to improve signal detection in a noisy environment (Winslow and Sachs, 1987), or to mediate selective attention (Scharf et al., 1994)?
The cochlear effects of activating the LOC system are less well characterized because their axons are unmyelinated and difficult to stimulate electrically in a direct fashion (Gifford and Guinan, 1987). Indirect activation via stimulation of the inferior colliculus suggests that the LOC system can slowly modulate the overall excitability of cochlear neurons to acoustic stimulation (Groff and Liberman, 2003). Although it has been suggested that this modulation is important in the interaural balancing of cochlear nerve activity that is necessary for accurate sound localization (Darrow et al., 2006a), other studies have suggested that the LOC feedback is also important in protecting the ear from acoustic injury (Ruel et al., 2001). One line of evidence for LOC-mediated protection is indirect: immunohistochemical evidence for dopaminergic transmission in one subgroup of LOC fibers (Darrow et al., 2006b) coupled with pharmacological evidence that cochlear perfusion of dopaminergic antagonists elicits the type of cochlear-nerve terminal swelling that is also elicited by noise (Ruel et al., 2001). A second line of evidence is the increased cochlear threshold shifts seen after selective LOC lesions, but that study did not specifically investigate synaptopathy in the IHC area (Darrow et al., 2007).
In the present study, enhanced neural degeneration was seen only in ears with significant MOC lesions—either bilaterally after cutting the OC bundle at the midline, which eliminates much of the MOC innervation to both ears without affecting the LOC system, or contralateral to focal lesions of the olivary complex, which involved both the LOC and MOC systems. The clear contralateral bias to the olivary lesion affects provides strong evidence that the primary effect there is due to the MOC system, not the LOC, given that the LOC projection is overwhelming ipsilateral and the MOC projection is predominately contralateral (Guinan et al., 1983). The contralateral bias also provides strong evidence that the effect does not arise from interruption of the middle ear muscle reflex, which is also driven from nearby brainstem structures with projections that are exclusively ipsilateral (Vacher et al., 1989).
OC-mediated protection: epiphenomenon or design feature?
Although MOC protective effects are well documented, prior work used cochlear threshold shift as the metric of noise-induced damage (Rajan, 1988; Kujawa and Liberman, 1997), and high-level exposures (greater than ∼105 dB SPL) are required to produce the permanent hair cell damage that underlies these shifts (Kujawa and Liberman, 1997). Therefore, MOC protection, although possibly important in our noisy, industrialized society, is arguably an epiphenomenon that could not have driven the evolutionary development of this feedback system (Kirk and Smith, 2003) that is present in all vertebrate hair cell systems (Guinan, 2006).
In the present study, we show that OC feedback also protects the ear from noise-induced cochlear neuropathy, which can be elicited at much lower sound pressures: the 84 dB stimulus we used is a lower intensity than that which is created by vocalizations in many natural environments (Narins, 1982; Xie and Henson, 1998). This moderate-level, long-duration exposure was designed as a step toward the most interesting, but practically more difficult, question of whether cochlear neurons cannot survive years of routine use without the gain control supplied by OC feedback. Chronic self-stimulation by vocalization may present a significant damage risk to the ear without protection from efferent feedback: several studies have suggested that the OC reflex is activated in anticipation of vocalization (Suga and Jen, 1975; Xie and Henson, 1998).
Cochlear nerve activity is driven by an extremely active glutamatergic synapse, with spontaneous discharge rates in excess of 100 sp/s in some neurons and maximum sound-driven rates that exceed 400 sp/s in many neurons, even in the steady state (Liberman, 1978). Given the relatively small dynamic ranges of ∼20–40 dB (Schalk and Sachs, 1980; Taberner and Liberman, 2005) and the relatively low thresholds (30 dB SPL even for many high-threshold fibers in the middle of the hearing range (Liberman, 1978; Taberner and Liberman, 2005), these maximum discharge rates are elicited by continuous stimuli at intensities of only 60–80 dB SPL. Such relatively moderate sound levels are routine in many natural environments.
In the context of MOC-mediated protection from cochlear neuropathy, it may not be a coincidence that the suppressive effects elicited in cochlear nerve fibers via activation of the MOC system are maximal for low-SR fibers and at moderate sound pressure levels (Guinan and Stankovic, 1996), precisely the fiber type that is most vulnerable, and at the intensity range addressed in the present study. MOC activation reduced maximum discharge rate in some low-SR fibers by >20% (Guinan and Stankovic, 1996). If glutamate excitotoxicity in the cochlear nerve is proportional to the discharge rate, this type of MOC feedback should clearly be protective. The special vulnerability of low-SR fibers to excitotoxicity may be due, at least in part, to their low mitochondrial content (Liberman, 1980) given the known importance of mitochondria in buffering the Ca2+ overload that is a key trigger for excitotoxic neural damage (Szydlowska and Tymianski, 2010).
If nerve damage is related to sustained discharge rate, a hair-cell-based threshold shift might also be protective if it reduces discharge during the exposure. Such an effect could explain why the pattern of noise-induced neuropathy (Fig. 7A,B) was complementary to that of the acute damage to OHC function (Fig. 4A). The threshold shift peak at 16 kHz (Fig. 4A) is classic for acoustic overexposure: maximum damage occurs at frequencies of one-half an octave above the noise band because of level-dependent changes in cochlear mechanics (Cody and Johnstone, 1981). Perhaps the neuropathy was minimal at 16 kHz because the accumulating threshold shift during the exposure limited the cochlear nerve stimulation. The idea that increasing damage to one cochlear structure can decrease damage to another has been suggested in other acoustic injury studies at much higher sound pressure levels (Wang et al., 2002).
Footnotes
This work was supported by the National Institute on Deafness and Other Communication Disorders (Grants R01 DC 0188 and P30 DC 05209). We thank Leslie Liberman for flawless technical support in the preparation and immunostaining of cochlear whole mounts.
The authors declare no competing financial interests.
References
- Bohne BA, Rabbitt KD. Holes in the reticular lamina after noise exposure: implication for continuing damage in the organ of Corti. Hear Res. 1983;11:41–53. doi: 10.1016/0378-5955(83)90044-8. [DOI] [PubMed] [Google Scholar]
- Brown MC. Fiber pathways and branching patterns of biocytin-labeled olivocochlear neurons in the mouse brainstem. J Comp Neurol. 1993;337:600–613. doi: 10.1002/cne.903370406. [DOI] [PubMed] [Google Scholar]
- Cody AR, Johnstone BM. Acoustic trauma: single neuron basis for the “half-octave shift.”. J Acoust Soc Am. 1981;70:707–711. doi: 10.1121/1.386906. [DOI] [PubMed] [Google Scholar]
- Cooper NP, Guinan JJ., Jr Efferent-mediated control of basilar membrane motion. J Physiol. 2006;576:49–54. doi: 10.1113/jphysiol.2006.114991. [DOI] [PMC free article] [PubMed] [Google Scholar]
- Darrow KN, Maison SF, Liberman MC. Cochlear efferent feedback balances interaural sensitivity. Nat Neurosci. 2006a;9:1474–1476. doi: 10.1038/nn1807. [DOI] [PMC free article] [PubMed] [Google Scholar]
- Darrow KN, Simons EJ, Dodds L, Liberman MC. Dopaminergic innervation of the mouse inner ear: evidence for a separate cytochemical group of cochlear efferent fibers. J Comp Neurol. 2006b;498:403–414. doi: 10.1002/cne.21050. [DOI] [PMC free article] [PubMed] [Google Scholar]
- Darrow KN, Maison SF, Liberman MC. Selective removal of lateral olivocochlear efferents increases vulnerability to acute acoustic injury. J Neurophysiol. 2007;97:1775–1785. doi: 10.1152/jn.00955.2006. [DOI] [PMC free article] [PubMed] [Google Scholar]
- Gifford ML, Guinan JJ., Jr Effects of electrical stimulation of medial olivocochlear neurons on ipsilateral and contralateral cochlear responses. Hear Res. 1987;29:179–194. doi: 10.1016/0378-5955(87)90166-3. [DOI] [PubMed] [Google Scholar]
- Groff JA, Liberman MC. Modulation of cochlear afferent response by the lateral olivocochlear system: activation via electrical stimulation of the inferior colliculus. J Neurophysiol. 2003;90:3178–3200. doi: 10.1152/jn.00537.2003. [DOI] [PubMed] [Google Scholar]
- Guinan JJ., Jr Olivocochlear efferents: anatomy, physiology, function, and the measurement of efferent effects in humans. Ear and hearing. 2006;27:589–607. doi: 10.1097/01.aud.0000240507.83072.e7. [DOI] [PubMed] [Google Scholar]
- Guinan JJ, Jr, Warr WB, Norris BE. Differential olivocochlear projections from lateral versus medial zones of the superior olivary complex. J Comp Neurol. 1983;221:358–370. doi: 10.1002/cne.902210310. [DOI] [PubMed] [Google Scholar]
- Guinan JJ, Jr, Stankovic KM. Medial efferent inhibition produces the largest equivalent attenuations at moderate to high sound levels in cat auditory-nerve fibers. J Acoust Soc Am. 1996;100:1680–1690. doi: 10.1121/1.416066. [DOI] [PubMed] [Google Scholar]
- Khimich D, Nouvian R, Pujol R, Tom Dieck S, Egner A, Gundelfinger ED, Moser T. Hair cell synaptic ribbons are essential for synchronous auditory signalling. Nature. 2005;434:889–894. doi: 10.1038/nature03418. [DOI] [PubMed] [Google Scholar]
- Christopher Kirk E, Smith DW. Protection from acoustic trauma is not a primary function of the medial olivocochlear efferent system. J Assoc Res Otolaryngol. 2003;4:445–465. doi: 10.1007/s10162-002-3013-y. [DOI] [PMC free article] [PubMed] [Google Scholar]
- Kujawa SG, Liberman MC. Conditioning-related protection from acoustic injury: effects of chronic deefferentation and sham surgery. J Neurophysiol. 1997;78:3095–3106. doi: 10.1152/jn.1997.78.6.3095. [DOI] [PubMed] [Google Scholar]
- Kujawa SG, Liberman MC. Adding insult to injury: cochlear nerve degeneration after “temporary” noise-induced hearing loss. J Neurosci. 2009;29:14077–14085. doi: 10.1523/JNEUROSCI.2845-09.2009. [DOI] [PMC free article] [PubMed] [Google Scholar]
- Le Prell CG, Shore SE, Hughes LF, Bledsoe SC., Jr Disruption of lateral efferent pathways: functional changes in auditory evoked responses. J Assoc Res Otolaryngol. 2003;4:276–290. doi: 10.1007/s10162-002-3018-6. [DOI] [PMC free article] [PubMed] [Google Scholar]
- Liberman LD, Wang H, Liberman MC. Opposing gradients of ribbon size and AMPA receptor expression underlie sensitivity differences among cochlear-nerve/hair-cell synapses. J Neurosci. 2011;31:801–808. doi: 10.1523/JNEUROSCI.3389-10.2011. [DOI] [PMC free article] [PubMed] [Google Scholar]
- Liberman MC. Auditory-nerve response from cats raised in a low-noise chamber. J Acoust Soc Am. 1978;63:442–455. doi: 10.1121/1.381736. [DOI] [PubMed] [Google Scholar]
- Liberman MC. Morphological differences among radial afferent fibers in the cat cochlea: An electron-microscopic study of serial sections. Hear Res. 1980;3:45–63. doi: 10.1016/0378-5955(80)90007-6. [DOI] [PubMed] [Google Scholar]
- Liberman MC, Brown MC. Physiology and anatomy of single olivocochlear neurons in the cat. Hear Res. 1986;24:17–36. doi: 10.1016/0378-5955(86)90003-1. [DOI] [PubMed] [Google Scholar]
- Liberman MC, Dodds LW. Single-neuron labeling and chronic cochlear pathology. III. Stereocilia damage and alterations of threshold tuning curves. Hear Res. 1984;16:55–74. doi: 10.1016/0378-5955(84)90025-x. [DOI] [PubMed] [Google Scholar]
- Liberman MC, Kiang NY. Acoustic trauma in cats. Cochlear pathology and auditory-nerve activity. Acta Otolaryngol Suppl. 1978;358:1–63. [PubMed] [Google Scholar]
- Liberman MC, Zuo J, Guinan JJ., Jr Otoacoustic emissions without somatic motility: can stereocilia mechanics drive the mammalian cochlea? J Acoust Soc Am. 2004;116:1649–1655. doi: 10.1121/1.1775275. [DOI] [PMC free article] [PubMed] [Google Scholar]
- Lin HW, Furman AC, Kujawa SG, Liberman MC. Primary neural degeneration in the Guinea pig cochlea after reversible noise-induced threshold shift. J Assoc Res Otolaryngol. 2011b;12:605–616. doi: 10.1007/s10162-011-0277-0. [DOI] [PMC free article] [PubMed] [Google Scholar]
- Lin H, Furman AC, Kujawa SG, Liberman MC. Noise-induced primary neural degeneration in guinea pig: does vulnerability depend on spontaneous discharge rate? In: Santi PA, editor. Abstracts of Midwinter Meeting of the Association for Research in Otolaryngology. Mt. Royal, NJ: Association for Research in Otolaryngology; 2011a. p. 56. [DOI] [PMC free article] [PubMed] [Google Scholar]
- Maison SF, Liberman MC. Predicting vulnerability to acoustic injury with a noninvasive assay of olivocochlear reflex strength. J Neurosci. 2000;20:4701–4707. doi: 10.1523/JNEUROSCI.20-12-04701.2000. [DOI] [PMC free article] [PubMed] [Google Scholar]
- Matsubara A, Laake JH, Davanger S, Usami S, Ottersen OP. Organization of AMPA receptor subunits at a glutamate synapse: a quantitative immunogold analysis of hair cell synapses in the rat organ of Corti. J Neurosci. 1996;16:4457–4467. doi: 10.1523/JNEUROSCI.16-14-04457.1996. [DOI] [PMC free article] [PubMed] [Google Scholar]
- Mills DM. Differential responses to acoustic damage and furosemide in auditory brainstem and otoacoustic emission measures. J Acoust Soc Am. 2003;113:914–924. doi: 10.1121/1.1535942. [DOI] [PubMed] [Google Scholar]
- Müller M, von Hünerbein K, Hoidis S, Smolders JW. A physiological place-frequency map of the cochlea in the CBA/J mouse. Hear Res. 2005;202:63–73. doi: 10.1016/j.heares.2004.08.011. [DOI] [PubMed] [Google Scholar]
- Narins PM. Effects of masking noise on evoked calling in the Puerto Rican Coqui (Anura: Leptodactylidae) J Comp Physiol A. 1982;147:439–446. [Google Scholar]
- Osen KK, Roth K. Histochemical localization of cholinesterases in the cochlear nuclei of the cat, with notes on the origin of acetylcholinesterase-positive afferents and the superior olive. Brain Res. 1969;16:165–185. doi: 10.1016/0006-8993(69)90092-4. [DOI] [PubMed] [Google Scholar]
- Pujol R, Puel JL. Excitotoxicity, synaptic repair, and functional recovery in the mammalian cochlea: a review of recent findings. Ann N Y Acad Sci. 1999;884:249–254. doi: 10.1111/j.1749-6632.1999.tb08646.x. [DOI] [PubMed] [Google Scholar]
- Pujol R, Puel JL, Gervais d'Aldin C, Eybalin M. Pathophysiology of the glutamatergic synapses in the cochlea. Acta Otolaryngol. 1993;113:330–334. doi: 10.3109/00016489309135819. [DOI] [PubMed] [Google Scholar]
- Rajan R. Effect of electrical stimulation of the crossed olivocochlear bundle on temporary threshold shifts in auditory sensitivity. I. Dependence on electrical stimulation parameters. J Neurophysiol. 1988;60:549–568. doi: 10.1152/jn.1988.60.2.549. [DOI] [PubMed] [Google Scholar]
- Robertson D. Functional significance of dendritic swelling after loud sounds in the guinea pig cochlea. Hearing Res. 1983;9:263–278. doi: 10.1016/0378-5955(83)90031-x. [DOI] [PubMed] [Google Scholar]
- Ruel J, Nouvian R, Gervais d'Aldin C, Pujol R, Eybalin M, Puel JL. Dopamine inhibition of auditory nerve activity in the adult mammalian cochlea. Eur J Neurosci. 2001;14:977–986. doi: 10.1046/j.0953-816x.2001.01721.x. [DOI] [PubMed] [Google Scholar]
- Schalk TB, Sachs MB. Nonlinearities in auditory-nerve fiber responses to bandlimited noise. J Acoust Soc Am. 1980;67:903–913. doi: 10.1121/1.383970. [DOI] [PubMed] [Google Scholar]
- Scharf B, Magnan J, Collet L, Ulmer E, Chays A. On the role of the olivocochlear bundle in hearing: a case study. Hear Res. 1994;75:11–26. doi: 10.1016/0378-5955(94)90051-5. [DOI] [PubMed] [Google Scholar]
- Spoendlin H. Innervation densities of the cochlea. Acta Otolaryng. 1972;73:235–248. doi: 10.3109/00016487209138937. [DOI] [PubMed] [Google Scholar]
- Suga N, Jen PH. Peripheral control of acoustic signals in the auditory system of echolocating bats. J Exp Biol. 1975;62:277–311. doi: 10.1242/jeb.62.2.277. [DOI] [PubMed] [Google Scholar]
- Szydlowska K, Tymianski M. Calcium, ischemia and excitotoxicity. Cell Calcium. 2010;47:122–129. doi: 10.1016/j.ceca.2010.01.003. [DOI] [PubMed] [Google Scholar]
- Taberner AM, Liberman MC. Response properties of single auditory nerve fibers in the mouse. J Neurophysiol. 2005;93:557–569. doi: 10.1152/jn.00574.2004. [DOI] [PubMed] [Google Scholar]
- Takeno S, Harrison RV, Ibrahim D, Wake M, Mount RJ. Cochlear function after selective inner hair cell degeneration induced by carboplatin. Hear Res. 1994;75:93–102. doi: 10.1016/0378-5955(94)90060-4. [DOI] [PubMed] [Google Scholar]
- Vacher SR, Guinan JJ, Jr, Kobler JB. Intracellularly labeled stapedius-motoneuron cell bodies in the cat are spatially organized according to their physiologic responses. J Comp Neurol. 1989;289:401–415. doi: 10.1002/cne.902890306. [DOI] [PubMed] [Google Scholar]
- Wang Y, Hirose K, Liberman MC. Dynamics of noise-induced cellular injury and repair in the mouse cochlea. J Assoc Res Otolaryngol. 2002;3:248–268. doi: 10.1007/s101620020028. [DOI] [PMC free article] [PubMed] [Google Scholar]
- Warr WB, Guinan JJ., Jr Efferent innervation of the organ of Corti: two separate systems. Brain Res. 1979;173:152–155. doi: 10.1016/0006-8993(79)91104-1. [DOI] [PubMed] [Google Scholar]
- Wiederhold ML, Kiang NY. Effects of electric stimulation of the crossed olivocochlear bundle on single auditory-nerve fibers in the cat. J Acoust Soc Am. 1970;48:950–965. doi: 10.1121/1.1912234. [DOI] [PubMed] [Google Scholar]
- Winslow RL, Sachs MB. Effect of electrical stimulation of the crossed olivocochlear bundle on auditory nerve response to tones in noise. J Neurophysiol. 1987;57:1002–1021. doi: 10.1152/jn.1987.57.4.1002. [DOI] [PubMed] [Google Scholar]
- Xie DH, Henson OW., Jr Tonic efferent-induced cochlear damping in roosting and echolocating mustached bats. Hearing research. 1998;124:60–68. doi: 10.1016/s0378-5955(98)00122-1. [DOI] [PubMed] [Google Scholar]