Abstract
Purpose/Objective(s)
The purpose of this study is to evaluate the potential of using an in-room PET for treatment verification in proton therapy and to derive suitable PET scan times.
Materials/Methods
Nine patients undergoing passive scattering proton therapy were scanned immediately after treatment with an in-room PET scanner. The scanner was positioned next to the treatment head after treatment. The Monte Carlo (MC) method was employed to reproduce PET activities for each patient. To assess the proton beam range uncertainty we designed a novel concept where the measured PET activity surface distal to the target at the end of range was compared with MC predictions. The repositioning of patients for the PET scan took on average about 2 minutes. The PET images were reconstructed considering varying scan times to test the scan time dependency of the method.
Results
The measured PET images show overall good spatial correlations with MC predictions. Some discrepancies could be attributed to uncertainties in the local elemental composition and biological washout. For 8 patients treated with a single field, the average range differences between PET measurements and CT-image-based MC results were less than 5 mm (< 3 mm for 6 of 8 patients) and root-mean-square deviations (RMSD) were 4-11 mm with PET-CT image co-registration errors of about 2 mm. Our results also show that a short-length PET scan of 5 minutes can yield similar results compared to a 20 minutes PET scan.
Conclusions
Our first clinical trials of 9 patients using an in-room PET system demonstrated its potential for in vivo treatment monitoring in proton therapy. For a quantitative range prediction with arbitrary shape of target volume, we suggest employing the distal PET activity surface.
Keywords: Proton therapy, In vivo dose, In-room PET, Monte Carlo simulation
INTRODUCTION
Compared to photon beams, proton beams can deliver high radiation doses using the Bragg peak to target volumes with less collateral dose and damage to adjacent healthy tissues and critical organs due to the lack of exit dose. However, the range uncertainty from imprecision in converting CT number to stopping power for treatment planning or in patient positioning and organ motions may lead to clinically significant over-doses to normal tissues or under-doses to tumor volumes. Gaining insight into the end range uncertainties is very important to optimizing treatment and patient safety in proton radiotherapy.
The distribution of positron emitters generated by proton-induced nuclear interactions is not directly related to the dose distribution because the dose is mainly deposited via electromagnetic interactions. However, a correlation with the beam range can be found. For in vivo range verification, off-line positron emission tomography (PET) has been studied to measure the PET activity generated by proton-induced nuclear interactions along the beam passage and to assess their relationship with proton dose distribution (1,2). However, the short half-life of the positron emitters, particularly 15O (T1/2 = 2.037 min) dominant in soft tissue, limits the precision of range verification using an off-line PET scanner outside of the treatment room. An in-beam PET scanner (3) and planar positron cameras (4) have been developed for in situ monitoring of delivered dose. However, an in situ PET scanner requires an opening in the scanner ring for proton beam delivery and flexible patient positioning. Due to the limited solid angle of a partial-ring PET scanner, the incomplete data collection is unavoidable (5). It was reported that the reduced ring coverage could significantly increases the distortions and artifacts in the reconstructed image (6). To increase image quality, time-of-flight (TOF) based in-beam PET is under investigation (7).
To partly overcome these potential problems, we are investigating PET verification with a portable in-room PET that is currently being used at our institution (8). This in-room PET is a stand-alone scanner on wheels with complete detector rings. It can be positioned next to the proton beam gantry to scan the patient quickly after beam delivery with improved artifact-free images. In this study, we evaluated the performance of this in-room PET scanner with a set of nine patients undergoing passive scattering proton therapy. We also suggest a new method comparing the measured and Monte Carlo simulated PET activity to verify the in vivo beam range. Further, the PET images were reconstructed for different scan times to assess the feasibility of short-length PET scan.
METHODS AND MATERIALS
Patient selection
Nine patients enrolled in an ongoing Institutional Review Board (IRB) approved protocol at our institution were treated with proton radiotherapy and subsequently scanned with in-room PET. Of these patients, 5 were female and 4 were male, with ages ranging from 23 to 63 years (median, 49 years). Only one patient was treated with two proton fields prior to the PET scan while the others were treated with only one field. The total prescribed doses were 50-76 Gy(RBE) of 1.8-2.0 Gy(RBE) each and the beam ranges varied from 48 to 144 mm (Table 1).
Table 1.
Patient characteristics
| Prescribed proton beam | |||||||
|---|---|---|---|---|---|---|---|
| Case No. |
Age (y) |
Gen der |
Anatomical site |
Diagnosis | Range/ modulation (mm) |
Irradiation /delay time (s) |
Total dose (Gy(R BE))/fx |
| 1 | 23 | M | Brainstem | Pilocytic astrocytoma |
144/84 118/75 |
20.0/425.4 19.0/158.9 |
54/30 |
| 2 | 30 | M | Skull base | Chondrosarcoma | 112/54 | 30.5/128.5 | 70/35 |
| 3 | 61 | M | Nasal cavity/sinus |
Melanoma | 106/94 | 37.3/114.0 | 66/33 |
| 4 | 50 | F | Nasal cavity/sinus |
Melanoma | 121/108 | 116.7/88.7 | 56/28 |
| 5 | 57 | F | Orbit | Adenoid cystic carcinoma |
48/33 | 90.0/152.0 | 54/27 |
| 6 | 63 | F | Left brain | Oligodendroglioma | 77/65 | 33.0/139.5 | 54/30 |
| 7 | 47 | M | Nasal cavity | Squamous cell carcinoma |
116/107 | 25.7/121.0 | 60/30 |
| 8 | 49 | F | Nasopharynx | Adenoid cystic carcinoma |
125/100 | 23.0/204.0 | 76/38 |
| 9 | 49 | F | Lacrimal gland |
Adenoid cystic carcinoma |
117/114 | 30.0/170.0 | 76/38 |
Abbreviations: M=male, F=female, fx=fractions.
Patient PET acquisitions
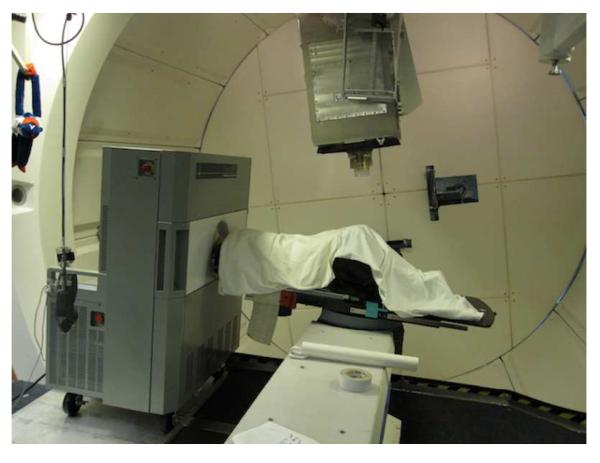
To prevent a potential PET scanner failure due to neutrons generated by proton interactions in the treatment head, the PET scanner was positioned outside of the room during the treatment and wheeled in quickly afterward (Fig 1). Note that radiation damage could be more significant for scintillation detectors using photodiodes than for photomultiplier tubes (9,10). The time between the end of irradiation and the start of PET scan acquisition was on average 2.3 minutes including the scanner and patient repositioning. The patients were scanned for 20 min with data acquisition in list mode. The raw data was acquired with a full-ring detection system of CsI(Na) scintillators and photomultiplier tubes (PMT), and was reconstructed with a 3D ordered subset expectation maximization (OSEM) algorithm (8). The CT images obtained for treatment planning were used for the attenuation correction in reconstructing the PET image. PET markers using concentric 18F point sources and cylindrical CT markers were used for PET-CT image co-registration. The CT markers were attached at several reference points on the patient’s immobilization mask prior to the treatment planning CT scan. The PET markers were inserted in the CT markers just before the patient irradiation.
Figure 1.
In-room PET on wheels positioned near the proton beam gantry with a patient being scanned immediately after treatment.
Monte Carlo simulation
The predicted PET activity distribution was calculated with the Monte Carlo method using the Geant4 Monte Carlo toolkit (11). The simulated distribution was then used as a reference in verifying the range uncertainty through the comparison with the measured PET activity. Our in-house developed code (12,13), considering all the modules in the treatment head as well as the patient geometry, had been validated previously using phantom and patient studies (8). The simulated PET activity distribution was superimposed on the treatment planning CT after mathematically considering physical and biological decays (2) according to the patient-specific beam delivery and scan times. The spatial resolution of the PET scanner was modeled as a Gaussian with 7 mm FWHM. The number of protons at the entrance of the treatment head was 4 × 10⁷, and phase-space files were scored downstream of the treatment head exit so that particles could be repeatedly used four times to increase the statistical resolution of the results.
Data analysis and range verification
Ideally the measured and simulated PET activity distributions should be identical over the beam passage. However, not only the measured but also the simulated PET activity results suffer from uncertainties. The accuracy of the simulated distribution depends on the precise consideration of patient-specific variations in element composition (14) and biological washout (2). The measured distributions suffer from background activities and the limited spatial resolution of the PET scanner. For the more accurate range prediction, comparing PET activities nearer the beam end is preferred. The location of 25% of maximum PET activity was selected due to the background activities observed up to 20% of the maximum activity. Note that, comparing these activities at just one particular location (15) could unreasonably increase the difference with random fluctuations of the measured and simulated activities. Eventually, to smear out the random fluctuation effect, we defined the reference range as the middle point of 50% and 25% of the maximum PET activity.
The PET image was co-registered on the patient CT image. Next, the reference ranges in each voxel line (1D) of PET-CT co-registered images were calculated along the proton beam passage. Finally, a reference range map (2D PET surface) was acquired in the beam’s eye view from the arbitrary shape of the PET image (3D). For the quantitative analysis, the average range difference and root-mean-square deviation (RMSD) between the simulated and measured PET activity was derived based on the point-by-point calculation as follows:
| (1) |
Where, Xmeas,i and Xmc,i are the reference ranges in i’th voxel line of simulated and measured PET images, respectively. The average range difference could show the overall difference between the simulated and measured PET surfaces, and the deviations could be predicted with RMSD. To test the potential and the utility of short-length PET scan, the PET data were also reconstructed and analyzed for different scan times, in 1, 2, and 5 min steps for 0-6, 6-10, and 10-20 min, respectively.
RESULTS
Monte Carlo validation
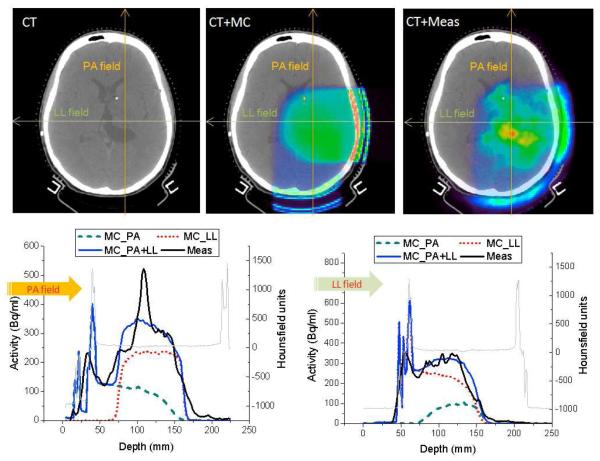
The Monte Carlo method was verified with the first patient in our cohort (table 1). The subject was treated with two fields; the first proton beam was delivered with a posterior anterior (PA) field for 20 s, then after 487 s of patient and gantry repositioning the second beam was delivered (LL) for 19 s. Then, after 159 s of delay time for patient repositioning for the in-room PET the patient was scanned for 20 min. The simulated PET activity from the PA field shows much lower distribution compare to the activity from the LL field due to the longer delay time including the second beam setup and delivery, even though the prescribed dose was the same with 0.9 Gy(RBE) for each field. The CT image of top left in Fig 2 shows an anatomical distortion near the center of the brain before proton radiotherapy. Along the left thalamus and abutting the lateral ventricle, a hot spot in the measured PET activity was observed, while the simulated activity shows the gradual distribution due to similar Hounsfield units (16,17). It is possible that the limited biological perfusion in comparison with the neighboring normal tissue could potentially allow the reduction of the washout effect and thus lead to the remarkably higher activity (>30%) in this region. Except for the hot spot region, the Monte Carlo prediction agrees reasonably well with the measurement, despite patient-specific uncertainties and the complex calculation process considering two fields.
Figure 2.
CT image (top left), CT with Monte Carlo predicted PET image (top middle), and CT with measured PET image (top right) of a patient treated with two fields (PA and LL). And the simulated and measured PET activities with PA (bottom left) and LL direction (bottom right) along the arrows shown in the upper middle and right images. PA= posterior-anterior; LL=left-lateral; MC=Monte Carlo; and Meas=Measured.
Spatial distribution
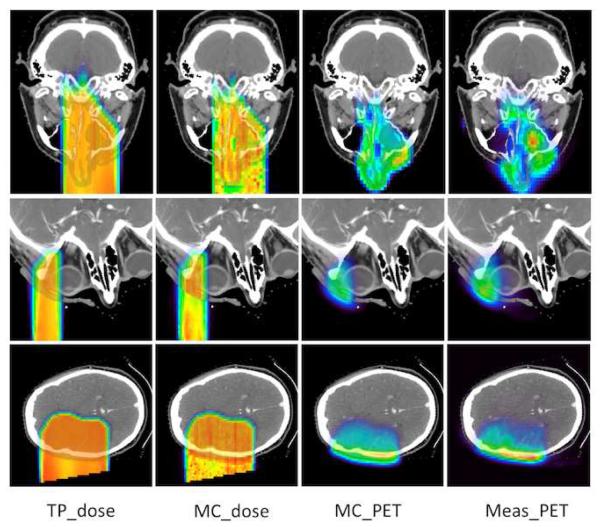
Figure 3 shows the proton dose and PET activity for a nasal cavity (case 3), orbit case (case 6), and left brain (case 5). The proton beam ranges prescribed in the treatment plan and obtained from the Monte Carlo simulation mostly agree to within 2 mm and the simulated and measured PET activity show similar distribution along the proton beam passage. For the nasal cavity case, in which nasal cavity and sinus content can be variable, in vivo range verification may be helpful to predict late toxicity such as hearing and vision deficits or may be used to help guide and verify adaptive replanning. The measured PET activity agrees well with the Monte Carlo simulation despite the heterogeneous composition of air, bone, and tissue in the beam passage. The carcinoma in the orbit was treated with a short-range beam of 48 mm, and the PET activity proved the patient lens was well spared with the narrow proton beam. The activity in the skull was significantly higher than in brain tissue due to the higher density, difference in material, and lower biological washout. The biological washout might be different depending on the brain region, which is not modeled in the Monte Carlo simulation due to the difficulty in differentiating tissue perfusion distribution in the brain.
Figure 3.
Planning dose (first column), Monte Carlo predicted dose (second column), Monte Carlo predicted PET (third column), and measured PET (fourth column) for patients treated in the nasal cavity/sinus (top), orbit (middle), and left brain region (bottom). TP = Treatment plan; MC=Monte Carlo; and Meas=Measured. Range of color wash display is from blue (minimum) to red (maximum).
PET surface comparison
Because compensators are used in passive scattered proton therapy, the residual range in the patient varies as the proton beam passing through different thickness in the compensator. Therefore, we use the distal surface of the target region to quantitatively verify the in vivo range of the overall proton beam. Measured PET activity surface composed of reference ranges was compared with the simulated surface for a 20 min PET scan as shown in Fig. 4. The color of each voxel indicates the reference range in the beam’s eye view. Near the center of the beam passage, the convex surface (longer beam range) was observed in both the simulated and measured PET activity surface. Significant range differences of more than 10 mm were found not only in the penumbra region but also near the convex region. The sharp range difference may arise from the uncertainty of the PET-CT image co-registration; even a slightly tilted and shifted co-registration could severely increase the range difference, especially in the region where the beam range is changing steeply. The root-mean-square deviation (RMSD) was 4.6 mm, while the average range difference was less than 2 mm for case 6. In the same way, RMSD and average range differences were assessed with seven other patients except for the first patient, who was treated with two fields.
Figure 4.

PET surfaces of Monte Carlo simulated (left) and measured PET distributions (middle), and the difference map (right) for case 6.
Time dependence
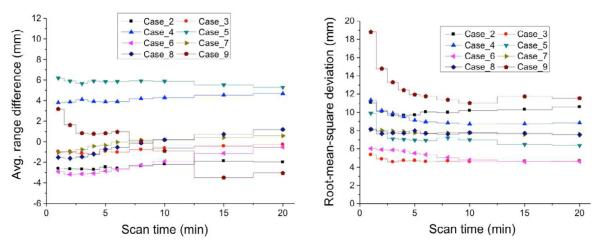
An in-room PET scan of 20 min after proton therapy is not only a burden in operating the treatment room but also might disturb the accurate prediction of the in vivo beam range because of the increased biological washout. The average range difference was mostly less than 5 mm and the RMSD was about 4-11 mm for a PET scan time of 20 min. Interestingly, a total scan time of 5 min shows similar results as shown in Fig. 5. The variation of the average range differences and the RMSDs were less than 2 mm and 1 mm, respectively, for the scan length from 5 min to 20 min except for case 9. For case 9, the proton beam passes through the vitreous humor composed of 99% of water without hematologic perfusion (limited biological washout), and thus the measured PET activity was much higher (> ~ 40%) due to dominant 15O (T1/2=2.037 min) activity for the first 5 min than the Monte Carlo prediction which considers this region as normal tissue with Hounsfield units of 10-20 (oxygen density of 60-70%) and corresponding biological washout. It is observed that the beam range, irradiation time, and delay time of 48-121 mm, 23-116.7 s, and 88-204 s, respectively, did not correlate with the range uncertainty. It seems that the errors due to the PET-CT image co-registration of about 2 mm despite the PET and CT markers (without markers, 3.5-5 mm errors) (8) potentially causes an increase in the RMSD up to 11 mm, while the average range difference is less than 3 mm for 6 of the 8 cases.
Figure 5.

Average range difference (left) and root-mean-square deviation (right) ccording to a PET scan time varying from 1 to 20 min for cases 2-9.
DISCUSSION
Our data show that different perfusion rates in the target volume can be observed with in-room PET scan. The high activity in vitreous humor with the restricted biological washout in case 9 also circumstantially supports this rationale. These phenomena may provide a proper interpretation for monitoring the gross tumor of distinguishably different biological perfusion in comparison to normal tissue through the PET activity observation. On the other hand, it is found with the current patient studies that the Monte Carlo simulation determining the element composition and biological washout based on the patient CT data has a limitation in precisely assessing the PET activity for differentiated functioning tissues having similar CT density of normal tissues. Directly obtaining the element composition distribution and the biological washout parameters for each patient would ideally reduce the uncertainty of the Monte Carlo simulation in predicting the PET activity distribution.
The feasibility of short scans was assessed with 1-20 min of reconstruction time, and the range difference between the simulated and the measured PET activity was not significantly different beyond 5 min, except for in a single case (case 9) as discussed above. The shortened PET acquisition time could provide benefits in the treatment room throughput and greater patient convenience in routine clinical application. Our investigation proves that an in-room PET system can reduce the delay time, one of the major issues in off-line PET treatment verification, to 2 min while attaining a co-registration of the in vivo beam range within five millimeters. The uncertainty of the PET-CT image co-registration is considered the main obstacle in achieving the aimed uncertainty of 2-3 mm. The next generation in-room PET scanner including CT capability with better spatial resolution and sensitivity is under test in our institution. An in-room PET/CT could clearly reduce the co-registration errors and increase the accuracy in treatment monitoring.
Operating electronic devices such as a PET scanner in the treatment room during the beam delivery is at risk of electronic failure due to secondary neutrons generated by proton-induced nuclear interaction in the treatment head. We found that the stand-alone in-room PET scanner on wheels could be promptly positioned after radiation delivery in as little as 2 min and this represents a reasonable system that could be replicated at other proton facilities.
CONCLUSION
Our clinical trials of nine patients demonstrate that an in-room PET scan has tremendous potential for in vivo treatment verification in proton therapy. The new interpretative method using the PET activity surface representing the range variation along the beam passage shows that the range uncertainty with the arbitrary shape of target volume could be effectively assessed based on the average range difference and root-mean-square deviation. Our results also show the potential of short-length PET scan of about 5 min. To reduce the image co-registration errors, we have newly acquired an in-room PET/CT system with higher sensitivity and spatial resolution for future studies.
Acknowledgement
This work was supported by grants P01CA21239 “Proton Therapy Research” and R21CA153455 (PI: El Fakhri) from the National Cancer Institute, and R21EB12823 (PI: El Fakhri) from the National Institute of Biomedical Imaging and Bioengineering.
Footnotes
Conflict of Interest Notification None
Publisher's Disclaimer: This is a PDF file of an unedited manuscript that has been accepted for publication. As a service to our customers we are providing this early version of the manuscript. The manuscript will undergo copyediting, typesetting, and review of the resulting proof before it is published in its final citable form. Please note that during the production process errors may be discovered which could affect the content, and all legal disclaimers that apply to the journal pertain.
RERERENCES
- 1.Parodi K, Enghardt W. Potential application of PET in quality assurance of proton therapy. Phys Med Biol. 2000;45(11):N151–156. doi: 10.1088/0031-9155/45/11/403. [DOI] [PubMed] [Google Scholar]
- 2.Parodi K, Paganetti H, Shih HA, et al. Patient study of in vivo verification of beam delivery and range, using positron emission tomography and computed tomography imaging after proton therapy. Int J Radiat Oncol Biol Phys. 2007;68:920–34. doi: 10.1016/j.ijrobp.2007.01.063. [DOI] [PMC free article] [PubMed] [Google Scholar]
- 3.Parodi K, Bortfeld T, Haberer T. Comparison between in-beam and offline positron emission tomography imaging of proton and carbon ion therapeutic irradiation at synchrotron- and cyclotron-based facilities. Int J Radiat Oncol Biol Phys. 2008;71:945–56. doi: 10.1016/j.ijrobp.2008.02.033. [DOI] [PubMed] [Google Scholar]
- 4.Nishio T, Miyatake A, Ogino T, et al. The development and clinical use of a beam ON-LINE PET system mounted on a rotating gantry port in proton therapy. Int J Radiat Oncol Biol Phys. 2010;76:277–86. doi: 10.1016/j.ijrobp.2009.05.065. [DOI] [PubMed] [Google Scholar]
- 5.Shakirin G, Braess H, Fiedler F, et al. Implementation and workflow for PET monitoring of therapeutic ion irradiation: a comparison of in-beam, in-room, and off-line techniques. Phys Med Biol. 2011;56:1281–1298. doi: 10.1088/0031-9155/56/5/004. [DOI] [PubMed] [Google Scholar]
- 6.Surti S, Zou W, Daube-Witherspoon ME, et al. Design study of an in situ PET scanner for use in proton beam therapy. Phys Med Biol. 2011;56:2667–2685. doi: 10.1088/0031-9155/56/9/002. [DOI] [PMC free article] [PubMed] [Google Scholar]
- 7.Crespo P, Shakirin G, Fiedler F, et al. Direct time-of-flight for quantitative, real-time in-beam PET: a concept and feasibility study. Phys Med Biol. 2007;52:6795–6811. doi: 10.1088/0031-9155/52/23/002. [DOI] [PubMed] [Google Scholar]
- 8.Zhu X, Espana S, Daartz J, et al. Monitoring proton radiation therapy with in-room PET imaging. Phys Med Biol. 2011;56:4041–4057. doi: 10.1088/0031-9155/56/13/019. [DOI] [PMC free article] [PubMed] [Google Scholar]
- 9.McPhersony M, Jones B, Sloan T. Effects of radiation damage in silicon p-i-n photodiodes. Semicond Sci technol. 1997;12:1187–1194. [Google Scholar]
- 10.Fiedler F, Braess H, Enghardt W. Measurement of radiation hardness of PET components. IEEE Nucl Sci Symp Conf Rec. 2009;1:2050–2052. [Google Scholar]
- 11.Agostinelli S, et al. Geant4—a simulation toolkit. Nucl Instrum Methods A. 2003;506:250–303. [Google Scholar]
- 12.Paganetti H. Range uncertainties in proton therapy and the role of Monte Carlo simulations. Phys Med Biol. 2012;75(11):R99–117. doi: 10.1088/0031-9155/57/11/R99. [DOI] [PMC free article] [PubMed] [Google Scholar]
- 13.Paganetti H, Jiang H, Parodi K, et al. Clinical implementation of full Monte Carlo dose calculation in proton beam therapy. Phys Med Biol. 2008;53:4825–4853. doi: 10.1088/0031-9155/53/17/023. [DOI] [PubMed] [Google Scholar]
- 14.Espana S, Zhu X, Daartz J, et al. The reliability of proton-nuclear interaction cross-section data to predict proton-induced PET images in proton therapy. Phys Med Biol. 2011;56:2687–2698. doi: 10.1088/0031-9155/56/9/003. [DOI] [PMC free article] [PubMed] [Google Scholar]
- 15.Antje K, Parodi K, Paganetti H, et al. Quantitative assessment of the physical potential of proton beam range verification with PET/CT. Phys Med Biol. 2008;53:4137–4151. doi: 10.1088/0031-9155/53/15/009. [DOI] [PubMed] [Google Scholar]
- 16.Schaffner B, Pedroni E. The precision of proton range calculation in proton radiotherapy treatment planning: experimental verification of the relation between CT-HU and proton stopping power. Phys Med Biol. 1998;43:1579–1592. doi: 10.1088/0031-9155/43/6/016. [DOI] [PubMed] [Google Scholar]
- 17.Espana S, Paganetti H. The impact of uncertainties in the CT conversion algorithm when predicting proton beam ranges in patients from dose and PET-activity distributions. Phys Med Biol. 2010;55:7557–7571. doi: 10.1088/0031-9155/55/24/011. [DOI] [PubMed] [Google Scholar]


