

Abstract
Context
Readmission rates are used as an indicator of the quality of care that patients receive during a hospital admission and after discharge.
Objective
To determine the prevalence of pediatric readmissions and the magnitude of variation in pediatric readmission rates across hospitals.
Design, Setting, Patients
We analyzed 568,845 admissions at 72 children's hospitals between 7/1/2009 and 6/30/2010 in the National Association of Children's Hospitals and Related Institutions Case Mix dataset. We estimated hierarchical regression models for 30-day readmission rates by hospital, accounting for age and chronic condition indicators. Hospitals with adjusted readmission rates that were one standard deviation above and below the mean were defined as having “high” and “low” rates, respectively.
Main Outcome Measure
Thirty-day unplanned readmissions following admission for any diagnosis and for the 10 admission diagnoses with the highest readmission prevalence. Planned readmissions were identified with ICD-9-CM procedure codes.
Results
The 30-day unadjusted readmission rate for all hospitalized children was 6.5% (n=36,734). Adjusted rates were 28.6% greater in hospitals with high vs. low readmission rates [7.2% (95% CI 7.1–7.2%) vs. 5.6% (95% CI 5.6-5.6%)]. For the 10 admissions diagnoses with the highest readmission prevalence, the adjusted rates were 17.0% to 66.0% greater in hospitals with high vs. low readmission rates. For example, sickle cell rates were 20.1% (95% CI 20.0–20.3%) vs. 12.7% (95% CI 12.6–12.8%) in high vs. low hospitals, respectively.
Conclusions
Among patients admitted to acute care pediatric hospitals, the rate of unplanned readmissions at 30 days was 6.5%. There was wide variability in readmission rates across conditions and hospitals.
Keywords: children, hospital readmission, quality of care
Background
Clinicians, patients, and public and private purchasers of health care are using readmission rates as an indicator of the quality of care that patients receive during a hospital admission and after discharge.1–3 About 20% of hospitalized elderly Medicare beneficiaries are readmitted within 30 days, and the readmission rates vary greatly across hospitals.4,5 This variation is believed to indicate that a substantial proportion of readmissions may be preventable.6,7 The Affordable Care Act mandates that the Centers for Medicare and Medicaid Services reduce Medicare payments to hospitals with excessively high readmission rates.8
Although readmissions for adults have been the subject of substantial research,1–8 readmissions for children have received less attention.9–11 However, there has been a recent increase in interest in pediatric readmissions. For example, the Pediatric Quality Measures Program, established by the Children's Health Program Reauthorization Act, has identified pediatric readmissions as one of the first measures it will develop.12,13 In addition, the federal Partnership for Patients initiative has challenged hospitals to reduce pediatric readmissions by 20%.14,15
To help determine where there might be an opportunity to improve clinical practice and reduce pediatric readmissions, information is needed on which diseases have the highest number of readmissions and whether there are differences in readmission rates across hospitals. Therefore, we analyzed data from 72 children's hospitals to examine the percentage of children who have unplanned readmissions, which admission diagnoses have the most readmissions, and whether readmission rates vary across hospitals.
Methods
Study Design, Setting, and Population
We conducted a retrospective analysis of the National Association of Children's Hospitals and Related Institutions (NACHRI) Case Mix Comparative dataset of patients ≤18 years old who were discharged between 7/1/09-6/30/10 from 72 acute care children's hospitals in 34 states. The hospitals voluntarily submitted their data to NACHRI so that comparative analyses could be performed to identify best practices and clinical areas needing care improvement.16 NACHRI Case Mix is the largest dataset of children's hospitals that links patients across hospitalizations, enabling readmissions analyses. Boston Children's Hospital's Institutional Review Board approved the study.
We excluded index admissions for labor and delivery, newborns with a routine birth, chemotherapy, and patients who left against medical advice, were transferred to another acute care hospital, or died (eFigure 1).17 Adolescents admitted for pregnancy-related problems (e.g., eczema herpeticum) and births for newborns with a non-routine condition (e.g., congenital cytomegalovirus) were included. We used the Agency for Healthcare Research and Quality (AHRQ) Kids' Inpatient Database (KID) 2009 to compare characteristics of our NACHRI cohort with a nationally representative sample of hospitalized children (eTable 1).18
Main Outcome Measure
The first unplanned admission within 30 days of an index admission is defined as a readmission. Additional admissions within 30 days are not counted as readmissions or index admissions. An additional admission after 30 days is counted as a new index admission. We measured readmissions following all-condition admissions and following the 10 condition-specific admissions with the highest readmission prevalence (i.e., admissions with the greatest number of readmissions). We used 3M's All-Patient Refined Diagnosis-Related Groups (APRDRG) version 25 to identify the diagnosis responsible for each admission. APR-DRGs include 316 mutually exclusive groupings of clinically related ICD-9-CM diagnosis and procedural codes.20,21 We refer to each APR-DRG grouping as a “diagnosis” throughout the manuscript. We ranked each diagnosis by the number of associated readmissions to determine which diagnoses had the most readmissions.
We measured unplanned readmissions for any reason (i.e., all-cause) because patients might be readmitted for related conditions even if the index admission and readmission diagnoses differ. We also examined readmissions with diagnoses matching those of the index admission. To exclude planned readmissions, pediatric specialists reviewed every ICD-9-CM procedure code (n=4,066) and identified procedures for their specialty that are usually planned—defined as ones that are scheduled in advance in >80% of cases (e.g., spinal fusion, Nissen fundoplication). They identified 2,418 such procedures; when one of them was coded as the primary procedure, the readmission was classified as a planned readmission.
Casemix Adjustment
We adjusted for age and chronic conditions because their association with readmission risk is believed to be related to intrinsic patient factors rather than quality of care.22 Variation in readmission risk by age and chronic conditions was significant (P<.001 for each; Tables 1 and 2). Moreover, there was statistically significant (P<.001) heterogeneity in age and chronic conditions across hospitals. Therefore, these adjustments accounted for hospitals that disproportionally cared for patients with a high readmission risk due to the types of patients they served and lessened the likelihood of hospitals being inappropriately labeled as an outlier.
Table 1.
30-Day Readmission Rates by Patient and Hospital Characteristics
| Characteristic | No. (%) of Index Admissions | Unadjusted 30-day Unplanned Readmissions | Unadjusted P Valuea | Adjusted Odds Ratio (95% CI)b | |
|---|---|---|---|---|---|
| (N=568,845) | No. | % (95% CI) | |||
| Casemix Adjusters | |||||
| Age | |||||
| <1 year | 171,407 (30.1%) | 10,692 | 6.2% (6.1%–6.4%) | 1.09 (1.05–1.12) | |
| 1–4 years | 145,183 (25.5%) | 9,056 | 6.2% (6.1%–6.4%) | <.001 | 1.00 (0.97–1.03) |
| 5–12 years | 147,265 (25.9%) | 9,035 | 6.1% (6.0%–6.3%) | 0.89 (0.86–0.92) | |
| 13–18 years | 104,990 (18.5%) | 7,951 | 7.6% (7.4%–7.7%) | Reference | |
| No. of chronic condition indicatorsc | |||||
| ≥4 | 36,888 (6.5%) | 6,178 | 16.8% (16.4%–17.1%) | 5.27 (5.05–5.49) | |
| 3 | 42,518 (7.5%) | 5,290 | 12.4% (12.1%–12.8%) | <.001 | 3.91 (3.76–4.08) |
| 2 | 90,538 (15.9%) | 8,480 | 9.4% (9.2%–9.6%) | 2.98 (2.87–3.09) | |
| 1 | 197,972 (34.8%) | 10,628 | 5.4% (5.3%–5.5%) | 1.74 (1.68–1.79) | |
| No chronic condition indicator | 200,929 (35.3%) | 6,158 | 3.1% (3.0%–3.1%) | Reference | |
| Other Patient and Hospital Characteristics | |||||
| Race/ethnicityd | |||||
| Latino | 114,859 (20.8%) | 7,501 | 6.5% (6.4%–6.7%) | 1.09 (1.05–1.12) | |
| Black | 108,469 (19.7%) | 7,505 | 6.9% (6.8%–7.1%) | <.001 | 1.06 (1.03–1.09) |
| Other | 55,686 (10.1%) | 3,457 | 6.2% (6.0%–6.4%) | 0.99 (0.95–1.03) | |
| White | 272,367 (49.4%) | 17,613 | 6.5% (6.4%–6.6%) | Reference | |
| Insuranced | |||||
| Public | 299,812 (55.2%) | 20,628 | 6.9% (6.8%–7.0%) | 1.12 (1.09–1.15) | |
| None | 10,671 (2.0%) | 477 | 4.5% (4.1%–4.9%) | <.001 | 0.85 (0.77–0.94) |
| Private | 207,741 (38.2%) | 17,613 | 5.9% (5.8%–6.0%) | Reference | |
| Other | 24,978 (4.6%) | 1,537 | 6.2% (5.9%–6.5%) | 1.07 (1.00–1.14) | |
| Length of stay | |||||
| ≥7 days | 104,431 (18.4%) | 11,738 | 11.2% (11.0%–11.4%) | 1.79 (1.73–1.84) | |
| 5–6 days | 52,500 (9.2%) | 4,112 | 7.8% (7.6%–8.1%) | <.001 | 1.43 (1.38–1.49) |
| 3–4 days | 128,378 (22.6%) | 7,933 | 6.2% (6.0%–6.3%) | 1.24 (1.20–1.28) | |
| 1–2 days | 283,536 (49.8%) | 12,951 | 4.6% (4.5%–4.6%) | Reference | |
| Other Patient and Hospital Characteristics | |||||
| Number of annual admissions [Mean (Range)] | |||||
| Quartile 4 [12,620 (10,583-18-317)] | 227,158 (39.9%) | 15,495 | 6.8% (6.7%–6.9%) | 1.16 (1.02–1.33) | |
| Quartile 3 [8,830 (7,020 –10,327)] | 158,936 (27.9%) | 10,458 | 6.6% (6.5%–6.7%) | .005 | 1.07 (0.95–1.19) |
| Quartile 2 [6,262 (5,372–6,981)] | 112,712 (19.8%) | 6,761 | 6.0% (5.9%–6.1%) | 1.05 (0.94–1.18) | |
| Quartile 1 [3,891 (1,990–5,061)] | 70,039 (12.3%) | 4,020 | 5.7% (5.6%–5.9%) | Reference | |
| Children's hospital typee | |||||
| Freestanding | 386,033 (67.9%) | 25,594 | 6.6% (6.6%–6.7%) | .04 | 0.98 (0.90–1.08) |
| Non-freestanding | 182,812 (32.1%) | 11,140 | 6.1% (6.0%–6.2%) | Reference | |
| Geographic region | |||||
| Northeast | 86,127 (15.1%) | 6,144 | 7.1% (7.0%–7.3%) | ||
| Midwest | 138,906 (24.4%) | 9,157 | 6.6% (6.5%–6.7%) | .26 | NAf |
| South | 219,471 (38.6%) | 13,774 | 6.3% (6.2%–6.4%) | ||
| West | 124,341 (21.9%) | 7,659 | 6.2% (6.0%–6.3%) | ||
P value for multiple degrees of freedom block test on all categories of the characteristic to assess whether readmission rates varied across the categories was calculated from a hierarchical logistic regression model with a fixed effect for the characteristic and a random effect for hospital.
Adjusted odds ratio from hierarchical logical regression model with random effect for hospital and fixed effects for all characteristics which were bivariately significant with P<.2.
The chronic condition indicators, developed by the Agency for Healthcare Research and Quality, categorize approximately 14,000 ICD-9-CM diagnosis codes into one of two categories, chronic or not chronic conditions, and assign codes for the chronic conditions into one of 18 mutually exclusive body system groups.
Admissions with missing race and insurance values were excluded the respective index admission frequencies and regression models. Race and insurance status are missing for 3.1% and 4.5% of the index admissions, respectively. Five hospitals account for nearly half of the records missing race/ethnicity, and four hospitals account for nearly 90% of the records with missing insurance status.
Children's hospital type is a designation provided by NACHRI to classify children's hospitals as a children's general hospital (i.e., freestanding) and a children's unit within a general hospital (i.e., non-freestanding).
Annual hospital volume was not included in multivariate analysis because it was not significantly associated with readmission rate in bivariate analysis.
Table 2.
Chronic Condition Indicators and 30-Day Readmission Rate
| Chronic Condition Indicator (CCI) Groups | Index Admissions | Examples of Specific Diagnoses within the CCI Group | 30-day Unplanned Readmissions | |
|---|---|---|---|---|
| No. | No. | % (95% CI) | ||
| Neoplasms | 19,687 | Acute leukemia Malignant brain neoplasm | 4,145 | 21.1% (20.5–21.6) |
| Injury and poisoning | 1,258 | Spinal cord injury Toxic effect of metals | 217 | 17.3% (15.2–19.3) |
| Factors influencing health status and contact with health services | 44,795 | Transplantation (e.g., bone marrow, cardiac) Medical technology (e.g., gastrostomy, tracheostomy) | 7,116 | 15.9% (15.5–16.2 |
| Diseases of the genitourinary system | 14,608 | End-stage renal disease Neurogenic bladder | 2,217 | 15.2% (14.6–15.8) |
| Diseases of blood and blood-forming organs | 44,526 | Sickle cell anemia Neutropenia | 6,729 | 15.1% (14.8–15.4) |
| Diseases of the circulatory system | 45,249 | Cardiac dysrhythmia Primary cardiomyopathy | 5,789 | 12.8% (12.5–13.1) |
| Diseases of the digestive system | 58,528 | Inflammatory bowel disease Chronic pancreatitis | 7,415 | 12.7% (12.4–12.9) |
| Infectious and parasitic disease | 744 | Human immunodeficiency virus Chronic hepatitis | 90 | 12.1% (9.7–14.4) |
| Diseases of the nervous system and sense organs | 84,450 | Epilepsy Cerebral palsy | 9,030 | 10.7% (10.5–10.9) |
| Endocrine, nutritional, and metabolic diseases and immunity disorders | 60,572 | Type I diabetes mellitus Cystic fibrosis | 6,385 | 10.5% (10.3–10.8) |
| Diseases of the skin and subcutaneous tissue | 3,939 | Scleroderma Pressure ulcers | 359 | 9.1% (8.2–10.0) |
| Mental disorders | 61,173 | Anxiety disorder Depression disorder | 5,509 | 9.0% (8.8–9.2) |
| Congenital anomalies | 111,588 | Congenital heart disease Spina bifida | 9,790 | 8.8% (8.6–8.9)] |
| Symptoms, signs, and ill-defined conditions | 4,748 | Sleep apnea Aphasia | 379 | 8.0% (7.2–8.8)] |
| Diseases of the musculoskeletal system | 20,706 | Scoliosis Juvenile rheumatoid arthritis | 1,643 | 7.9% (7.6–8.3)] |
| Complications and conditions of pregnancy, childbirth, and during the perinatal perioda | 989 | Neonatal diabetes mellitus Congenital cytomegalovirus | 66 | 6.7% (5.1–8.2)] |
| Diseases of the respiratory system | 101,775 | Asthma Bronchiectasis | 6,225 | 6.1% (6.0–6.3)] |
This CCI includes pregnant adolescents admitted for pregnancy-related problems (e.g., eczema herpeticum) and births for newborns with a non-routine condition (e.g., congenital cytomegalovirus)
We categorized age as <1, 1–4, 5–12, and 13-18-years-old. To identify chronic conditions, we used AHRQ's Chronic Condition Indicator (CCI) classification system,23–25 which dichotomizes ~14,000 ICD-9-CM diagnosis codes into chronic or non-chronic conditions, and aggregates chronic conditions into 1 of 18 mutually exclusive clinical groups (Table 2). We included all groups in our analyses; however, we combined two groups, “Complications of pregnancy, childbirth, and the puerperium” and “Certain conditions originating in the perinatal period,” due to their small size in our cohort. We also adjusted for the number of CCI groups for each index admission as an indicator of medical complexity.25,26
Additional Patient and Hospital Characteristics
We assessed differences in readmission rates by patients' insurance type (public, private, no insurance, other), race/ethnicity (Black, Hispanic, White, and Other), and length of stay (LOS) and by children's hospital characteristics, including freestanding vs. non-freestanding, geographic region, and number of annual index admissions. Because adjustment for these characteristics raises the possibility of adjusting for factors that inappropriately influence quality,2,27 we did not include them as casemix adjusters. Instead, we assessed the degree to which the variation in adjusted readmission rates across hospitals was explained by these characteristics.
Statistical Analyses
We used hierarchical logistic regression models to assess differences in readmission rates by patient and hospital characteristics. We began with hospital random effect models, each with one fixed effect per characteristic of interest. A multiple degrees of freedom block test was used to determine statistical significance for each characteristic. Characteristics with an effect of P <.2 were then entered, simultaneously, into a multivariate model. Pre-planned pairwise comparisons of subgroups (e.g., Latino vs. White) were performed in the multivariate model. The results of these analyses are presented in Table 1.
To assess variation in readmission rates across hospitals, we began with a hospital random effect model without any fixed effects. We subsequently derived an adjusted model by adding fixed effects for each casemix adjuster (age, each CCI group, and CCI count). To assess model overfitting, we built models with 1, 2 (all combinations), and 3 casemix adjusters and compared the Akaike information criterion (AIC) among the models.28 As additional casemix adjusters were added, the AIC decreased, suggesting that the model with all 3 casemix adjusters was not overfit. In the adjusted model, all 3 casemix adjusters remained significantly associated with readmission risk (P<.001), suggesting that each adjuster was explaining a significant amount of variance beyond the other adjusters. We also assessed the interaction between age and CCI count, because some children with a chronic condition might develop additional comorbidities (i.e., additional CCIs) as they age. This interaction was not significant (P =.2) so it is not in the final model.
We estimated the variation of adjusted readmission rates across all hospitals and used the statistical significance of the variance component for the hospital random effect to partition the variation into systematic variation versus variation due to chance. The 2-sided significance threshold was P<.05. We then added fixed effects for additional patient and hospital characteristics (e.g., patient race/ethnicity and type of children's hospital) into the adjusted model to assess whether the variability in adjusted readmission rates across hospitals was reduced when accounting for these characteristics. There were 450 (<0.1%) index admissions excluded from analysis because of missing data for variables that were necessary to define the study cohort (eFigure 1). Data were analyzed using SAS 9.3 (Cary, NC).
Results
Study Cohort
We examined 568,845 index admissions for readmission within 30 days (eFigure 1). The 30-day readmission rate was 6.5% (n = 36,734); among readmitted children, 39% (n = 14,325) were readmitted in the first 7 days and 61.6% (n = 22,628) in the first 14 days. Median age at admission was 3 years (interquartile range 0–10), and 55.2% (n=299,812) had public insurance (Table 1). Thirty-five percent (n=197,972) had 1 CCI, and 29.9% had ≥2 CCIs. The most common CCIs among children in the cohort were congenital anomalies, such as congenital heart disease (n=111,588; 19.6%); respiratory diseases, such as asthma (n=101,775; 17.9%); and neurologic diseases, such as cerebral palsy (n=84,450; 14.8%) (Table 2). Our cohort had a distribution of age, race/ethnicity, and insurance type similar to the nationally representative sample of hospitalized children in the KID. However, more children in our cohort had ≥2 CCIs and the hospitals had a larger number of annual admissions (eTable 1).
Readmissions Rates for the Casemix Adjusters
In bivariate analyses, readmission rates varied significantly (P<.001) for each casemix adjuster (i.e., age, CCI group, and CCI count). Readmission rates were higher in children 13-18-years-old (7.6%) compared with children 5-12-years-old (6.1%), 1-4-years-old (6.2%), and <1-year-old (6.2%), P<.001 (Table 1). Among the CCI groups, the highest and lowest readmission rates were observed for children with neoplasms (21.1%) and chronic respiratory diseases (6.1%), respectively (Table 2). Readmission rates increased as CCI count increased: 5.4% for 1 CCI, 9.4% for 2 CCIs, 12.4% for 3 CCIs, and 16.8% for ≥4 CCIs, P<.001 (Table 1). Patients' age, CCI group, and CCI count remained significantly associated with the likelihood of readmission in multivariate analysis (P<.001 for all).
Readmission Rates for Additional Patient and Hospital Characteristics
Readmission rates varied by patients' insurance type, race/ethnicity, and LOS, by hospitals' number of annual admissions, and by hospital type (Table 1). For example, readmission rates were 6.9% for patients with public insurance, 5.9% for private insurance, 4.5% for no insurance, and 6.2% for other insurance, P<.001. The rates were 6.9% for Blacks, 6.5% for Whites, 6.5% for Latinos, and 6.2% for patients with other race/ethnicity, P<.001. Readmission rates were higher for patients with a longer LOS; rates were 4.6% for patients with a LOS 1–2 days, 6.2% for LOS 3–4 days, 7.8% for LOS 5–6 days, and 11.2% for LOS ≥7 days, P<.001. Insurance type, race/ethnicity, and LOS remained significantly associated with the likelihood of readmission in multivariate analysis.
Variation in All-Condition Admissions
Unadjusted readmission rates varied significantly across hospitals (P<.001), and this variation persisted after adjusting for age, CCI group, and CCI count (P<.001). Significant variation was observed when measuring all-cause readmissions and when measuring readmissions for the same diagnosis as the index admissions (P<.001 for each). To illustrate the magnitude of variation in all-cause readmissions across hospitals, we described the rates for hospitals one standard deviation above versus below the mean: adjusted rates were 28.6% greater in hospitals above versus below [7.2% (95% CI 7.1–7.2) vs. 5.6% (95% CI 5.6-5.6)]. The corresponding rate was 65.4% greater for hospitals two standard deviations above vs. below the mean [8.1% (95% CI 8.1-8.1) vs. 4.9% (95% CI 4.9-4.9)] (Figure 1). Moreover, a multivariate model that additionally adjusted for patients' race/ethnicity, insurance type, and LOS did not significantly change the amount of variance in readmission rates across hospitals (P=.22).
Figure 1. Adjusted 30-Day All-Cause Readmission Rate Variation Across 72 Children's Hospitals.

The mean unadjusted readmission rate across all hospitals is shown by the dark grey horizontal line. The adjusted rates with 95% confidence intervals are shown for each hospital. The rates were adjusted for age and chronic condition indicators.
Most Prevalent Readmissions
Figure 2 lists the 10 admission diagnoses with the highest readmission prevalence. Collectively, these admission diagnoses account for 27.7% (n=10,162) of all readmissions. The highest condition-specific unadjusted 30-day readmission rates were for admissions for anemia/neutropenia (22.5%; n=1,092), ventricular shunt procedures (18.1%, n=675), and sickle cell anemia crisis (16.9%, n=1,019). The remaining 7 admission diagnoses had readmission rates between 2.6%–6.9% and included appendectomy, gastroenteritis, seizure, and 4 respiratory conditions: asthma, bronchiolitis, pneumonia, and upper respiratory infection (URI; e.g., croup).
Figure 2. Unplanned 30-Day Readmission Rate Variation Across Hospitals, Adjusted for Age and Chronic Condition Indicators.
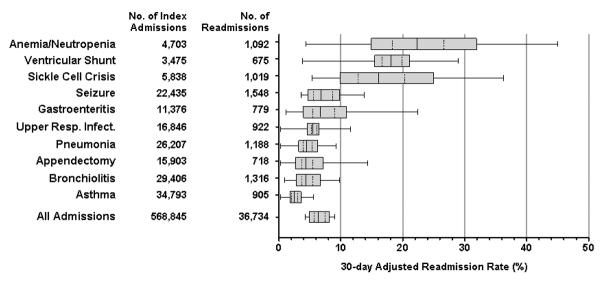
The solid line through the middle of the box represents the mean rate; dashed lines are ±1 SD of the mean; the top and bottom edges of the box are ±2 SD. The whiskers are the minimum and maximum rate.
Variation in Readmissions by Admission Diagnosis
Unadjusted readmission rates varied significantly across hospitals for 8 of the 10 diagnoses (P<.001 for each) with the highest number of readmissions [i.e., URI (P=.07) and ventricular shunt procedures (P=.48) were the exceptions]. For these 8 diagnoses, the adjusted readmission rates were 17.0% to 66.0% greater for hospitals with readmission rates that were one standard deviation above vs. below the mean (Figure 2). The corresponding adjusted rates were 36.8% to 174.8% greater for hospitals two standard deviations above vs. below the mean. The absolute adjusted rate differences across hospitals varied by diagnosis. For example, 3.6% (95% CI 3.5–3.6%) vs. 1.8% (95% CI 1.8-1.8%) were the adjusted readmission rates for asthma between hospitals two standard deviations above versus below the mean. The corresponding rates for sickle cell were 24.9% (95% CI 24.8–25.1%) versus 9.9% (95% CI 9.8–10.0%).
Readmissions Diagnoses
For all-condition admissions, 48.3% of readmissions were for a diagnosis involving the same organ system as the index admission. For each condition-specific admission, 27.3% to 86.2% of readmissions were for a diagnosis in the same organ system as the index admission (Table 3). For 9 of the 10 index admission diagnoses, the most common readmission diagnosis matched the index diagnosis. Sickle cell had the highest percentage of readmissions (79.4%, n=809) that were for the same diagnosis as the index admission. The exception to this pattern was appendectomy. The most common readmission diagnosis following appendectomy was post-operative infection (29.7%, n=213).
Table 3.
Reasons for Readmission Following Condition-Specific Index Admissions
| Index Admission Diagnosis | Readmissions | Reasons for Readmission | ||||
|---|---|---|---|---|---|---|
| Readmission Diagnosis | Readmission Diagnosis Organ System Same as Index Admission | |||||
| Most Common | 2nd Most Common | 3rd Most Common | All Others | |||
| No. | No. (%) | No. (%) | No. (%) | No. (%) | No. (%) | |
| Seizure | 1,548 | Seizure [996 (64.3%)] | Upper respiratory infection [39 (2.5%)] | Other disorders of the nervous system [29(1.9%)] | 484 (31.3%) | 1,107 (71.5%) |
| Bronchiolitis | 1,316 | Bronchiolitis [599 (45.5%)] | Pneumonia [117 (8.9%)] | Asthma [106 (8.1%)] | 494 (37.5%) | 974 (74.0%) |
| Pneumonia | 1,188 | Pneumonia [379 (31.9%)] | Asthma [100 (8.4%)] | Bronchiolitis [82 (6.9%)] | 627 (52.8%) | 788 (66.3%) |
| Anemia/neutropenia | 1,092 | Anemia/neutropenia [582 (53.3%)] | Acute leukemia [41 (3.8%)] | Other anemia [31 (2.8%)] | 436 (40.1%) | 639 (58.5%) |
| Sickle cell crisis | 1,019 | Sickle cell anemia crisis [809 (79.4%)] | Other anemia & blood disorders [68 (6.7%)] | Pneumonia [27 (2.7%)] | 115 (11.3%) | 878 (86.2%) |
| Upper respiratory infection | 922 | Upper respiratory infection [190 (20.6%)] | Pneumonia [61 (6.6%)] | Bronchiolitis [45 (4.9%)] | 626 (67.9%) | 252 (27.3%) |
| Asthma | 905 | Asthma [556 (61.4%)] | Pneumonia [107 (11.8%)] | Bronchiolitis [41 (4.5%)] | 201 (22.2%) | 752 (83.1%) |
| Gastroenteritis | 779 | Gastroenteritis [181 (23.2%)] | Other digestive system diagnoses [46 (5.9%)] | Hypovolemia & related electrolyte disorders [36 (4.6%)] | 516 (66.2%) | 350 (44.9%) |
| Appendectomy | 718 | Postoperative, post-traumatic & other device infections [213 (29.7%)] | Major GI & peritoneal infections [135 (18.8%)] | Abdominal pain [56 (7.8%)] | 314 (43.7%) | 359 (50.0%) |
| Ventricular shunt procedures | 675 | Ventricular shunt procedures [262 (38.8%)] | Craniotomy [89 (13.2%)] | Other disorders of nervous system [38 (5.6%)] | 286 (42.4%) | 489 (72.4%) |
Discussion
In a national sample of children's hospitals, 6.5% of hospitalized children experienced an unplanned 30-day readmission. The 10 condition-specific diagnoses with the highest number (i.e., prevalence) of readmissions had readmission rates that ranged from 3% to 23%. There were statistically significant variations in readmission rates across hospitals, both for all-condition and condition-specific admissions. These hospital variations persisted when casemix-adjusted for patients' age and type and number of CCIs.
Further investigation is necessary to understand the reasons for variation in readmission rates across children's hospitals. As found in Medicare readmission studies, the variation may indicate differences in care during the index hospitalization (e.g., quality of the discharge instructions29); differences in post-discharge care (e.g., access to primary care for a follow-up visit5); or differences in community factors (e.g., availability of paid leave for parents to care for recuperating children30). The variation could also be due to area differences in the tendency to hospitalize children or in the availability of hospitals beds.31,32 In addition, although we accounted for age and chronic conditions, the variation may be influenced by other patient-specific factors, such as disease progression near the end of life.33
The threshold at which readmission rate variation across hospitals becomes clinically meaningful has not been determined.34 In this study, greater readmission rate variation across hospitals was observed for diseases with higher readmission rates (e.g., sickle cell crisis). Higher readmission rates may have occurred because these diseases are, in general, more complex or more difficult to treat.11 Nonetheless, some hospitals and their local health systems had relatively low readmission rates for these diseases, suggesting that the higher readmission rates might not be caused entirely by the natural course of the diseases themselves. Additional studies are needed to understand how low readmission rates in high-risk pediatric diseases can be achieved.
The opportunity to reduce pediatric readmissions depends on whether they are preventable. The administrative data used in the present study do not enable a conclusive determination of readmission preventability. However, we sought to exclude readmissions for planned procedures from our analyses, and the assessment of variation in readmission rates involved a comparison of observed versus expected rates for each hospital. Moreover, prior studies report that a considerable proportion of readmissions for many of the diagnoses in our study is preventable. For example, four of the ten most prevalent readmission conditions were for the ambulatory care sensitive conditions (ACSC) of asthma, gastroenteritis, pneumonia, and seizure.35–37 It is believed that hospitalizations for ACSCs can be prevented with high quality outpatient care.35–37 Some readmissions may have been prevented with high quality inpatient care. For instance, in a single-center study, nearly one-fourth of readmissions following admission for seizure were due to medication adverse events found to have occurred during the index admission.38 Nearly all of the readmissions in studies of appendectomy and ventricular shunt operations were due to post-operative complications.39–41 In studies of individual hospitals, readmission rates for asthma, bronchiolitis, and sickle cell disease have been reduced with improved discharge planning and follow-up care.42–44
Eliminating disparities in pediatric care may also help reduce pediatric readmissions. As in prior studies,9,11,45–48 we observed higher readmission rates in Black and Latino children and in children with public insurance. Children with these attributes are less likely to have a usual source of outpatient care49 or a medical home that could help to maintain their health after hospital discharge.50 Adults with public insurance are less likely to visit their doctor within 30 days of a hospitalization,51 and they are more likely to use the emergency department for non-emergent care.52 Further investigation is needed to determine whether these patterns of health services utilization are associated with increased readmission risk in children.
This study has several limitations. The dataset did not include information on readmissions to a different hospital, which likely led to an undercounting of readmissions. One adult study reports that nearly 20% of heart failure readmissions are to a different hospital.53 Patients at children's hospitals might not experience as many readmissions to a different hospital as adult patients, who often use multiple hospitals for their inpatient care.54 Children, especially those with higher medical complexity, may be more likely to have their inpatient care needs met within a single institution.
Furthermore, although our cohort included nearly one-fifth of all hospitalized children in the U.S., it did not include hospitalizations at non-children's hospitals, which in general might have a smaller volume of patients and provide inpatient care for children with less severe illnesses. We relied on administrative billing codes to define the study cohort, identify hospitalizations and readmissions for specific diseases, and exclude planned readmissions; limitations in the ability of administrative data to provide complete clinical information as well as errors and variation in coding practices across institutions could affect our results.55 The dataset did not contain information on outpatient health services, which may be associated with the likelihood of readmission.5
Despite these limitations, we found substantial readmission rate variation across children's hospitals that remained after controlling for patient age and chronic conditions. If hospitals with the highest readmission rates in this study were able to achieve the rates of the best performing hospitals, then the overall count of readmissions would be much smaller. Hospitals might find it useful to review the distribution of pediatric readmission rates in this study to help interpret their own performance, identify target conditions for quality improvement, and determine whether an examination of the causes of their readmissions would be helpful.
Conclusion
Our study provides a broad look at variation in pediatric readmission rates across a large number of U.S. children's hospitals. Among patients admitted to acute care pediatric hospitals, the rate of unplanned readmissions at 30 days was 6.5%, and there was wide variability in readmission rates across conditions and hospitals.
Supplementary Material
Acknowledgments
All authors had full access to all the data in the study and take responsibility for the integrity of the data and the accuracy of the data analysis.
Funding Support
Funding was provided by the Agency for Healthcare Research and Quality (U18 HS020513, Principal Investigator: Dr. Schuster). Dr. Berry was supported by the Eunice Kennedy Shriver National Institute of Child Health and Human Development (K23 HD058092). The funders were not involved in the design and conduct of the study; in the collection, analysis, and interpretation of the data; or in the preparation, review, or approval of the manuscript.
Abbreviations
- (APR-DRG)
All-Patient Refined Diagnosis-Related Groups
- (CMS)
Centers for Medicare and Medicaid Services
- (CCI)
Chronic Condition Indicator
- (ICD-9-CM)
International Classification of Diseases, Ninth Revision, Clinical Modification
- (KID)
Kids' Inpatient Database
- (NACHRI)
National Association of Children's Hospitals and Related Institutions
Footnotes
The authors have no conflicts of interest to disclose.
References
- 1.Carrns A. Farewell, and don't come back. Health reform gives hospitals a big incentive to send patients home for good. US News World Rep. 2010 Aug;147(7):20, 22–23. [PubMed] [Google Scholar]
- 2.Axon RN, Williams MV. Hospital readmission as an accountability measure. JAMA. 2011 Feb 2;305(5):504–505. doi: 10.1001/jama.2011.72. [DOI] [PubMed] [Google Scholar]
- 3.Coye MJ. CMS' stealth health reform. Plan to reduce readmissions and boost the continuum of care. Hospitals & health networks / AHA. 2008 Nov;82(11):24. [PubMed] [Google Scholar]
- 4.Bernheim SM, Grady JN, Lin Z, et al. National patterns of risk-standardized mortality and readmission for acute myocardial infarction and heart failure. Update on publicly reported outcomes measures based on the 2010 release. Circ Cardiovasc Qual Outcomes. 2010 Sep;3(5):459–467. doi: 10.1161/CIRCOUTCOMES.110.957613. [DOI] [PMC free article] [PubMed] [Google Scholar]
- 5.Jencks SF, Williams MV, Coleman EA. Rehospitalizations among patients in the Medicare fee-for-service program. N Engl J Med. 2009 Apr 2;360(14):1418–1428. doi: 10.1056/NEJMsa0803563. [DOI] [PubMed] [Google Scholar]
- 6.Vinson JM, Rich MW, Sperry JC, Shah AS, McNamara T. Early readmission of elderly patients with congestive heart failure. Journal of the American Geriatrics Society. 1990 Dec;38(12):1290–1295. doi: 10.1111/j.1532-5415.1990.tb03450.x. [DOI] [PubMed] [Google Scholar]
- 7.van Walraven C, Bennett C, Jennings A, Austin PC, Forster AJ. Proportion of hospital readmissions deemed avoidable: a systematic review. CMAJ. 2011 Apr 19;183(7):E391–402. doi: 10.1503/cmaj.101860. [DOI] [PMC free article] [PubMed] [Google Scholar]
- 8.Favole JA. Readmitted patients Cost Billions. Wall Street Journal. 2009 Apr 2;:4. Section D. [Google Scholar]
- 9.Feudtner C, Levin JE, Srivastava R, et al. How well can hospital readmission be predicted in a cohort of hospitalized children? A retrospective, multicenter study. Pediatrics. 2009 Jan;123(1):286–293. doi: 10.1542/peds.2007-3395. [DOI] [PMC free article] [PubMed] [Google Scholar]
- 10.Morse RB, Hall M, Fieldston ES, et al. Hospital-level compliance with asthma care quality measures at children's hospitals and subsequent asthma-related outcomes. JAMA. 2011 Oct 5;306(13):1454–1460. doi: 10.1001/jama.2011.1385. [DOI] [PubMed] [Google Scholar]
- 11.Berry JG, Hall DE, Kuo DZ, et al. Hospital utilization and characteristics of patients experiencing recurrent readmissions within children's hospitals. JAMA. 2011 Feb 16;305(7):682–690. doi: 10.1001/jama.2011.122. [DOI] [PMC free article] [PubMed] [Google Scholar]
- 12.Dougherty D, Schiff J, Mangione-Smith R. The Children's Health Insurance Program Reauthorization Act quality measures initiatives: moving forward to improve measurement, care, and child and adolescent outcomes. Acad Pediatr. 2011 May-Jun;11(3 Suppl):S1–S10. doi: 10.1016/j.acap.2011.02.009. [DOI] [PubMed] [Google Scholar]
- 13.Agency for Healthcare Research and Quality [Accessed 4/23/12];Crosswalk of the First Set of Priorities for the Pediatric Healthcare Quality Measures Program Centers of Excellence with the CHIPRA Initial Core Measure Set. 2011 http://www.ahrq.gov/chipra/crosswalk.htm.
- 14. [Accessed 21 September 2012];Partnership for Patients: Better Care, Lower Costs. 2011 http://www.healthcare.gov/compare/partnership-for-patients/.
- 15.Ohio Children's Hospital's Solutions for Patient Safety [Accessed 21 September 2012];Creating a National Children's Hospital Learning Network to Save Lives, Improve Care and Reduce Costs. http://solutionsforpatientsafety.org/files/sps-fact-sheet.pdf.
- 16.National Association of Children's Hospitals and Related Institutions Case Mix Comparative Data Program. http://www.childrenshospitals.net/AM/Template.cfm?Section=Database&Template=/CM /HTMLDisplay.cfm&ContentID=45023.
- 17.Bernheim SM, Lin Z, Grady JN, et al. 2011 Measures Maintenance Technical Report: Acute Myocardial Infarction, Heart Failure, and Pneumonia 30-day Risk Standardized Readmission Measures. Yale Center for Outcomes Research and Evaluation; New Haven: 2011. [Google Scholar]
- 18.Agency for Healthcare Research and Quality . Introduction to the HCUP Kids' Inpatient Database (KID) 2009. Rockville, MD: Jun, 2011. [Google Scholar]
- 19.Centers for Medicare and Medicaid Services . Medicare Hospital Quality Chartbook: Yale New Haven Health System Corporation Center for Outcomes Research and Evaluation. 2010. [Google Scholar]
- 20.Sedman AB, Bahl V, Bunting E, et al. Clinical redesign using all patient refined diagnosis related groups. Pediatrics. 2004 Oct;114(4):965–969. doi: 10.1542/peds.2004-0650. [DOI] [PubMed] [Google Scholar]
- 21.3M Health Information Systems [Accessed 26 November 2012];All Patient Refined Diagnosis Related Groups (APRDRGs) Version 20.0 Methodology Overview. 2003 http:/ /www.hcup-us.ahrq.gov/db/nation/nis/APR-DRGsV20MethodologyOverviewandBibliography.pdf.
- 22.Eselius LL, Cleary PD, Zaslavsky AM, Huskamp HA, Busch SH. Case-mix adjustment of consumer reports about managed behavioral health care and health plans. Health Serv Res. 2008 Dec;43(6):2014–2032. doi: 10.1111/j.1475-6773.2008.00894.x. [DOI] [PMC free article] [PubMed] [Google Scholar]
- 23.Agency for Healthcare Research and Quality [Accessed 26 September 2012];Chronic Condition Indicator. http://www.hcup-us.ahrq.gov/toolssoftware/chronic/chronic.jsp.
- 24.Chi MJ, Lee CY, Wu SC. The prevalence of chronic conditions and medical expenditures of the elderly by chronic condition indicator (CCI) Arch Gerontol Geriatr. 2011 May-Jun;52(3):284–289. doi: 10.1016/j.archger.2010.04.017. [DOI] [PubMed] [Google Scholar]
- 25.Friedman B, Jiang HJ, Elixhauser A, Segal A. Hospital inpatient costs for adults with multiple chronic conditions. Med Care Res Rev. 2006 Jun;63(3):327–346. doi: 10.1177/1077558706287042. [DOI] [PubMed] [Google Scholar]
- 26.Cohen E, Kuo DZ, Agrawal R, et al. Children with medical complexity: an emerging population for clinical and research initiatives. Pediatrics. 2011 Mar;127(3):529–538. doi: 10.1542/peds.2010-0910. [DOI] [PMC free article] [PubMed] [Google Scholar]
- 27.National Quality Forum Outcomes and Efficiency Measures Phase I. [Accessed 26 September 2012];Hospital Care. 2008 http://www.qualityforum.org/Projects/h/Hospital_Care_-_Outcomes_and_Efficiency_Measures_Phase_I_(2008)/Hospital_Care_Outcomes_Effici ency_Measures_Phase_I.aspx#t=2&s=&p=5%7C.
- 28.Burnham KP, Anderson DR. Model selection and multimodel inference : a practical information-theoretic approach. 2nd ed Springer; New York: 2002. [Google Scholar]
- 29.Bradley EH, Curry L, Horwitz LI, et al. Contemporary evidence about hospital strategies for reducing 30-day readmissions: a national study. J Am Coll Cardiol. 2012 Aug 14;60(7):607–614. doi: 10.1016/j.jacc.2012.03.067. [DOI] [PMC free article] [PubMed] [Google Scholar]
- 30.Schuster MA, Chung PJ, Elliott MN, Garfield CF, Vestal KD, Klein DJ. Awareness and use of California's Paid Family Leave Insurance among parents of chronically ill children. JAMA. 2008 Sep 3;300(9):1047–1055. doi: 10.1001/jama.300.9.1047. [DOI] [PMC free article] [PubMed] [Google Scholar]
- 31.Wennberg JE. Unwarranted variations in healthcare delivery: implications for academic medical centres. BMJ. 2002 Oct 26;325(7370):961–964. doi: 10.1136/bmj.325.7370.961. [DOI] [PMC free article] [PubMed] [Google Scholar]
- 32.The NHS Confederation . Variation in Healthcare: Does it matter and Can Anything be Done? The NHS Confederation; London: 2004. [Google Scholar]
- 33.Ho C, Straatman L. A Review of Pediatric Palliative Care Service Utilization in Children With a Progressive Neuromuscular Disease Who Died on a Palliative Care Program. J Child Neurol. 2012 Mar 23; doi: 10.1177/0883073812439345. doi: 10.1177/0883073812439345. [DOI] [PubMed] [Google Scholar]
- 34.Fung V, Schmittdiel JA, Fireman B, et al. Meaningful variation in performance: a systematic literature review. Med Care. 2010 Feb;48(2):140–148. doi: 10.1097/MLR.0b013e3181bd4dc3. [DOI] [PubMed] [Google Scholar]
- 35.Parker JD, Schoendorf KC. Variation in hospital discharges for ambulatory care-sensitive conditions among children. Pediatrics. 2000 Oct;106(4 Suppl):942–948. [PubMed] [Google Scholar]
- 36.Billings J. Using Administrative Data to Monitor Access, Identify Disparities, and Assess Performance of the Safety Net - Appendix B. [Accessed 15 November 2012];Ambulatory Care Sensitive Conditions. http://archive.ahrq.gov/data/safetynet/billappb.htm.
- 37.Billings J, Zeitel L, Lukomnik J, Carey TS, Blank AE, Newman L. Impact of socioeconomic status on hospital use in New York City. Health Aff (Millwood) 1993 Spring;12(1):162–173. doi: 10.1377/hlthaff.12.1.162. [DOI] [PubMed] [Google Scholar]
- 38.Bautista J. 2012 American Association of Neurology Meeting. New Orleans: 2012. Identifying Reasons for Readmission from the Epilepsy Monitoring Unit Compared to a General Neurology Hospital Service; p. P04.p. 017. [Google Scholar]
- 39.Rice-Townsend S, Hall M, Barnes JN, Baxter JK, Rangel SJ. Hospital readmission after management of appendicitis at freestanding children's hospitals: contemporary trends and financial implications. J Pediatr Surg. 2012 Jun;47(6):1170–1176. doi: 10.1016/j.jpedsurg.2012.03.025. [DOI] [PubMed] [Google Scholar]
- 40.Berry JG, Hall MA, Sharma V, Goumnerova L, Slonim AD, Shah SS. A multi-institutional, 5-year analysis of initial and multiple ventricular shunt revisions in children. Neurosurgery. 2008 Feb;62(2):445–453. 453–444. doi: 10.1227/01.neu.0000316012.20797.04. discussion. [DOI] [PubMed] [Google Scholar]
- 41.Rice-Townsend S, Hall M, Barnes JN, Lipsitz S, Rangel SJ. Variation in Risk-Adjusted Hospital Readmission Following Treatment of Appendicitis at 38 Children's Hospitals: An Opportunity for Collaborative Quality Improvement. Annals of Surgery. doi: 10.1097/SLA.0b013e318268a663. doi: 10.1097/SLA.0b013e318268a663. [DOI] [PubMed] [Google Scholar]
- 42.Castro M, Zimmermann NA, Crocker S, Bradley J, Leven C, Schechtman KB. Asthma intervention program prevents readmissions in high healthcare users. Am J Respir Crit Care Med. 2003 Nov 1;168(9):1095–1099. doi: 10.1164/rccm.200208-877OC. [DOI] [PubMed] [Google Scholar]
- 43.Cheney J, Barber S, Altamirano L, et al. A clinical pathway for bronchiolitis is effective in reducing readmission rates. J Pediatr. 2005 Nov;147(5):622–626. doi: 10.1016/j.jpeds.2005.06.040. [DOI] [PubMed] [Google Scholar]
- 44.Frei-Jones MJ, Field JJ, DeBaun MR. Risk factors for hospital readmission within 30 days: a new quality measure for children with sickle cell disease. Pediatr Blood Cancer. 2009 Apr;52(4):481–485. doi: 10.1002/pbc.21854. [DOI] [PMC free article] [PubMed] [Google Scholar]
- 45.Feudtner C, Pati S, Goodman DM, et al. State-level child health system performance and the likelihood of readmission to children's hospitals. J Pediatr. 2010 Jul;157(1):98–102. e101. doi: 10.1016/j.jpeds.2010.01.049. [DOI] [PubMed] [Google Scholar]
- 46.Joynt KE, Orav EJ, Jha AK. Thirty-day readmission rates for Medicare beneficiaries by race and site of care. JAMA. 2011 Feb 16;305(7):675–681. doi: 10.1001/jama.2011.123. [DOI] [PMC free article] [PubMed] [Google Scholar]
- 47.Hernandez AF, Curtis LH. Minding the gap between efforts to reduce readmissions and disparities. JAMA. 2011 Feb 16;305(7):715–716. doi: 10.1001/jama.2011.167. [DOI] [PubMed] [Google Scholar]
- 48.Jiang HJ, Wier LM. All-Cause Hospital Readmissions among Non-Elderly Medicaid Patients, 2007: Statistical Brief #89. 2006 Feb; [PubMed] [Google Scholar]
- 49.Cassedy A, Fairbrother G, Newacheck PW. The impact of insurance instability on children's access, utilization, and satisfaction with health care. Ambul Pediatr. 2008 Sep-Oct;8(5):321–328. doi: 10.1016/j.ambp.2008.04.007. [DOI] [PubMed] [Google Scholar]
- 50.Zickafoose JS, Gebremariam A, Clark SJ, Davis MM. Medical home disparities between children with public and private insurance. Acad Pediatr. 2011 Jul-Aug;11(4):305–310. doi: 10.1016/j.acap.2011.03.006. [DOI] [PMC free article] [PubMed] [Google Scholar]
- 51.Sommers A, Cunningham PJ. Physician Visits After Hospital Discharge: Implications for Reducing Readmissions. 2011 http://www.nihcr.org/Reducing_Readmissions.pdf.
- 52.Hong R, Baumann BM, Boudreaux ED. The emergency department for routine healthcare: race/ethnicity, socioeconomic status, and perceptual factors. J Emerg Med. 2007 Feb;32(2):149–158. doi: 10.1016/j.jemermed.2006.05.042. [DOI] [PubMed] [Google Scholar]
- 53.Nasir K, Lin Z, Bueno H, et al. Is same-hospital readmission rate a good surrogate for all-hospital readmission rate? Med Care. 2010 May;48(5):477–481. doi: 10.1097/MLR.0b013e3181d5fb24. [DOI] [PubMed] [Google Scholar]
- 54.Bourgeois FC, Olson KL, Mandl KD. Patients treated at multiple acute health care facilities: quantifying information fragmentation. Arch Intern Med. 2010 Dec 13;170(22):1989–1995. doi: 10.1001/archinternmed.2010.439. [DOI] [PubMed] [Google Scholar]
- 55.Campbell SE, Campbell MK, Grimshaw JM, Walker AE. A systematic review of discharge coding accuracy. J Public Health Med. 2001 Sep;23(3):205–211. doi: 10.1093/pubmed/23.3.205. [DOI] [PubMed] [Google Scholar]
Associated Data
This section collects any data citations, data availability statements, or supplementary materials included in this article.