

Abstract
Mammalian cells contain three closely related ras genes, H-ras, K-ras and N-ras. Although, in a given tumor type, oncogenic mutations are selectively observed in only one of the ras genes, the acquisition of the transformed phenotype has been shown to require the contribution of the normal products of the other ras genes. Here we demonstrate that oncogenic K-Ras promotes the activation of wild type H- and N-Ras. This activation is mediated by oncogenic K-Ras-dependent allosteric stimulation of Sos and confers a growth advantage to oncogenic K-Ras harboring cancer cells. These findings underscore the complementary functions of oncogenic and wild type Ras in tumor cells and identify a potential new targeting strategy for Ras-driven tumors.
As bona fide members of the GTPase family, the functional output of Ras proteins depends on their GTP binding status which is dictated by the counteracting actions of guanine nucleotide exchange factors (GEFs) and GTPase activating proteins (GAPs)1. In the absence of oncogenic mutations which compromise the response of Ras to the action of GAPs, the pool size of GTP-bound Ras molecules is thought to be largely controlled by the action of GEFs. The Ras-specific guanine nucleotide exchange factor Son of Sevenless (Sos) plays a key role in regulating Ras activity by catalyzing the exchange of GTP for GDP2. We have previously reported the presence of an allosteric site on Sos which interacts preferentially with Ras-GTP3. This interaction augments the catalytic activity of Sos by affecting conformational changes that release it from its autoinhibited state4. Because oncogenic Ras proteins are constitutively bound to GTP, their interaction with the allosteric site on Sos would be favored4,5. Accordingly, it is plausible that the occupation of the allosteric site on Sos by oncogenic Ras would lead to the enhancement of Sos-mediated activation of wild type (WT) Ras.
In the present study we sought to test this prediction in the context of cancer cells harboring oncogenic K-Ras. We demonstrate that through its ability to allosterically stimulate Sos, oncogenic K-Ras activates WT H- and N-Ras. Moreover, Sos-mediated cross activation of WT Ras by oncogenic K-Ras contributes to cancer cell growth in vitro and in vivo. These results ascribe to Sos a heretofore unappreciated role in controlling the growth potential of cancer cells transformed by oncogenic K-Ras.
Results
Oncogenic K-Ras activates WT Ras through Sos
To examine the capacity of oncogenic K-Ras to activate WT Ras we employed initially an ectopic expression system which affords the selective detection of oncogenic and WT Ras proteins through differential epitope tagging. As shown in Figs. 1a and 1b, the expression of oncogenic K-Ras induced a robust activation of H- and N-Ras. This effect was observed under serum-deprived conditions ruling out the contribution of an oncogenic Ras-dependent autocrine mechanism in which secreted growth factors would promote the activation of WT Ras6-9. We next asked whether the effect of oncogenic K-Ras on the levels of GTP-bound H-Ras could be mediated by Sos. Mammalian cells contain two Sos genes, Sos1 and Sos2, which code for closely related proteins2, 10. Since Sos1 has been defined as the primary GEF for Ras in terms of both abundance and activation11,12, we focused our analysis on Sos1 (hereafter referred to as Sos). As illustrated in Figs. 1c and 1d, the enhancement of H-Ras GTP levels induced by oncogenic K-Ras was abrogated when the expression of endogenous Sos was suppressed by shRNA-mediated silencing. This effect was rescued by the expression of an shRNA-resistant Sos construct (*SosWT; Figs. 1c and 1d) thus excluding the contribution of off-target silencing mechanisms and implicating Sos as an essential intermediate in the cross talk between oncogenic K-Ras and WT H-Ras.
Figure 1. Expression of oncogenic K-Ras promotes the activation of WT H-Ras through the allosteric stimulation of Sos.
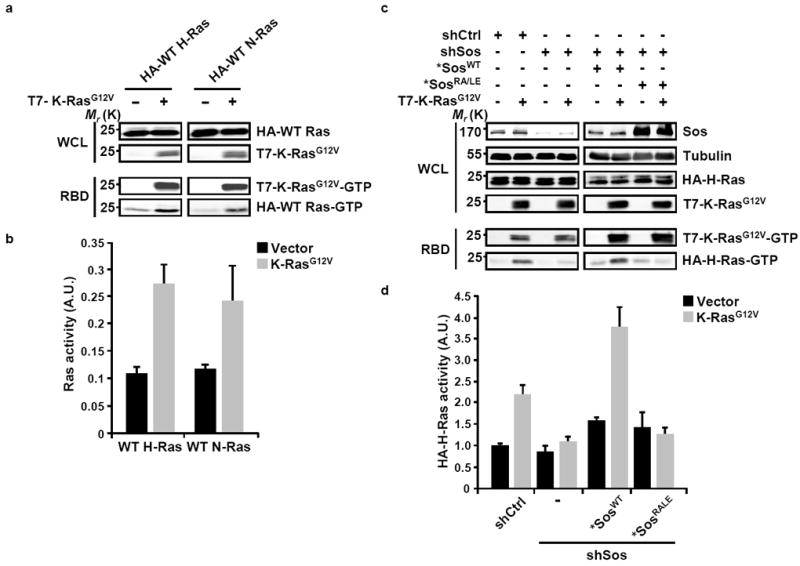
(a) HeLa cells were transfected with HA-tagged wild type (WT) Ras isoforms either alone or with T7-tagged K-RasG12V construct as indicated. Following serum starvation, the levels of GTP-bound WT and oncogenic Ras were determined by the RBD pull-down assay and were detected using anti-HA or anti-T7 antibodies, respectively. (b) The levels of activated Ras were quantified by densitometry scanning and normalized to the total levels of the respective isoform. Values are means +/- SD from three independent experiments. (c) HeLa cells were transfected with pSuper constructs expressing scrambled shRNA (shCtrl) or shRNA targeting Sos (shSos). Cells were selected with blasticidin S for 3 days and then transfected with HA-H-Ras and, as indicated, T7-K-RasG12V constructs in the absence or presence of shRNA-resistant WT or RA/LE Sos constructs (*SosWT and *SosRA/LE). Following serum starvation for 20 h, the levels of GTP-bound HA-H-Ras and T7-K-Ras were determined by the RBD pull-down assay and were detected using anti-HA and anti-T7 antibodies, respectively. (d) Quantification of H-Ras-GTP was carried out by densitometry scanning and data was normalized to the levels of total HA-H-Ras. Values are means +/- SD from three independent experiments presented as fold activation compared to shCtrl vector. For all panels, the efficiency of Sos suppression was analyzed by western blotting and tubulin was used as a loading control. WCL, whole cell lysate; A.U., arbitrary units.
Allosteric stimulation of Sos by oncogenic K-Ras
Under normal growth conditions, the activation of Ras proteins by Sos is an inducible process that is triggered by receptor-ligand interactions13-16. However, the dependence of H-Ras activation by oncogenic K-Ras on Sos was observed under serum-deprivation conditions suggesting that the Sos-mediated cross activation of WT Ras by oncogenic Ras takes place at the post receptor level and could involve the engagement of the allosteric site of Sos by oncogenic K-Ras. To test this idea, we took advantage of a Sos mutant shown previously to be defective in Ras-GTP binding at the allosteric site (*SosRA/LE)4. In contrast to *SosWT, the introduction of *SosRA/LE into cells in which endogenous Sos expression was silenced failed to reconstitute oncogenic K-Ras-induced activation of WT H-Ras (Figs. 1c and 1d). These results support the postulation that oncogenic Ras can upregulate the level of activity of WT Ras by allosteric stimulation of Sos.
To determine whether the interaction of constitutively active K-Ras with the Sos allosteric site is required for WT H-Ras activity in the setting of tumor cells harboring an oncogenic K-Ras allele, we carried out the Sos knock-down/rescue experiments in pancreatic cancer cell lines. As demonstrated in Figs. 2a and 2b, in serum-deprived MIA PaCa-2 cells, the suppression of Sos expression was associated with a pronounced decrease in H-Ras-GTP levels. The reconstitution of *SosWT into the knock-down cells was sufficient to restore H-Ras activity whereas the expression of *SosRA/LE was without an effect on H-Ras-GTP levels. Significantly, the capacity of *SosWT to reinstate H-Ras-GTP levels was abolished when oncogenic K-Ras expression was suppressed, underscoring the dependence of Sos on oncogenic Ras for the activation of WT Ras in cancer cells (Figs. 2c and 2d). Together, these results identify Sos as a molecular scaffold for WT and oncogenic Ras proteins and indicate that this scaffold function is utilized by oncogenic Ras to modulate the activity of WT Ras.
Figure 2. Oncogenic K-Ras-dependent activation of WT H-Ras is mediated by the allosteric stimulation of Sos.
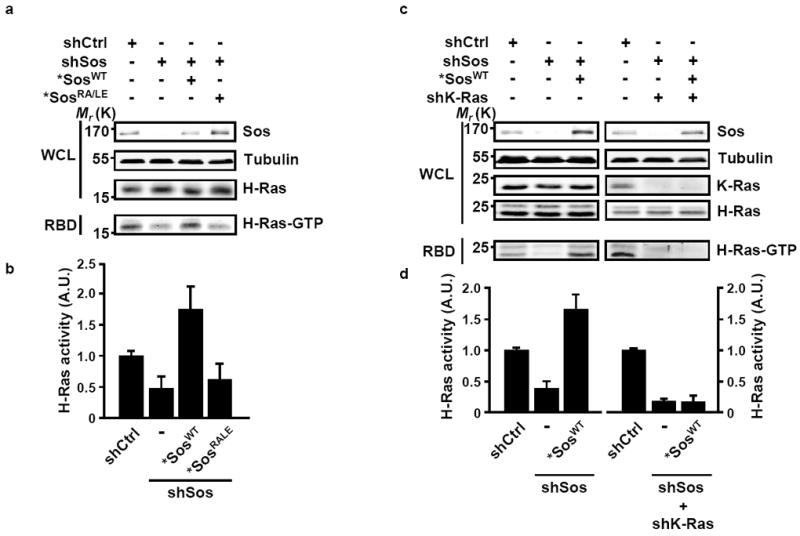
(a) MIA PaCa-2 cells stably expressing inducible miR-30-based shCtrl or shSos were infected with lentiviral inducible *SosWT or *SosRA/LE. Following doxycycline treatment, cells were serum-starved for 20 h and H-Ras-GTP levels were measured using the RBD pull-down assay. (b) The levels of activated Ras were quantified by densitometry scanning and normalized to the levels of total H-Ras. Values are means +/- SD from three independent experiments presented as fold activation compared to shCtrl. (c) MIA PaCa-2 cells stably expressing inducible miR-30-based shCtrl or shSos were infected with lentiviral inducible *SosWT in the presence or absence of shK-Ras. H-Ras-GTP levels were measured using the RBD pull-down assay. (d) The levels of activated Ras were quantified by densitometry scanning and normalized to the levels of total H-Ras. Values are means +/- SD from three independent experiments presented as fold activation compared to shCtrl. For all panels, the efficiency of Sos suppression was analyzed by western blotting and tubulin was used as a loading control. WCL, whole cell lysate; A.U., arbitrary units.
An anticipated corollary of the mechanism described above is that the activity status of WT Ras isoforms would be dependent upon the presence of a mutant isoform. Accordingly, we have found that the silencing of K-Ras expression in pancreatic (AsPC-1, Figs. 3a and 3b; MIA PaCa-2, Figs. 3c and 3d; PL45, Figs. 3e-h) and colon (HCT-116, Figs. 3i and 3j) cancer cells harboring an oncogenic mutation in this allele was accompanied by a reduction in the levels of GTP-bound H-Ras (Figs. 3a-f and 3i-j). N-Ras GTP-levels were subject to the same downregulation following the silencing of K-Ras expression (Figs. 3g and 3h). Although the silencing construct that we have used does not discriminate between the WT and oncogenic alleles of K-Ras, the fact that the suppression of K-Ras expression produced the same effect in cells in which the WT allele of K-Ras is deleted (MIA PaCa-2) is consistent with the loss of function of oncogenic K-Ras being the principle contributor to the observed biochemical phenotype. That the attenuation of H-Ras activity does not reflect an overall reduction in signaling capabilities due to the loss of oncogene expression is indicated by our observation from two independent cell lines that ligand-mediated activation of EGFR and its down stream effector PLCγ are unaffected by the suppression of oncogenic K-Ras expression (Figs. 3k and 3l; Supplementary Fig. S1). Consistent with the postulated role of Sos allosteric modulation by oncogenic K-Ras in dictating the activity of WT H-Ras, the interdependence between oncogenic K-Ras and WT H-Ras was observed in the absence of serum growth factors as all experiments were carried out in cells maintained in serum-free medium. The lack of significant contribution of receptor-mediated activation of WT HRas to its overall GTP-binding levels is also indicated by the fact that growth factor deprivation had no effect on H-Ras activity (Figs. 3m and 3n). Together, these observations implicate oncogenic K-Ras in regulating the activity of WT Ras proteins in cancer cells.
Figure 3. The activity of WT H-Ras is dependent on oncogenic K-Ras.
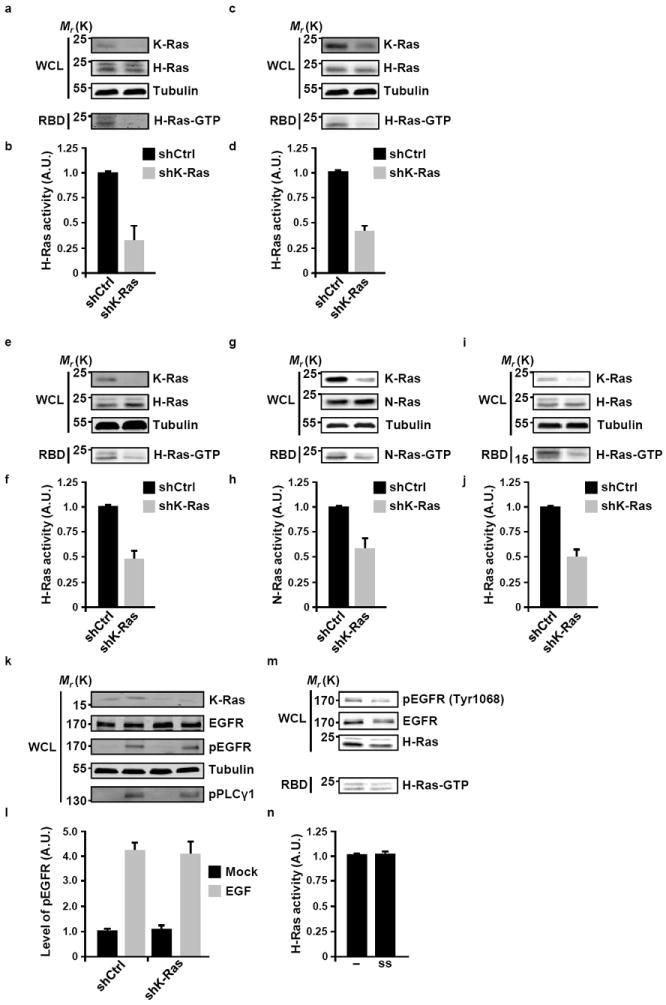
(a-j) Cancer cell lines harboring oncogenic K-Ras derived from pancreas [AsPC-1 (a, b), MIA PaCa-2 (c, d) and PL45 (e-h)] or colon [HCT-116 (i, j)] were infected with lentiviral tetracycline-inducible miR30-based scrambled shRNA (shCtrl) or K-Ras shRNA (shK-Ras). Following doxycycline treatment, cells were serum-starved for 20 hours, and the levels of GTP-bound H-Ras (a-f, i, j) or N-Ras (g, h) were determined by the RBD pull-down assay as described in Methods. The efficiency and specificity of knock-down were analyzed by immunoblotting with anti-K-, H-, or N-Ras antibodies. Quantification of the levels of activated H-Ras (b, d, f, j) or activated N-Ras (h) was done by densitometry scanning and normalized to the levels of total H-Ras or N-Ras, respectively. Values are means +/- SD from three independent experiments presented as fold activation compared to shCtrl. (k) MIA PaCa-2 cells engineered to express shCtrl or shK-Ras as described in (a-j) were serum-starved for 20 hr and then stimulated with 50 ng/ml EGF for 10 min at 37°C. Activation of EGFR signaling was determined by western blotting using anti-phospho-EGFR (Tyr1068) and anti-phospho-PLCγ1 (Tyr783) antibodies. (l) Quantification of the levels of activated EGFR was done by densitometry scanning and normalized to the levels of total EGFR. Values are means +/- SD from three independent experiments presented as fold activation compared to shCtrl (mock). (m) MIA PaCa-2 cells were either cultured in full-serum media (-) or starved by frequent replenishment of serum-free media (ss; change every 2 h for a total 16 h). Cell lysates were probed with the specified antibodies. (n) The levels of GTP-bound H-Ras were determined by RBD pull-down and quantified by densitometry scanning and normalized to the total levels of H-Ras. Values are means +/- SD from three independent experiments presented as fold activation compared to full serum media (-). For all panels, tubulin was used as loading control. WCL, whole cell lysate; A.U., arbitrary units.
Sos contributes to cancer cell growth and signaling
Given the reported contribution of WT Ras isoforms to the transformed phenotype of cancer cells harboring oncogenic Ras17,18, we set out to investigate the significance of Sos-dependent activation of WT Ras by oncogenic Ras for cancer cell growth. To this end, we first monitored the effect of Sos silencing on the growth characteristics of oncogenic K-Ras-harboring cells in culture. The loss of Sos function in MIA PaCa-2 cells maintained in serum-deprived growth medium was associated with a marked decrease in cell expansion (Figs. 4a-d). A similar effect was observed in PL45, CFPAC-1 and AsPC-1 cell lines (Supplementary Fig. S2), suggesting that the dependency on Sos for cancer cell growth might represent a general feature of cancer cells harboring oncogenic Ras. In support of this idea, BxPC-3 and Hs700T cell lines, which harbor only WT Ras proteins, were essentially resistant to the deleterious effect of Sos knock-down on cell growth (Supplementary Fig. S3).
Figure 4. Sos-mediated cross activation of WT Ras by oncogenic K-Ras contributes to pancreatic cancer cell growth.
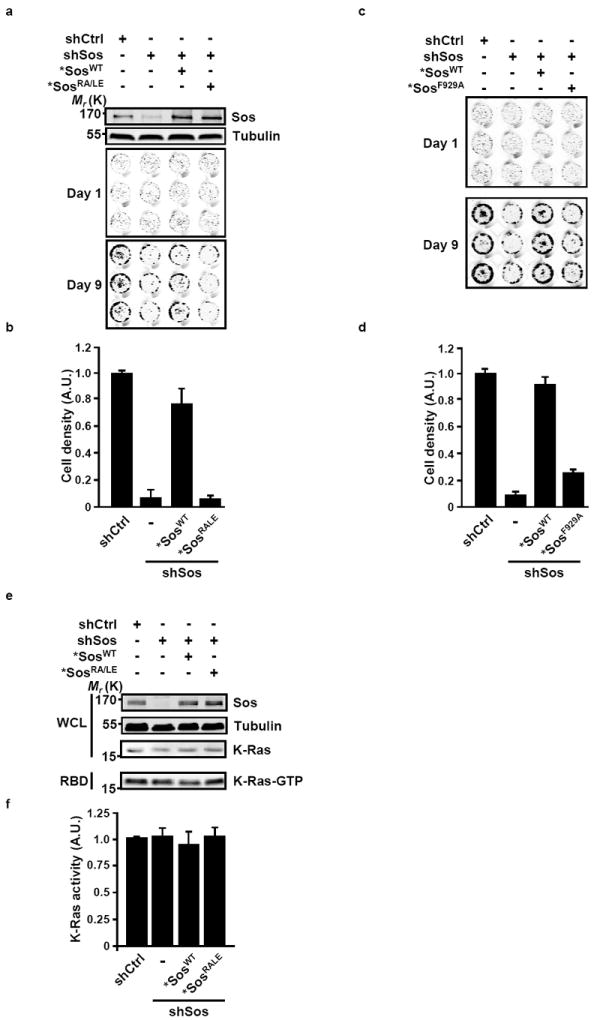
(a-d) MIA PaCa-2 cells engineered as in Figure 2a to express inducible shCtrl, shSos, *SosWT, and *SosRA/LE (a, b) or *SosF929A (c, d) as indicated were cultured in 0.5% serum in the presence of doxycycline for the time indicated. Efficiency of knock-down and ectopic expression of Sos were confirmed by western blotting. Tubulin was used as a loading control. Cell densities were determined by Syto60 staining and quantified (b, d) as described in Methods. Values are means +/- SD of technical triplicates presented as fold activation compared to shCtrl. The experiment shown is representative of three independent experiments. (e, f) Oncogenic K-Ras activity does not depend on the expression of Sos. (e) The levels of K-Ras-GTP in serum-deprived MIA PaCa-2 cells harboring the indicated constructs were determined by the RBD pull down assay. Tubulin was used as a loading control. WCL, whole cell lysate. (f) The levels of activated Ras were quantified by densitometry scanning and normalized to the total levels of K-Ras. Values are means +/- SD from three independent experiments presented as fold activation compared to shCtrl. A.U., arbitrary units.
Oncogenic Ras proteins are stabilized in the GTP-bound form due to their insensitivity to the action of GAPs19. Consistent with this mode of regulation, the levels of GTP-bound oncogenic K-Ras in MIA PaCa-2 cells were not affected by the suppression of Sos expression (Figs. 4e and 4f), indicating that the compromised cell growth observed under these conditions cannot be attributed to a reduction in K-Ras dependent oncogenic output. Furthermore, the growth defect displayed by Sos-deficient MIA PaCa-2, CFPAC-1, AsPC-1 or PL45 cells could be rescued by the re-expression of *SosWT but not *SosRA/LE (Figs. 4a and 4b; Supplementary Fig. S2). The expression of neither *SosWT nor *SosRA/LE altered the levels of GTP-bound oncogenic Ras (Figs. 4e and 4f). In light of our finding that the allosteric stimulation of Sos by oncogenic Ras upregulates the activity of WT Ras (Figs. 2a-d), the differential rescuing capacity of *SosWT and *SosRA/LE indicates that the requirement for Sos to support cancer cell growth relates to its role in mediating the activation of WT Ras by oncogenic Ras. In support of this interpretation, the rescuing capacity of *SosWT was abrogated by the introduction of a mutation shown to impair the catalytic activity of Sos (F929A, ref. 20) (Figs. 4c and 4d).
The two major Ras effector pathways that control cell proliferation and survival are Raf-MEK-ERK and PI3-K-AKT, respectively21,22. The suppression of Sos expression in MIA PaCa-2 and PL45 cells was associated with reduced signaling through the ERK-MAPK signaling axis as indicated by the decrease in the levels of phosphorylated MEK and ERK (Figs. 5a-d; Supplementary Figs. S4a and S4b). The compromised ERK-MAPK signaling capacity in these cells was further indicated by a pronounced reduction in the levels of phosphorylated S6 (Figs. 5a, c; Supplementary Fig. S4a), the substrate of S6 kinase, which is an ERK-mTORC1 target23. In contrast, the activity of the PI3-K-AKT axis was unaffected by the status of Sos expression. Indeed, the sensitivity of ERK-MAPK signaling to the loss of Sos function is consistent with the observed growth impediment of pancreatic cancer cells lacking Sos (Fig. 5e and Supplementary Fig. S4c). The impaired ERK-MAPK signaling axis in Sos-deficient cells was rescued by expression of *SosWT but not *SosRA/LE (Figs. 5a and 5b; Supplementary Fig. S4a) confirming that the alteration of signaling resulting from Sos suppression reflects the impaired activation through the allosteric stimulation of WT Ras by Sos. Significantly, the inhibitory effect of Sos depletion on signaling was completely rescued by the expression of H-RasG12V affirming the link between the GTP-binding status of H-Ras and the ERK-S6 signaling profile in cells harboring oncogenic K-Ras (Figs. 5c and 5d). Similarly, N-RasG12D rescued the inhibitory effect of Sos depletion on signaling indicating that this is not an isoform specific effect (Supplementary Fig. S5). Together, the observation that ERK signaling in cells expressing oncogenic Ras can be manipulated by altering Sos levels represents a departure from the widely held notion that the output of this signaling axis is predominantly dictated by the activity of the oncogenic allele of Ras. Rather, our findings lend support to the idea that the Ras signaling landscape in cancer cells transformed by oncogenic Ras reflects the mutual contribution of the WT and oncogenic alleles.
Figure 5. Sos-mediated cross activation of WT Ras by oncogenic K-Ras contributes to pancreatic cancer cell signaling.
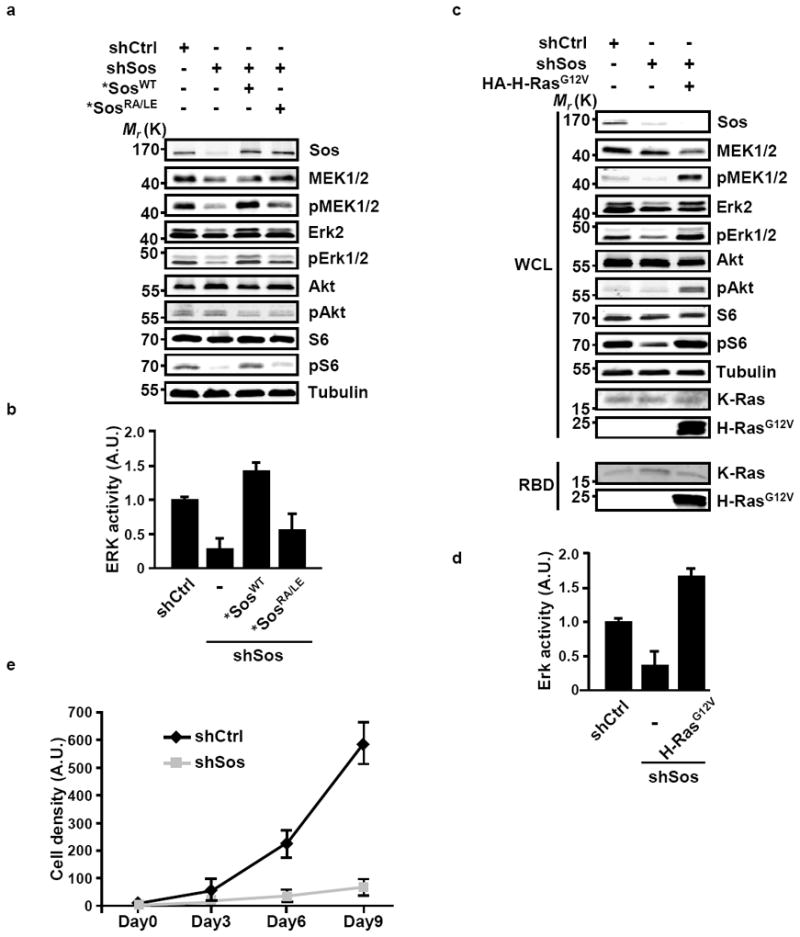
(a-d) MIA PaCa-2 cells which were engineered as in Figure 2a to express inducible shCtrl, shSos, and *SosWT or *SosRA/LE (a, b) or HA-H-RasG12V (c, d) were cultured in 0.5% serum in the presence of doxycycline. Cells were lysed, immunoblotted, and probed with the specified antibodies. WCL, whole cell lysate. Values (b, d) of ERK activity are presented as fold activation compared to shCtrl and represent means +/- SD from three independent experiments. A.U., arbitrary units. (e) Effect of suppression of Sos expression on the kinetics of pancreatic cancer cell growth. MIA PaCa-2 cells expressing shCtrl or shSos were maintained in culture for the indicated intervals. Cell density at each time point was analyzed by Syto60 staining. Values are means +/- SD from three independent experiments. A.U., arbitrary units.
Sos is required for tumor growth
An intriguing possibility raised by the deleterious effect of Sos suppression on pancreatic cancer cell growth is that Sos function is required to support tumorigenic growth. To test this prediction, MIA PaCa-2 cell lines expressing control silencing vector or Sos silencing vector alone or with *SosWT, *SosRA/LE or *SosF929A were injected into nude mice and tumor growth was monitored over time. As demonstrated in Figs. 6a and 6b and Supplementary Fig. S6, tumor formation was nearly abolished in cells depleted of Sos and this effect could be rescued by complementation with *SosWT but not *SosRA/LE or *SosF929A. Consistent with the signaling profile observed in the cell growth experiments, the silencing of Sos expression had no effect on K-Ras GTP levels but was accompanied by a significant reduction in ERK activity (Figs. 6c and 6d). Furthermore, the suppressive effect of Sos silencing on the in vivo growth of MIA PaCa-2 cells was associated with a marked decrease in cell proliferation (Fig. 6e). Together, these observations indicate that Sos-dependent activation of WT Ras by oncogenic Ras is required for tumorigenesis.
Figure 6. Sos-mediated cross activation of WT Ras by oncogenic K-Ras is required for tumor growth.
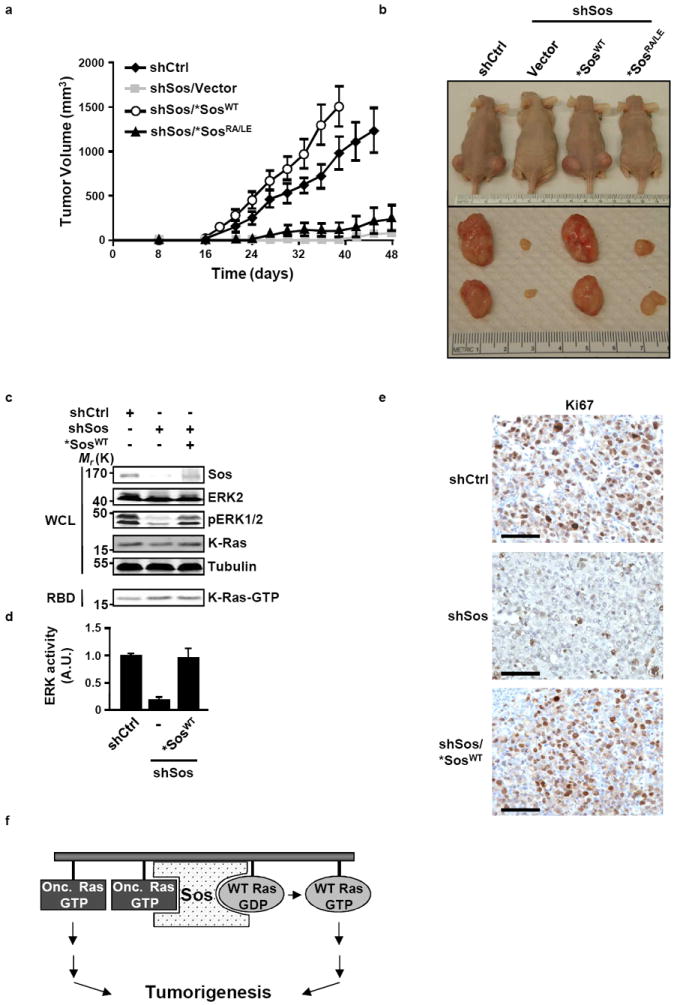
(a) MIA PaCa-2 cells harboring the indicated inducible constructs were injected subcutenously into mice. Following injections, animals were fed doxycyline-containing diet and tumor growth was measured as described in Methods. Values are means +/- SD from three independent experiments. (b) Representative mice and tumors are shown. (c) Signaling analysis of the indicated xenografts. ERK activity was assessed by immunoblotting for pERK and K-Ras-GTP levels were determined by RBD pull down. Tubulin was used as a loading control. (d) Values of ERK activity are presented as fold activation compared to shCtrl and represent means +/- SD from three independent experiments. (e) Cell proliferation of the indicated xenografts as assessed by immunohistochemical staining for Ki-67. Images shown are representative of three independent experiments. Scale bars, 50 μm. (f) Schematic depiction of the role of Sos in oncogenic Ras-driven tumorigenesis. The binding of oncogenic Ras (Onc.) to the allosteric site promotes the activation of WT Ras. The signaling output of both forms of Ras is required for tumorigenesis.
Discussion
The collaboration between oncogenic and WT Ras proteins in promoting the transformed phenotype has been documented in multiple settings and has been attributed predominantly to the distinct but complementary signaling activities of different Ras isoforms17,18, 24-26. By its very nature this heterotypic collaboration is distinct from the antagonistic effects on oncogenic K-Ras and N-Ras ascribed to WT K-Ras27,28 and NRas29, respectively. The present study identifies a previously undescribed mechanism for the co-option of WT Ras proteins by the oncogenic protein which, on the basis of previous structural and biochemical studies3,30, most likely involves the tri-molecular interaction between oncogenic Ras, Sos and WT Ras (Fig. 6f). Each interface of this interaction, namely the allosteric site and the catalytic site of Sos, can in principle be equally recognized by all Ras isoforms with the only provision being that oncogenic Ras would be the preferred ligand for the allosteric site. Thus, this mechanism would be broadly applicable to tumor cells harboring different oncogenic alleles of Ras and should permit the combinatorial activation of all Ras isoforms. Furthermore, the essential role that this Sos-mediated cross activation mechanism plays in tumorigenesis points to a cancer cell vulnerability that might be amenable to therapeutic targeting.
Methods
General reagents
Epidermal growth factor (EGF) was from Invitrogen. Glutathione Sepharose was from GE Healthcare. The antibodies used for immunohistochemistry and Western blot analyses were from the following sources: anti-HA 12CA5 and anti-Sos1 (C-terminus) were from Upstate; anti-T7 was from Novagen; anti-EGFR, anti-H-Ras (C-20), anti-N-Ras (F155), and anti-K-Ras (F234) were from Santa Cruz; anti-tubulin was from Sigma; anti-MEK1/2, anti-phospho-MEK1/2 (Ser217/221), anti-ERK2, anti-phospho-ERK1/2 (Thr202/Tyr204), anti-AKT, anti-phospho-AKT (Ser473), anti-S6, anti-phospho-S6 (Ser240/244), and anti-phospho-EGFR (Tyr1068) were purchased from Cell Signaling; anti-Ki-67 was from Vector Labs; phospho-PLCγ1 (Tyr783) was a kind gift from Dr. Mark Philips.
Plasmids
Mammalian expression vectors of pCGT-K-RasG12V, pCGN-H-RasG12V, pCGT-N-RasG12D and pCGN- H-Ras and N-Ras isoforms have been previously described30. The constructs for RNAi were generated with either the pcDNA6/SUPER vector (a kind gift from Dr. Gwuanwei Du, University of Texas at Houston)30 or constructed into the doxycyline-inducible version of pTRIPZ according to the manufacturer’s protocol (Open Biosystems). The oligonucleotides used for cloning contained the following target sequences or scrambled sequence (shCtrl): for shSos (targets both hSos1 and hSos2), 5’-GACAGTGTTGTAATGAATT-3’; for shK-Ras, 5’-GGAGGGCTTTCTTTGTGTATTT-3’; for shCtrl, 5’-GGCAGATACTCTGATAAAT-3’. The shRNA-resistant full-length Sos constructs were generated by introducing the following nucleotide substitutions (underlined) into the Sos sequence and cloned into pCGN vector or the doxycycline-inducible pLenti CMV/TO vector (Addgene): for *SosRA/LE, 5’-CAGCCTGTGCAAGAGGCAGTATTAAATGTATGTCGG-3’; for *SosWT, 5’-GAAAAGACATTGGGCAATGCTGCAACGAGTTTATAATGGAAGG-3’; for *SosF929A, 5’-CCACCATGTGTGCCTGCCTTTGGAATTTATCTC-3’.
Cell culture Transfection and Lentiviral Infection
HeLa cells, human pancreatic cancer cell lines MIA PaCa-2 (KRas 34G>T), BxPC-3 (KRas, no mutation), Hs700T (KRas, no mutation), PL45 (KRas 35G>A), CFPAC-1 (KRas 35G>T) and AsPC-1 (KRas 35G>A), and the colon cancer cell line HCT-116 (KRas 38G>A) were cultured as specified by ATCC (Manassas, VA). For transient expression in HeLa cells, transfection of pSUPER constructs of scrambled (shCtrl) or shSos were performed with Lipofectamine 2000 (Invitrogen) according to the manufacturer’s directions. After 24 hr of expression, the media was replaced with fresh media supplemented with 10 μg/ml Blasticidin (Invitrogen). Three days after selection, cells were co-transfected with Ras or Sos as indicated. After 16 hr of expression, the cells were serum-starved for 20 hr and then collected. Generation of lentivirus was done according to standard protocols. Briefly, 293T cells were plated in a 10-cm dish for 12-16 hr. One hour prior to transfection by the calcium phosphate method, media was replaced with fresh media. 20 μg of lentiviral vector, 13 μg of packaging vector and 7 μg of envelope plasmid were diluted into 500 μl 2XHBS (0.28M sodium chloride, 0.05M HEPES [4-(2-hydroxyethyl)-1-piperazineethanesulfonic acid], 1.5mM Na2HPO4, pH 7.0). While gently vortexing this solution, 500 μl of 0.25M calcium chloride was added, dropwise, over a period of 1 min. The mixture was incubated for 20 minutes. All solutions and steps were at room temperature. The DNA precipitate was then added slowly, dropwise, to the cells and incubated at 37°C, 5% CO2, for 7 hr at which time the complex was aspirated and 9 ml of fresh media was added. The next day the virus containing media was collected and stored at 4C. 6 ml of fresh media was added. The next day the virus containing media was collected, pooled with that of the previous day, centrifuged at 2500 rpm, filtered through a 0.45 micron syringe, and concentrated using a 100 kDa molecular weight cutoff Amicon filter (Millipore). Aliquots were stored at -80C.
For knock-down experiments in MIA PaCa-2, BxPC-3, PL45, AsPC-1 and HCT-116 cells, cells were infected (multiplicity of infections for cell lines: Mia PaCa-2, 5; all others, 10) with pTripz constructs of shCtrl, shSos or shK-Ras and selected with puromycin (Calbiochem; for AsPC-1, 4 μg/ml; for all others, 2 μg/ml) for 4 days. Where indicated in the figures, lentiviral *SosWT, *SosRA/LE or *SosF929A or HRasG12V constructs were then transduced. shRNA and Sos expression were induced for 3 days with doxycycline (2 μg/ml; Sigma). The cells were serum-starved for 20 hr prior to analysis.
Ras Activity Assay and Immunoblot Analysis
The levels of active, GTP-loaded Ras were determined by GST-Raf-RBD pull-down assay. In brief, GST-Raf-RBD fusion proteins expressed in E. coli were purified by incubation with glutathione agarose beads. Cells were collected in RBD lysis buffer containing 25 mM Tris-HCl (pH 7.4), 120 mM NaCl, 10 mM MgCl2, 1 mM EDTA, 10% glycerol, 10 μg/ml pepstatin, 50 mM NaF, 1% aprotinin, 10 μg/ml leupeptin, 1 mM Na3VO4, 10 mM benzamidine, 10 μg/ml soybean trypsin inhibitor, 1% NP40, and 0.25% sodium deoxycholic acid. The samples were then centrifuged, and supernatants were incubated with 20 μg GST-Raf-RBD immobilized beads for 1.5 hr at 4°C. Bound proteins were eluted with SDS sample buffer, separated by SDS-15% PAGE, and transferred to nitrocellulose membrane. The proteins were detected by immunoblotting with the indicated antibodies. The levels of Ras activation, phospho-MEK1/2, phospho-ERK, phospho-S6, phospho-AKT, phospho-EGFR, phospho-PLCγ1, Sos1 or tubulin were determined using the Odyssey infrared system (Li-Cor). Relative ERK phosphorylation or Ras activation was quantified by Odyssey V2.1 software (Li-Cor) and normalized to ERK or Ras expression.
Cell Growth Assay
The cell growth assay was carried out by nucleic acid staining with Syto60 (Invitrogen) dye. Cells were prepared to express inducible shRNA and Sos as described above. Cells were treated with doxycycline for three days then equal cell numbers were plated in 96-well plates and maintained in doxycycline. At the times indicated, cells were fixed with 3.7% formaldehyde for 20 min, washed three times with PBS, permeabilized with 0.1% triton X-100 (in PBS) for 5 min, and blocked with 0.1% BSA (in PBS) for 5 min. Cells were then stained with 1 μM Syto60 dye (prepared in block solution) for 1 hr in the dark. Cells were washed twice with PBS. All steps were carried out at room temperature. Fluorescence was quantified using the Odyssey infrared system (LiCor) in the IR700 channel. Cells were harvested for western blot analysis.
Athymic Nude Mice Tumor Formation
MIA PaCa-2 cells were engineered to express inducible shRNA and *SosWT, *SosRA/LE or *SosF929A constructs as described above. One million cells mixed equally with Matrigel (BD Biosciences) were injected (0.1 ml) subcutaneously into each flank of four 8-week-old female athymic nude mice NCr nu/nu (Taconic). After injection, mice were fed a diet containing doxycycline (1 g/kg). When palpable, tumors were measured with a caliper every 3 days, and tumor volume was calculated by 0.5 × L × W2. When tumors reached a maximum volume (1500 mm3), mice were euthanized and tumors were excised and photographed. To prepare lysates, tumor tissue was homogenized in RBD lysis buffer and then processed for immunoblot and GST-Raf-RBD pull-down assay. All mice were euthanized by 7 weeks post-injection. All animal work was approved by New York University Langone Medical Center Institutional Animal Care and Use Committee.
Histology and Immunohistochemistry
Excised tumors were fixed with 10% buffered formalin, dehydrated in ethanol, and then embedded with paraffin. For immunohistochemistry, five-micrometer-cut sections were deparaffinized, rehydrated in graded ethanol, quenched in 0.6% hydrogen peroxide/methanol for 15 min, and antigens were boiled for 15 min in a microwave oven in 10 mM sodium citrate (pH 6.0) for antigen retrieval. Sections were blocked with 5% serum/1% BSA/0.5% Tween-20 for 1 hr. Slides were incubated with primary antibody (Ki-67 antibody, 0.8 μg/ml) diluted in blocking buffer 1 hr at room temperature. Following the primary antibody, slides were incubated with biotinylated secondary antibodies (Vector Laboratories) followed by ABC solution (Vector Laboratories) and developed with 3,3′-diaminobenzidine tetrahydrochloride for 15 min. Slides were counterstained with hematoxylin, dehydrated, and mounted with Permount (Fisher). Slides were examined on a Nikon Eclipse 80i microscope.
Statistical Analysis
Error bars of experiments performed in triplicate or more indicate standard deviation. Statistical calculations were performed with Microsoft Excel analysis tools.
Supplementary Material
Acknowledgments
We thank members of the Bar-Sagi laboratory for helpful discussions. This work was supported by research grants from National Institutes of Health to D.B.-S. (GM078266 and CA055360).
Footnotes
Author contributions
D.B.-S. and H.-H.J. conceived the study. H.-H.J. performed the experiments. L.J.T. assisted with data analysis and manuscript preparation.
Competing financial interests
The authors declare no competing financial interests.
References
- 1.Bos JL, Rehmann H, Wittinghofer A. GEFs and GAPs: critical elements in the control of small G proteins. Cell. 2007;129:865–77. doi: 10.1016/j.cell.2007.05.018. [DOI] [PubMed] [Google Scholar]
- 2.Chardin P, et al. Human Sos1: a guanine nucleotide exchange factor for Ras that binds to GRB2. Science. 1993;260:1338–43. doi: 10.1126/science.8493579. [DOI] [PubMed] [Google Scholar]
- 3.Margarit SM, et al. Structural evidence for feedback activation by Ras.GTP of the Ras-specific nucleotide exchange factor SOS. Cell. 2003;112:685–95. doi: 10.1016/s0092-8674(03)00149-1. [DOI] [PubMed] [Google Scholar]
- 4.Sondermann H, et al. Structural analysis of autoinhibition in the Ras activator Son of sevenless. Cell. 2004;119:393–405. doi: 10.1016/j.cell.2004.10.005. [DOI] [PubMed] [Google Scholar]
- 5.Gureasko J, et al. Membrane-dependent signal integration by the Ras activator Son of sevenless. Nat Struct Mol Biol. 2008;15:452–61. doi: 10.1038/nsmb.1418. [DOI] [PMC free article] [PubMed] [Google Scholar]
- 6.Buick RN, Filmus J, Quaroni A. Activated H-ras transforms rat intestinal epithelial cells with expression of alpha-TGF. Exp Cell Res. 1987;170:300–9. doi: 10.1016/0014-4827(87)90308-9. [DOI] [PubMed] [Google Scholar]
- 7.Ciardiello F, et al. Expression of transforming growth factor alpha (TGF alpha) in breast cancer. Ann Oncol. 1991;2:169–82. doi: 10.1093/oxfordjournals.annonc.a057897. [DOI] [PubMed] [Google Scholar]
- 8.Dlugosz AA, et al. Autocrine transforming growth factor alpha is dispensible for v-rasHa-induced epidermal neoplasia: potential involvement of alternate epidermal growth factor receptor ligands. Cancer Res. 1995;55:1883–93. [PubMed] [Google Scholar]
- 9.Grana TM, Sartor CI, Cox AD. Epidermal growth factor receptor autocrine signaling in RIE-1 cells transformed by the Ras oncogene enhances radiation resistance. Cancer Res. 2003;63:7807–14. [PubMed] [Google Scholar]
- 10.Bowtell D, Fu P, Simon M, Senior P. Identification of murine homologues of the Drosophila son of sevenless gene: potential activators of ras. Proc Natl Acad Sci U S A. 1992;89:6511–5. doi: 10.1073/pnas.89.14.6511. [DOI] [PMC free article] [PubMed] [Google Scholar]
- 11.Nielsen KH, Papageorge AG, Vass WC, Willumsen BM, Lowy DR. The Ras-specific exchange factors mouse Sos1 (mSos1) and mSos2 are regulated differently: mSos2 contains ubiquitination signals absent in mSos1. Mol Cell Biol. 1997;17:7132–8. doi: 10.1128/mcb.17.12.7132. [DOI] [PMC free article] [PubMed] [Google Scholar]
- 12.Kamioka Y, Yasuda S, Fujita Y, Aoki K, Matsuda M. Multiple decisive phosphorylation sites for the negative feedback regulation of SOS1 via ERK. J Biol Chem. 2010;285:33540–8. doi: 10.1074/jbc.M110.135517. [DOI] [PMC free article] [PubMed] [Google Scholar]
- 13.Buday L, Downward J. Epidermal growth factor regulates p21ras through the formation of a complex of receptor, Grb2 adapter protein, and Sos nucleotide exchange factor. Cell. 1993;73:611–20. doi: 10.1016/0092-8674(93)90146-h. [DOI] [PubMed] [Google Scholar]
- 14.Gale NW, Kaplan S, Lowenstein EJ, Schlessinger J, Bar-Sagi D. Grb2 mediates the EGF-dependent activation of guanine nucleotide exchange on Ras. Nature. 1993;363:88–92. doi: 10.1038/363088a0. [DOI] [PubMed] [Google Scholar]
- 15.Li N, et al. Guanine-nucleotide-releasing factor hSos1 binds to Grb2 and links receptor tyrosine kinases to Ras signalling. Nature. 1993;363:85–8. doi: 10.1038/363085a0. [DOI] [PubMed] [Google Scholar]
- 16.Egan SE, et al. Association of Sos Ras exchange protein with Grb2 is implicated in tyrosine kinase signal transduction and transformation. Nature. 1993;363:45–51. doi: 10.1038/363045a0. [DOI] [PubMed] [Google Scholar]
- 17.Hamilton M, Wolfman A. Ha-ras and N-ras regulate MAPK activity by distinct mechanisms in vivo. Oncogene. 1998;16:1417–28. doi: 10.1038/sj.onc.1201653. [DOI] [PubMed] [Google Scholar]
- 18.Lim KH, Ancrile BB, Kashatus DF, Counter CM. Tumour maintenance is mediated by eNOS. Nature. 2008;452:646–9. doi: 10.1038/nature06778. [DOI] [PMC free article] [PubMed] [Google Scholar]
- 19.Bos JL. ras oncogenes in human cancer: a review. Cancer Res. 1989;49:4682–9. [PubMed] [Google Scholar]
- 20.Hall BE, Yang SS, Boriack-Sjodin PA, Kuriyan J, Bar-Sagi D. Structure-based mutagenesis reveals distinct functions for Ras switch 1 and switch 2 in Sos-catalyzed guanine nucleotide exchange. J Biol Chem. 2001;276:27629–37. doi: 10.1074/jbc.M101727200. [DOI] [PubMed] [Google Scholar]
- 21.McCubrey JA, et al. Roles of the Raf/MEK/ERK pathway in cell growth, malignant transformation and drug resistance. Biochim Biophys Acta. 2007;1773:1263–84. doi: 10.1016/j.bbamcr.2006.10.001. [DOI] [PMC free article] [PubMed] [Google Scholar]
- 22.Engelman JA. Targeting PI3K signalling in cancer: opportunities, challenges and limitations. Nat Rev Cancer. 2009;9:550–62. doi: 10.1038/nrc2664. [DOI] [PubMed] [Google Scholar]
- 23.Ma L, Chen Z, Erdjument-Bromage H, Tempst P, Pandolfi PP. Phosphorylation and functional inactivation of TSC2 by Erk implications for tuberous sclerosis and cancer pathogenesis. Cell. 2005;121:179–93. doi: 10.1016/j.cell.2005.02.031. [DOI] [PubMed] [Google Scholar]
- 24.Yan J, Roy S, Apolloni A, Lane A, Hancock JF. Ras isoforms vary in their ability to activate Raf-1 and phosphoinositide 3-kinase. J Biol Chem. 1998;273:24052–6. doi: 10.1074/jbc.273.37.24052. [DOI] [PubMed] [Google Scholar]
- 25.Voice JK, Klemke RL, Le A, Jackson JH. Four human ras homologs differ in their abilities to activate Raf-1, induce transformation, and stimulate cell motility. J Biol Chem. 1999;274:17164–70. doi: 10.1074/jbc.274.24.17164. [DOI] [PubMed] [Google Scholar]
- 26.Fotiadou PP, Takahashi C, Rajabi HN, Ewen ME. Wild-type NRas and KRas perform distinct functions during transformation. Mol Cell Biol. 2007;27:6742–55. doi: 10.1128/MCB.00234-07. [DOI] [PMC free article] [PubMed] [Google Scholar]
- 27.To MD, et al. Kras regulatory elements and exon 4A determine mutation specificity in lung cancer. Nat Genet. 2008;40:1240–4. doi: 10.1038/ng.211. [DOI] [PMC free article] [PubMed] [Google Scholar]
- 28.Matallanas D, et al. Mutant K-Ras Activation of the Proapoptotic MST2 Pathway Is Antagonized by Wild-Type K-Ras. Mol Cell. 2011;44:893–906. doi: 10.1016/j.molcel.2011.10.016. [DOI] [PubMed] [Google Scholar]
- 29.Diaz R, et al. The N-ras proto-oncogene can suppress the malignant phenotype in the presence or absence of its oncogene. Cancer Res. 2002;62:4514–8. [PubMed] [Google Scholar]
- 30.Boykevisch S, et al. Regulation of ras signaling dynamics by Sos-mediated positive feedback. Curr Biol. 2006;16:2173–9. doi: 10.1016/j.cub.2006.09.033. [DOI] [PubMed] [Google Scholar]
Associated Data
This section collects any data citations, data availability statements, or supplementary materials included in this article.