

Summary
Sleep apnea is a serious condition that afflicts many individuals and is associated with serious health complications. Polysomnography, the gold standard for assessing and diagnosing sleep apnea, uses breathing sensors that are intrusive and can disrupt the patient’s sleep during the overnight testing. We investigated the use of breathing signals derived from non-contact force sensors (i.e. load cells) placed under the supports of the bed as an alternative to traditional polysomnography breathing sensors (e.g. nasal pressure, oral-nasal thermistor, chest belt, and abdominal belt). The Apnea-Hypopnea Index estimated using the load cells was not different than that estimated using standard polysomnography leads (t44 = 0.37, p = 0.71). Overnight polysomnography sleep studies scored using load cell breathing signals had an intra-class correlation coefficient of 0.97 for the Apnea-Hypopnea Index and an intra-class correlation coefficient of 0.85 for the Respiratory Disturbance Index when compared to scoring using traditional polysomnography breathing sensors following American Academy of Sleep Medicine guidelines. These results demonstrate the feasibility of using unobtrusive load cells installed under the bed to measure the Apnea-Hypopnea Index.
Keywords: sleep apnea, polysomnography, respiratory effort, non-contact sensors, unobtrusive sleep monitoring, load cells
Introduction
Sleep apnea is a condition that has serious health and financial implications. It is estimated that 9% of middle aged women and 24% of middle aged men have an Apnea Hypopnea Index (AHI) of 5 or greater (Young et al., 1993). Obstructive sleep apnea is associated with several cardiovascular complications such as hypertension, myocardial dysfunction, coronary artery disease, and cardiac arrhythmias (Redline et al., 2007). Sleep apnea may also be associated with depression, have some neuropsychological effects, lead to structural changes in the brain, and have some impact on one’s quality of life (Baldwin et al., 2001, Beebe et al., 2003, Joo et al., 2010, Macey et al., 2008, Peppard et al., 2006, Yang et al., 2000). Individuals with obstructive sleep apnea may also have a higher risk of being involved in a motor-vehicle collision (Sassani et al., 2004). Polysomnography (PSG) is the traditional standard for diagnosing and monitoring individuals with sleep apnea; however, the nasal pressure cannulas, oral thermistor, chest belt and abdomen belt used to detect patient breathing are obtrusive. Furthermore, maintaining the correct placement with these leads can sometimes be problematic. Sleep architecture, sleep efficiency, REM latency and duration, and EEG spectral power are altered during the first night or first few nights of PSG (Agnew et al., 1966, Curcio et al., 2004). This first night effect has been suggested to be caused in part by the discomfort and restricted movement resulting from numerous leads placed on the patient (Le Bon et al., 2001). Therefore, a less obtrusive method for detecting accurate respiration information is of interest.
One alternative to body-worn leads is the use of load cells installed under the supports of the bed (Brink et al., 2006, Paalasmaa et al., 2011). Load cells are force sensors that continuously and independently measure the weight supported by each leg of the bed. The load cells are sensitive enough to pick up small fluctuations in weight at the various bed supports that result from slight mass displacements on the bed due to the patient’s breathing. In previous work, we have shown that apneic events are distinguishable from normal, quiet breathing using automated classification of segmented load cell signals (Beattie et al., 2009). However, it is unknown if the signal from the load cells could be used in the PSG montage to allow visual scoring of American Academy of Sleep Medicine (AASM) defined apneic and hypopneic events.
We report on the use of load cells in a sleep laboratory to detect sleep apnea. We compare the scoring of routine AASM compliant polysomnographic data to scoring of the same data with replacement of all flow and effort channels with load cell channels.
Methods
The load cell system consists of pressure sensors (i.e. load cells) that are placed under the supports of a bed. The load cells detect movement on the bed as fluctuations in the forces supported by each of the bed legs. The signals from the different load cells are combined to create a breathing signal. First, the combination of all movements on the bed can be represented in the load cell signals by summing the output of each load cell under each support of the bed. Second, the different outputs from each load cell can be used to calculate the time dependent center of pressure as described in (Beattie et al., 2011). This allows the load cells to detect the breathing of an individual on the bed by tracking the changes in the center of mass caused by abdominal organs being displaced by the diaphragm toward the foot of the bed on inspiration and then toward the head of the bed on exhalation (see Fig. 1). The load cell breathing trace is the result of low pass filtering the load cell center of pressure signal in the y-direction (i.e. along the long axis of the bed). The load cell data for this study was collected from load cells that were placed under each of the 5 supports of a bed at the Pacific Sleep Program sleep lab (Portland, OR, USA).
Figure 1.

(A–B) Illustration of how the load cells detect breathing via small mass (M) displacements. As an individual lies on the bed, the load cells detect the forces supported by each bed leg. (A) During inspiration mass is displaced towards the foot of the bed. (B) During expiration mass is displaced towards the head of the bed. (C) An example of a load cell breathing signal from a patient is shown. Periods of inspiration are marked in red and periods of expiration are marked in black.
Patients gave informed written consent to the study (OHSU Institutional Review Board eIRB 6308), and then their overnight PSG data was collected concurrently with their load cell data. PSG data was collected using Datalab, Rembrandt 9.0 (Embla 2008) and initially scored in accordance with current AASM guidelines using Analysis Manager, Rembrandt 9.0 (Embla 2008). An experienced polysomnographic technologist used AASM rules for the scoring of AASM defined Central apnea, Mixed apnea, Obstructive apnea, and Hypopnea. The sum of scored apneas and hypopneas were divided by total sleep time to generate the AHI-PSG. For determining hypopneas, rule IV.A was used (requiring a 4% desaturation). Optional rule IV.C scoring of Respiratory Effort Related Arousals (RERA) was applied to label discernible reductions in airflow associated with arousal that did not meet criteria for other events. The total of these events were combined with the sum of apneas and hypopneas and divided by total sleep time to obtain the Respiratory Disturbance Index (RDI-PSG).
Apnea patients were then classified by their Apnea-Hypopnea Index (AHI) as having negative (AHI<5), mild (5 ≤ AHI < 15), or moderate-severe (AHI≥ 15) apnea based on their PSG results. Fourteen records were selected for the negative group, 16 records were selected for the mild group, and 15 records were selected for the moderate-severe group (45 patients in total). The data for all 45 records were anonymized and converted to European Data Format (EDF). All channels related to airflow or respiratory effort were removed from the PSG record (nasal pressure, oral-nasal thermistor, chest belt, and abdominal belt). The remaining tracings from the routine 16 channel montage were integrated with load cell tracings to create a load cell montage (LC montage) (see Fig. 2).
Figure 2.

Screen shots comparing the scoring montages used for scoring with typical PSG signals (upper) and with load cell breathing signals (lower). The screen shots were taken from the same 120 seconds for both scoring results from one patient. The nasal pressure, oral-nasal thermistor, chest belt, and abdominal belt are colored purple in the PSG scoring montage (upper), and the load cell breathing signals are similarly colored purple in the load cell scoring montage (lower). The load cell tracing “All_Sum_HP” is the summation of all the load cells, and the “COP_Y_HP” is the center of pressure load cell signal. The purple, horizontal boxes in both cases indicate the locations of scored respiratory events.
The same scorer subsequently scored blindly the integrated load cell record at least 5 months after scoring the initial PSG, using Analysis Manager Rembrandt 9.0 (Embla 2008). Standard AASM respiratory event scoring rules for routine scoring were applied for duration of event and percentage reduction in the load cell (LC) tracing excursion. A 30% to 90% reduction in the LC excursion for greater than 10 seconds associated with a 4% desaturation was scored as obstructive hypopnea (OH-LC). A reduction of the LC excursion of 90% or greater for more than 10 seconds was scored as obstructive apnea (OA-LC). Absence of LC excursion for greater than 10 seconds duration was scored as central apnea (CA-LC). Load cell examples of actual respiratory events from each category (OH-LC, OA-LC, & CA-LC) scored by the technologist are shown in Fig. 3. AHI-LC was determined from the number of events (OH-LC, OA-LC, and CA-LC) per hour of sleep. Discernible reductions in the excursion for 10 seconds or greater duration associated with an EEG arousal that did not meet criteria for other events were scored as a RERA (RERA-LC). The number of RERA-LC was summed with the combined number of OH-LC, OA-LC, and CA-LC, and this overall total was divided by total sleep time in order to calculate the RDI-LC.
Figure 3.
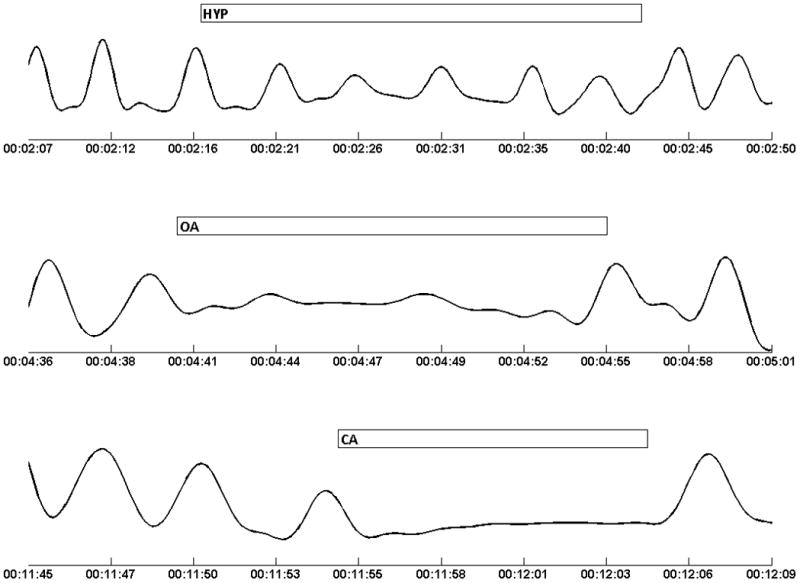
Segments of the load cell breathing signal from a single patient illustrating the scoring of respiratory events using the load cell trace. (Upper) A scored hypopnea showing a slight reduction in the excursion of the load cell signal. (Middle) A scored obstructive apnea showing a major reduction in the excursion of the load cells signal. However, some LC excursion appears to still be present suggesting breathing effort may still exist. (Lower) A scored central apnea showing a complete absence of excursion in the load cell signal.
Analysis
Differences between AHI severity group characteristics (specifically age, BMI, and sex) were examined using a multivariate analysis of variance (MANOVA) with the AHI group as the fixed effect. The dependence of the LC scoring accuracy on BMI was examined using linear regression and a t statistic to test whether resulting slope was different from 0. The log transformed absolute difference between PSG scoring and load cell scoring for both AHI and RDI (i.e. scoring error) was regressed against BMI for this analysis. Comparison of the traditional PSG to LC scoring was analyzed using linear correlation, a paired t-test, and 95% confidence intervals for the difference between the two scorings. Finally, the accuracy of scoring the AHI severity of patients using the load cell montage was assessed using sensitivity and specificity.
Results
The overall demographic information and the apnea class specific demographics are contained in Table 1. Overall, there were significant differences in demographics between the groups (p=0.02). Post-hoc tests revealed that this was due primarily to the younger age of the low AHI group compared to the high AHI group. The intra-class correlation coefficient (ICC) for AHI was 0.97 with a 95% confidence interval of [0.95 0.98]; the ICC for RDI was 0.85 with a 95% confidence interval of [0.66 0.93]. The AHI estimated by PSG was on average only 0.4 larger than that estimated using load cells, which was not significant (t44 = 0.37, p = 0.71 with a 95% confidence interval of [−1.67 2.42]). In contrast, the RDI estimated from the LC montage was on average 7.7 greater than that obtained using the PSG montage; this difference was significant (t44 = −3.89, p <0.001) with a 95% confidence interval of [−11.7 −3.70]. Although there were differences in the absolute estimates of AHI and RDI, the PSG and LC scoring were strongly correlated for both AHI and RDI (Pearson’s correlation coefficient 0.97 and 0.89 respectively). Least square linear fits for AHI and RDI comparing PSG and LC scoring are shown in Fig. 4. Agreement between the two scoring modalities is shown using Bland-Altman plots in Fig. 5.
Table 1.
Demographic information for all patients. Values are reported as mean ± standard deviation.
| Gender (M/F) | Age (years) | BMI (kg/m2) | |
|---|---|---|---|
| AHI < 5 | 6/8 | 43.9 ± 13.6* | 29.8 ± 7.1 |
| 5 ≤ AHI <15 | 10/6 | 52.4 ± 13.2 | 33.4 ± 6.5 |
| AHI ≥ 15 | 11/4 | 56.1 ± 13.8* | 33.7 ± 6.0 |
|
| |||
| Overall | 27/18 | 51.0 ± 14.2 | 32.3 ± 6.6 |
Figure 4.
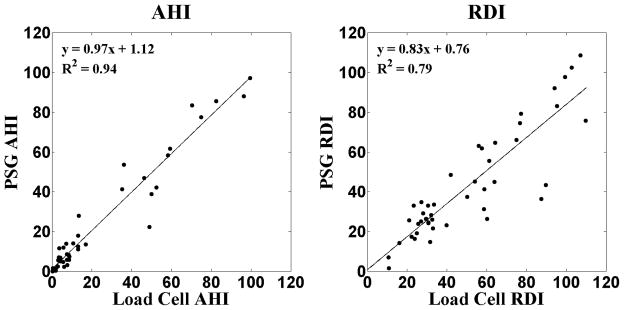
Linear least squares regression plots for AHI-LC vs. AHI-PSG and RDI-LC vs. RDI-PSG.
Figure 5.
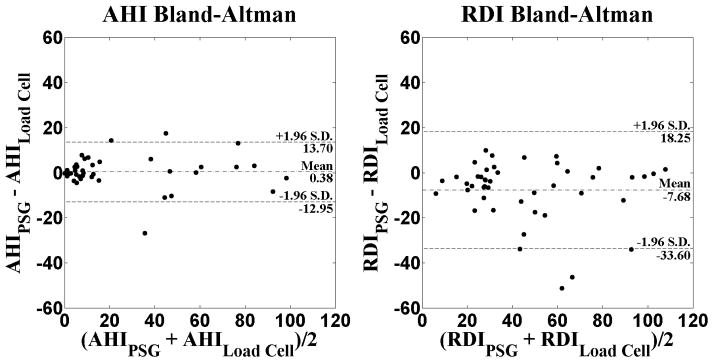
Bland-Altman plots for visualization of the agreement between the PSG and load cell scoring of AHI and RDI.
The sensitivities and specificities of AHI-LC to detect sleep apnea for various AHI cutoffs are contained in Table 2. The positive likelihood ratios for each AHI cutoff are also presented in Table 2. Our ability to detect severe apnea in particular was very high, with 100% sensitivity and 97% specificity, and with a positive likelihood ratio of 33.
Table 2.
Sensitivities, specificities, and positive likelihood ratios (LR+) of using AHI-LC to detect sleep apnea for several AHI cutoffs.
| Sensitivity | Specificity | LR+ | |
|---|---|---|---|
| AHI ≥ 5 | 0.84 | 0.79 | 4 |
| AHI ≥ 15 | 0.87 | 0.97 | 29 |
| AHI ≥ 30 | 1.00 | 0.97 | 33 |
Discussion
This study showed that using unobtrusive load cells under the bed to replace the four standard respiratory leads for polysomnography provides an accurate measure of AHI. The AHI using load cell respiration tracings was highly correlated with the standard montage. Finally, the load cell AHI was also highly predictive of the presence of sleep apnea particularly for AHIs greater than 15. Our success at detecting mild apnea is encouraging, and we believe load cell performance will improve with our future work to clarify how specific features in the load cell excursion correlate with various types of respiratory events.
In order to control for inter-rater variability, we chose to have both the standard PSG records and the LC montages scored by the same registered polysomnographic technologist. Thus, each PSG record was scored twice by the same individual. At least five months elapsed between the original scoring of the standard PSG record and the anonymized scoring of the LC montage. Consequently, between the 1st and 2nd scoring of each record the technologist scored over 300 PSG records, and prior to scoring the LC montage the records were anonymized, further mitigating any chance that the technologist would be influenced by recollection of the 1st scoring. Thus there could be no recall of raw data appearance or blinded record labels.
As expected, AHI-LC did very well compared to AHI-PSG. We were not surprised to find that load cell scoring tended to be less specific when scoring RERA compared to hypopnea and apnea. RERA scoring has been shown to have lower inter-scorer reliability, to be less sensitive when based on nasal pressure and respiratory inductance plethysmography (Redline et al., 2007), and is best performed with esophageal manometry, which was not used in this protocol. We are encouraged by our success at detecting respiratory effort related arousal. Though improvement is needed, our further work analyzing feature changes specific to flow reductions with arousal and RERA may permit a non-invasive method for detecting patients with upper airway resistance syndrome that have historically required more invasive tests with esophageal manometry (Tantrakul and Guilleminault, 2009). There has been great interest in finding non-invasive ways to measure RERAs and flow limitations. Other groups have worked on novel methods for identifying respiratory effort (Tenhunen et al., 2011). Flow limitation during total sleep time is also of interest as flow limitation may impair sleep during each breath rather than with distinct scorable events (Chervin et al., 2012, Tantrakul and Guilleminault, 2009). Additional error in the RDI observed in this study may be due to limitations in the current standard for arousal detection. We followed the current AASM definition for arousal. Changes in the sleep EEG may be better detected by quantified EEG or evaluation of the cyclic alternating pattern (CAP) (Guilleminault et al., 2007). A thorough analysis of load cells to detect respiratory related arousal is beyond the scope of the current paper, though we intend to continue working on enhanced detection of RERAs using load cells.
The load cell breathing signal comes from mass movement; therefore it may actually be more indicative of respiratory effort. However, it could also be argued that the load cells susceptibility to non-respiratory related movement could have contributed to more RERAs being scored. Similarly, since the load cells are detecting mass movements, we were concerned that higher BMI might make changes in the load cell breathing signal less apparent. In fact, the AHI scoring error (i.e. the difference between AHI-PSG and AHI-LC) increased significantly with increasing BMI (t43 = 2.06, p = 0.05), although only 9% of the variance in the AHI scoring error was accounted for by BMI. There was no dependence (t43 = 1.09, p = 0.28) on BMI found for RDI scoring error.
The rules used in this study to identify apneic events were adapted from AASM standards for scoring events using flow and thermistor tracings. As the load cell signal originates from visceral mass movements caused by breathing as opposed to actually measuring air flow, it seems obvious that different standards fine tuned to the nuances of the load cell signals themselves would improve the accuracy of using the load cell tracings. We are isolating morphologic changes that improve event type specificity, and future work includes an event by event analysis to develop load cell specific scoring features. We have previously reported successful discrimination of obstructive from central apnea (Beattie et al., 2009). Discriminating central hypopnea from obstructive hypopnea may be aided by observation of retention of the normal rounded nasal pressure excursion, absence of paradoxical respiratory effort, absence of snoring, decreased intercostal EMG activity and/or less negative pressure swings on esophageal manometry when available. While we demonstrated that central apnea is reliably identified with load cells in previous work, we believe our future work at isolating the unique morphologic changes within the load cell signal will help identify reduced effort in more subtle events like central hypopnea and help discriminate these from obstructive hypopnea or RERA. In the future, we also plan to refine our ability to detect RERAs with the load cell signals, to explore the use of load cells to identify respiratory effort, and to study the analytic correlation between load cell recording and CAP scoring in NREM sleep.
We have demonstrated the feasibility of using load cells installed under the bed to detect sleep apnea. Other unobtrusive devices have been proposed for monitoring sleep apnea. The most studied of these is the static charge sensitive bed (SCSB), which has also been utilized to visually score apneic events (Polo et al., 1988, Salmi et al., 1986). The SCSB is placed under the mattress and detects movement of an individual lying on the bed as changes in static charge (Alihanka et al., 1981). The load cell placement under the supports of the bed not only allows the detection of movement such as those associated with breathing, but has several other possible applications not possible with the SCSB. Calibrated load cells can be used to monitor a patient’s weight as well as the lying position of an individual lying on the bed (Beattie et al., 2011). Load cell data is easy to collect and does not require any sensors in contact with the patient. Current flow and effort leads during attended PSG are obtrusive and disruptive to sleep. Unlike standard polysomnography leads, the load cells do not become displaced during the night, resulting in more reliable signals and far superior signal integrity for serial night collections such as might be seen during unattended home monitoring. While the study presented herein was performed in a sleep lab, we will soon be placing similar devices in patients’ own homes for long-term, unobtrusive monitoring while they sleep in a familiar environment.
Acknowledgments
This project was supported by Grant Number R01HL098621 from the National Heart, Lung, And Blood Institute. The content is solely the responsibility of the authors and does not necessarily represent the official views of the National Heart, Lung, And Blood Institute or the National Institutes of Health.
The authors would like to thank John Hunt M.S.E.E for his technical expertise in developing the load cell system.
Footnotes
Conflict of Interest
No conflict of interest exists for any author.
References
- Agnew HW, Jr, Webb WB, Williams RL. The first night effect: an EEG study of sleep. Psychophysiology. 1966;2:263–6. doi: 10.1111/j.1469-8986.1966.tb02650.x. [DOI] [PubMed] [Google Scholar]
- Alihanka J, Vaahtoranta K, Saarikivi I. A new method for long-term monitoring of the ballistocardiogram, heart rate, and respiration. Am J Physiol. 1981;240:R384–92. doi: 10.1152/ajpregu.1981.240.5.R384. [DOI] [PubMed] [Google Scholar]
- Baldwin CM, Griffith KA, Nieto FJ, O’connor GT, Walsleben JA, Redline S. The association of sleep-disordered breathing and sleep symptoms with quality of life in the Sleep Heart Health Study. Sleep. 2001;24:96–105. doi: 10.1093/sleep/24.1.96. [DOI] [PubMed] [Google Scholar]
- Beattie ZT, Hagen CC, Hayes TL. Classification of lying position using load cells under the bed. Conf Proc IEEE Eng Med Biol Soc. 2011:474–7. doi: 10.1109/IEMBS.2011.6090068. [DOI] [PMC free article] [PubMed] [Google Scholar]
- Beattie ZT, Hagen CC, Pavel M, Hayes TL. Classification of breathing events using load cells under the bed. Conf Proc IEEE Eng Med Biol Soc. 2009;2009:3921–4. doi: 10.1109/IEMBS.2009.5333548. [DOI] [PMC free article] [PubMed] [Google Scholar]
- Beebe DW, Groesz L, Wells C, Nichols A, Mcgee K. The neuropsychological effects of obstructive sleep apnea: a meta-analysis of norm-referenced and case-controlled data. Sleep. 2003;26:298–307. doi: 10.1093/sleep/26.3.298. [DOI] [PubMed] [Google Scholar]
- Brink M, Muller CH, Schierz C. Contact-free measurement of heart rate, respiration rate, and body movements during sleep. Behav Res Methods. 2006;38:511–21. doi: 10.3758/bf03192806. [DOI] [PubMed] [Google Scholar]
- Chervin RD, Ruzicka DL, Hoban TF, et al. Esophageal Pressures, Polysomnography, and Neurobehavioral Outcomes of Adenotonsillectomy in Children. Chest. 2012 doi: 10.1378/chest.11-2456. [DOI] [PMC free article] [PubMed] [Google Scholar]
- Curcio G, Ferrara M, Piergianni A, Fratello F, De Gennaro L. Paradoxes of the first-night effect: a quantitative analysis of antero-posterior EEG topography. Clin Neurophysiol. 2004;115:1178–88. doi: 10.1016/j.clinph.2003.12.018. [DOI] [PubMed] [Google Scholar]
- Guilleminault C, Lopes MC, Hagen CC, Da Rosa A. The cyclic alternating pattern demonstrates increased sleep instability and correlates with fatigue and sleepiness in adults with upper airway resistance syndrome. Sleep. 2007;30:641–7. doi: 10.1093/sleep/30.5.641. [DOI] [PubMed] [Google Scholar]
- Joo EY, Tae WS, Lee MJ, et al. Reduced brain gray matter concentration in patients with obstructive sleep apnea syndrome. Sleep. 2010;33:235–41. doi: 10.1093/sleep/33.2.235. [DOI] [PMC free article] [PubMed] [Google Scholar]
- Le Bon O, Staner L, Hoffmann G, et al. The first-night effect may last more than one night. J Psychiatr Res. 2001;35:165–72. doi: 10.1016/s0022-3956(01)00019-x. [DOI] [PubMed] [Google Scholar]
- Macey PM, Kumar R, Woo MA, Valladares EM, Yan-Go FL, Harper RM. Brain structural changes in obstructive sleep apnea. Sleep. 2008;31:967–77. [PMC free article] [PubMed] [Google Scholar]
- Paalasmaa J, Leppakorpi L, Partinen M. Quantifying respiratory variation with force sensor measurements. Conf Proc IEEE Eng Med Biol Soc. 2011:3812–5. doi: 10.1109/IEMBS.2011.6090773. [DOI] [PubMed] [Google Scholar]
- Peppard PE, Szklo-Coxe M, Hla KM, Young T. Longitudinal association of sleep-related breathing disorder and depression. Arch Intern Med. 2006;166:1709–15. doi: 10.1001/archinte.166.16.1709. [DOI] [PubMed] [Google Scholar]
- Polo O, Brissaud L, Sales B, Besset A, Billiard M. The validity of the static charge sensitive bed in detecting obstructive sleep apnoeas. Eur Respir J. 1988;1:330–6. [PubMed] [Google Scholar]
- Redline S, Budhiraja R, Kapur V, et al. The scoring of respiratory events in sleep: reliability and validity. J Clin Sleep Med. 2007;3:169–200. [PubMed] [Google Scholar]
- Salmi T, Partinen M, Hyyppa M, Kronholm E. Automatic analysis of static charge sensitive bed (SCSB) recordings in the evaluation of sleep-related apneas. Acta Neurol Scand. 1986;74:360–4. doi: 10.1111/j.1600-0404.1986.tb03526.x. [DOI] [PubMed] [Google Scholar]
- Sassani A, Findley LJ, Kryger M, Goldlust E, George C, Davidson TM. Reducing motor-vehicle collisions, costs, and fatalities by treating obstructive sleep apnea syndrome. Sleep. 2004;27:453–8. doi: 10.1093/sleep/27.3.453. [DOI] [PubMed] [Google Scholar]
- Tantrakul V, Guilleminault C. Chronic sleep complaints in premenopausal women and their association with sleep-disordered breathing. Lung. 2009;187:82–92. doi: 10.1007/s00408-009-9137-7. [DOI] [PubMed] [Google Scholar]
- Tenhunen M, Rauhala E, Virkkala J, Polo O, Saastamoinen A, Himanen SL. Increased respiratory effort during sleep is non-invasively detected with movement sensor. Sleep Breath. 2011;15:737–46. doi: 10.1007/s11325-010-0430-8. [DOI] [PubMed] [Google Scholar]
- Yang EH, Hla KM, Mchorney CA, Havighurst T, Badr MS, Weber S. Sleep apnea and quality of life. Sleep. 2000;23:535–41. [PubMed] [Google Scholar]
- Young T, Palta M, Dempsey J, Skatrud J, Weber S, Badr S. The occurrence of sleep-disordered breathing among middle-aged adults. N Engl J Med. 1993;328:1230–5. doi: 10.1056/NEJM199304293281704. [DOI] [PubMed] [Google Scholar]