

Abstract
Objectives
To provide information of semen quality among normal young Japanese men and indicate the frequency of reduced semen quality.
Design
Cross-sectional, coordinated studies of Japanese young men included from university areas. The men had to be 18–24 years, and both the man and his mother had to be born in Japan. Background information was obtained from questionnaires. Standardised and quality-controlled semen analyses were performed, reproductive hormones analysed centrally and results adjusted for confounding factors.
Setting
Four study centres in Japan (Kawasaki, Osaka, Kanazawa and Nagasaki).
Participants
1559 men, median age 21.1 years, included during 1999–2003.
Outcome measures
Semen volume, sperm concentration, total sperm count, sperm motility, sperm morphology and reproductive hormone levels.
Results
Median sperm concentration was 59 (95% CI 52 to 68) million/ml, and 9% and 31.9% had less than 15 and 40 million/ml, respectively. Median percentage of morphologically normal spermatozoa was 9.6 (8.8 to 10.3)%. Small, but statistically significant, differences were detected for both semen and reproductive hormone variables between men from the four cities. Overall, the semen values were lower than those of a reference population of 792 fertile Japanese men.
Conclusions
Assuming that the investigated men were representative for young Japanese men, a significant proportion of the population had suboptimal semen quality with reduced fertility potential, and as a group they had lower semen quality than fertile men. However, the definitive role—if any—of low semen quality for subfertility and low fertility rates remain to be investigated.
Keywords: semen quality, reproductive hormones, young men, reproductive medicine
Article summary.
Article focus
There has only been one Japanese study reporting semen quality of presumably normal young men indicating good semen quality compared with men from Europe.
To establish the frequency of impaired semen quality among normal young Japanese men.
Key messages
Semen quality of the young men was significantly poorer than that of partners of pregnant women, and 32% may have reduced fertility chances.
Semen quality was highly variable.
These results will serve as a reference for future studies on time trends in semen quality in Japan and for comparison with future studies of university students in other countries.
Strengths and limitations of this study
Large-scale prospective study of semen quality among Japanese young men.
Standardised inclusion criteria and investigation procedures.
Lack of influence of ethnicity and genetic background on semen quality.
Relatively low participation rate limits the possibility to generalise the results for the whole population, which is the common problem for all semen studies.
Introduction
Whether there has been a global decreasing trend in semen quality remains still controversial. In contrast, there is a consensus that regional differences exist.1–7 Cross-sectional, coordinated studies of young men from the general populations have shown that men from the Western part of the Northern European countries have lower semen quality than men from the Eastern part or men from the Southern Spain,4–8 which is inversely correlated with the testicular cancer incidences.8 9
There has only been one Japanese study reporting semen quality of presumably normal young men10 indicating good semen quality compared with men from Europe. However, the authors concluded that their results might be flawed by a selection bias and lack of ability to account for confounding factors, and they requested well-designed prospective studies to be performed in several regions of Japan.
Here, we present the results of prospectively designed, cross-sectional studies of young university students from four different provinces in Japan. Our objectives were to elucidate if reduced semen quality was frequent among Japanese men unselected for their fertility status, to examine possible regional differences, to provide a reference for future studies on time trends in semen quality, and to compare the results with those obtained in other countries.
Methods
The investigations took place at four study centres based in departments of urology at university hospitals in Kawasaki, Osaka, Kanazawa and Nagasaki in Japan. The investigation procedures described below were the same as those of the previously published European studies4 5 7 except for the selection of study populations and assessment of semen volume.
Study populations of young men
University students were informed about the study through posters placed in several conspicuous places on the campuses of the universities connected to the four study centres. Serially numbered leaflets giving detailed information about the study were attached to the posters. A candidate volunteer had to call the study centre and inform the serial number printed on his copy of the leaflet to make an appointment for the investigations approximately 1 week later and to receive a package of documents within days by mail. The package included further written information, a questionnaire and the instruction to preferably abstain from ejaculation for at least 48 h prior to producing the semen sample for the study. Further inclusion criteria were that the man was 18–24 years, and that both he and his mother were born in Japan. Failure to comply with the request for ejaculation abstinence period was not a reason for exclusion, but the abstinence time was recorded according to the information given by the study subjects at the time of the semen sample delivery. On the day of attendance that was set at a certain time in the morning, the man returned the completed questionnaire, underwent a physical examination, provided a semen sample and had a blood sample drawn.
The study in Kawasaki covered two separate periods: May 1999–May 2000 and April 2002–May 2003; the study periods in Osaka, Kanazawa and Nagasaki were September 2002–October 2003, July 2002–June 2003 and July 2002–July 2003, respectively. In total, 9374 leaflets were taken by the students and 1559 (16.6%) participated: 14.5% (658/4534) from Kawasaki, 11.7% (300/2570) from Osaka, 21.9% (300/1371) from Kanazawa and 33.3% (301/899) from Nagasaki.
The healthy subgroup (n=1307) of the entire study population (n=1559), who had no history of cryptorchidism, testicular torsion, orchitis, varicocele, inguinal hernia, caused pregnancy and experienced fertility problem, was examined separately (see online supplementary table S1).
Questionnaires
The questionnaire included information on age and previous or current diseases, including any known history of fertility. To assure the quality of the information regarding previous conditions, the men were asked to fill in the questionnaire—if possible—in collaboration with their parents.
Physical examination
The participants had their testes size measured by use of a Prader orchidometer (Pharmacia & Upjohn, Copenhagen, Denmark). The presence of varicocele or other scrotal abnormalities and the Tanner stage of pubic hair were evaluated. Body weight and height were self-reported, and body mass index (BMI) was calculated as weight in kilograms divided by squared height in metres.
Semen samples
The ejaculation abstinence period was calculated as the time between the current and previous ejaculation based on self-reported information from the men. Semen samples were collected at the laboratory and kept at 37°C during liquefaction. Semen volume was assessed by aspirating the entire sample into a graduated 5 ml syringe (TERUMO, Tokyo). Sperm motility was assessed on 10 µl of well-mixed semen placed on a clean glass slide, covered with a 22×22 mm coverslip, and then examined at a total magnification of 400 times on the heating stage at 37°C of a microscope. The sperm were classified as either motile (WHO motility classes A, B or C) or immotile (class D), in order to record the proportion of motile sperm.11 The motility assessment was repeated on a second 10 µl aliquot of semen, and the average value of the two samples was calculated. For the assessment of sperm concentration, the samples were diluted in a solution of 0.6 mol/l NaHCO3 and 0.4% (v/v) formaldehyde in distilled water, subsequently assessed using Bürker-Türk haemocytometers. Only sperm with tails were counted. Smears were prepared for morphological evaluation, Papanicolaou stained and finally assessed according to strict criteria12 by one examiner (MV) in Finland between 2009 and 2010.
Quality control of sperm concentration assessment
Interlaboratory variation in assessment of sperm concentration was monitored by an external quality control (QC) programme coordinated by the Department of Growth and Reproduction Copenhagen, Denmark3 4 during the study period.
Blood samples
A blood sample was drawn from a cubital vein of each participant usually in the morning to reduce the effect of diurnal variation in hormone levels, and the serum was separated by centrifugation after clotting and stored at −20°C. The frozen serum was sent to the Department of Growth and Reproduction, Rigshospitalet, in Copenhagen, Denmark, for a centralised hormone analysis. Levels of testosterone, follicle-stimulating hormone (FSH), luteinising hormone (LH) and sex hormone-binding globulin (SHBG) were determined using a time-resolved immunofluorometric assay (Delfia, Wallac, Turku, Finland). Inhibin-B was measured by a specific two-sided enzyme immunometric assay (Serotec, UK). Intra-assay and interassay coefficients of variations (CV) for measurements of both FSH and LH were 3% and 4.5%, respectively. CVs for both testosterone and SHBG were <8% and <5%, respectively. The intra-assay and interassay CVs for inhibin-B were 15% and 18%. Free testosterone (cFT) was calculated from total testosterone and SHBG using fixed albumin level of 43.8 g/l as described by Vermeulen et al .13
Comparison population: fertile men (partners of pregnant women)
From January 1999 to February 2002, our group also examined the semen quality of 792 fertile men (partners of pregnant women) (a manuscript describing these have been submitted in parallel). Participation of these men was similar to that of current study population of young men: they answered a questionnaire, delivered a semen sample and had a physical examination performed. The results of their semen analyses were used for comparison to that of the young men.
Statistical analysis
Standard statistics (mean, median, SD, 5–95 percentiles and frequencies) were used for description (tables 1–3). Between-group differences for continuous variables giving the basic description of the study population were tested by the non-parametric Kruskal-Wallis test. Between-group differences for categorical variables were tested with the Fisher's exact test.
Table 1.
Physical appearance and self-reported information of young men from four cities in Japan
| Entire study population (n=1559) | Kawasaki (n=658) | Osaka (n=300) | Kanazawa (n=300) | Nagasaki (n=301) | |||||||
|---|---|---|---|---|---|---|---|---|---|---|---|
| Mean (SD) | Median (5–95) | Mean (SD) | Median (5–95) | Mean (SD) | Median (5–95) | Mean (SD) | Median (5–95) | Mean (SD) | Median (5–95) | p Values | |
| Height (cm) | 172 (6) | 172 (163–181) | 172 (6) | 172 (163–182) | 172 (6) | 172 (163–181) | 173 (6) | 173 (163–181) | 172 (5) | 171 (163–180) | 0.01* |
| Weight (kg) | 64 (9) | 63 (52–79) | 64 (11) | 63 (52–80) | 63 (8) | 63 (52–77) | 64 (8) | 63 (52–80) | 63 (9) | 62 (52–82) | 0.4* |
| BMI (kg/m2) | 21.4 (2.7) | 21.0 (18.2–26.0) | 21.5 (3.0) | 21.0 (18.2–26.0) | 21.2 (2.2) | 20.9 (18.2–25.4) | 21.4 (2.4) | 21.1 (18.4–25.8) | 21.6 (2.6) | 21.3 (18.0–26.2) | 0.2* |
| Mean of left and right size (ml)† | 21 (4) | 22 (14–28) | 22 (4) | 22 (15–28) | 22 (5) | 23 (14–29) | 21 (4) | 21 (14–29) | 20 (4) | 19 (13–26) | <0.0001* |
| Age (years)‡ | 21.3 (1.6) | 21.1 (18.9–24.1) | 20.8 (1.4) | 20.7 (18.7–23.4) | 21.7 (1.6) | 21.6 (19.3–24.4) | 21.8 (1.6) | 21.9 (18.9–24.2) | 21.3 (1.7) | 21.2 (18.9–24.2) | <0.0001* |
| School education (years)§ | 15 (2) | 15 (12–18) | 14 (2) | 14 (12–17) | 15 (2) | 15 (12–18) | 15 (2) | 15 (12–18) | 15 (2) | 15 (12–18) | <0.0001* |
| Ejaculation abstinence (hours)¶ | 78 (36) | 65 (50–136) | 76 (32) | 64 (49–136) | 77 (35) | 64 (50–136) | 82(51) | 67 (51–138) | 78 (28) | 66 (51–136) | 0.0002* |
| Frequency (%) | Frequency (%) | Frequency (%) | Frequency (%) | Frequency (%) | |||||||
| Have (had) | |||||||||||
| Cryptorchidism** | 8.2 | 6.9 | 8.3 | 12.7 | 6.3 | 0.02†† | |||||
| Testicular torsion | 0.1 | 0.2 | 0.0 | 0.3 | 0.0 | 0.5†† | |||||
| Orchitis | 1.4 | 1.6 | 1.7 | 1.0 | 1.0 | 0.8†† | |||||
| Varicocele | 0.1 | 0.0 | 0.3 | 0.3 | 0.0 | 0.2†† | |||||
| Inguinal hernia | 1.1 | 0.7 | 2.3 | 1.0 | 1.0 | 0.2†† | |||||
| STD‡‡ | 2.1 | 2.8 | 1.0 | 1.3 | 2.3 | 0.3†† | |||||
| Thyroid disease or diabetes | 0.1 | 0.2 | 0.3 | 0.0 | 0.0 | 0.7†† | |||||
| Taken medicine§§ | 10.4 | 13.7 | 8.0 | 8.7 | 7.3 | 0.0006†† | |||||
| Caused pregnancy | 3.8 | 4.4 | 2.7 | 3.3 | 4.0 | 0.6†† | |||||
| Experienced fertility problem¶¶ | 0.9 | 1.8 | 0.3 | 0.0 | 0.7 | 0.03†† | |||||
| Varicocele diagnosed in study*** | 27.1 | 26.8 | 24.3 | 20.0 | 37.5 | <0.0001†† | |||||
| Tobacco smoker | 49.6 | 62.4 | 34.6 | 42.8 | 45.0 | <0.0001†† | |||||
| Exposed to tobacco in utero††† | 2.0 | 2.5 | 1.3 | 1.3 | 2.3 | 0.6†† | |||||
*Kruskal-Wallis test.
†Size assessed by palpation. Two men had non-palpable left testicles, one from Kawasaki and one from Kanazawa due to previous orchidectomy because of testicular torsion.
‡Age calculated as difference between day of attendance in study and self-reported day of birth.
§All participants were university students.
¶Ejaculation abstinence period calculated as difference between time of current ejaculation and self-reported time of previous ejaculation.
**Not born with both testicles in scrotum (irrespective of spontaneous descend or treatment).
††Fisher's exact test.
‡‡Diagnosed with epididymitis, chlamydia or gonnorhoea.
§§Taken any medication recent 3 months prior to participation in study. For 93%, 61%, 61% and 60% from Kawasaki, Osaka, Kanazawa and Nagasaki, respectively, it was against either infection, allergy or pain.
¶¶Have had unprotected intercourse without causing a pregnancy during a 12-month period.
***Varicocele diagnosed during this study, irrespective of previous self-reported information.
†††In utero exposed to maternal tobacco smoking.
(5–95), 5–95th percentile; BMI, body mass index; STD, sexually transmitted disease.
Table 2.
Semen quality of young men from four cities in Japan
| Observed | Adjusted | ||
|---|---|---|---|
| Mean (SD) | Median (5–95) | Median (95% CI) | |
| Semen volume (ml) | |||
| Entire study population | 2.9 (1.4) | 2.7 (1.0–5.5) | 3.0 (2.8 to 3.2) |
| Kawasaki | 2.7 (1.3) | 2.5 (0.9–5.2) | 2.8 (2.7 to 3.2) |
| Osaka | 2.9 (1.4) | 2.7 (1.0–5.6) | 2.9 (2.7 to 3.2) |
| Kanazawa | 3.3 (1.5) | 3.0 (1.2–6.4) | 3.3 (3.1 to 3.6) |
| Nagasaki | 2.9 (1.4) | 2.8 (0.9–5.4) | 3.0 (2.8 to 3.2) |
| p Value | p=0.0006 | ||
| Sperm concentration (million/ml) | |||
| Entire study population | 73 (58) | 59 (10–185) | 59 (52 to 68) |
| Kawasaki | 71 (61) | 55 (9–185) | 57 (48 to 66) |
| Osaka | 75 (61) | 60 (9–195) | 61 (50 to 74) |
| Kanazawa | 72 (55) | 60 (7–183) | 61 (51 to 73) |
| Nagasaki | 76 (54) | 64 (12–181) | 61 (51 to 74) |
| p Value | p=0.138 | ||
| Total sperm count (million) | |||
| Entire study population | 201 (183) | 159 (18–509) | 177 (153 to 206) |
| Kawasaki | 185 (193) | 143 (17–472) | 161 (135 to 191) |
| Osaka | 202 (178) | 163 (28–508) | 179 (146 to 221) |
| Kanazawa | 228 (184) | 185 (15–546) | 201 (165 to 246) |
| Nagasaki | 201 (161) | 166 (22–531) | 183 (150 to 224) |
| p Value | p=0.002 | ||
| Motile spermatozoa (%) | |||
| Entire study population | 67 (14) | 69 (42–88) | 67 (65 to 68) |
| Kawasaki | 66 (14) | 68 (40–87) | 65 (63 to 67) |
| Osaka | 67 (12) | 67 (52–84) | 64 (61 to 67) |
| Kanazawa | 62 (14) | 64 (38–82) | 60 (57 to 63) |
| Nagasaki | 76 (14) | 78 (48–93) | 75 (73 to 77) |
| p Value | p<0.0001 | ||
| Morphologically normal spermatozoa (%) a | |||
| Entire study population | 10.3 (6.0) | 9 (2.5–21.5) | 9.6 (8.8 to 10.3) |
| Kawasaki | 10.5 (6.2) | 9 (2.5–23) | 9.0 (7.8 to 10.2) |
| Osaka | 9.2 (5.2) | 8.5 (2.5–19) | 8.2 (7.1 to 9.3) |
| Kanazawa | 10.0 (6.1) | 8.8 (2–21) | 9.0 (8.0 to 10.0) |
| Nagasaki | 11.7 (6.1) | 11 (3–23) | 10.9 (9.9 to 11.9) |
| p Value | p=0.0001 | ||
Observed: results based on raw data.
Adjusted median and 95% CI calculated by linear regression analysis.
Semen volume, sperm concentration and total sperm counts adjusted to a period of ejaculationabstinence of 96 h for a 21-year-old man.
Motility and morphology adjusted for a 21-year-old man, winter season.
See text for further explanation.
p Value based on regression analyses of cubic root transformed values, comparing all four groups.
a: Morphology results only available for 869 men.
(5–95), 5–95th percentile.
Table 3.
Reproductive hormone levels of young men from four cities in Japan
| Observed | Adjusted | ||
|---|---|---|---|
| Mean (SD) | Median (5–95) | Median (95% CI) | |
| FSH (U/l) | |||
| Entire study population | 2.5 (1.3) | 2.2 (1.1–4.9) | 2.3 (2.2 to 2.5) |
| Kawasaki | 2.7 (1.3) | 2.4 (1.1–5.2) | 2.4 (2.3 to 2.6) |
| Osaka | 2.5 (1.3) | 2.2 (1.1–5.0) | 2.3 (2.1 to 2.4) |
| Kanazawa | 2.3 (1.3) | 2.1 (1–4.4) | 2.1 (1.9 to 2.3) |
| Nagasaki | 2.3 (1.2) | 2.1 (0.9–4.4) | 2.1 (1.9 to 2.2) |
| p Value | p<0.0001 | ||
| Inhibin-B (pg/ml) | |||
| Entire study population | 202 (64) | 197 (110–314) | 190 (181 to 199) |
| Kawasaki | 207 (64) | 202 (113–322) | 191 (181 to 201) |
| Osaka | 214 (67) | 210 (117–336) | 193 (182 to 205) |
| Kanazawa | 191 (62) | 190 (104–304) | 177 (164 to 191) |
| Nagasaki | 188 (60) | 182 (103–286) | 176 (165 to 187) |
| p Value | p=0.003 | ||
| LH (U/l) | |||
| Entire study population | 3.2 (1.3) | 2.9 (1.5–5.6) | 2.7 (2.6 to 2.9) |
| Kawasaki | 3 (1.3) | 2.8 (1.4–5.3) | 2.7 (2.5 to 2.8) |
| Osaka | 3.5 (1.4) | 3.2 (1.8–6.4) | 3.0 (2.9 to 3.2) |
| Kanazawa | 3.3 (1.4) | 3.1 (1.6–5.8) | 2.8 (2.6 to 3.1) |
| Nagasaki | 2.9 (1.0) | 2.8 (1.5–4.9) | 2.6 (2.4 to 2.8) |
| p Value | p<0.0001 | ||
| Testosterone (nmol/l) | |||
| Entire study population | 25 (8) | 24 (14–39) | 26 (25 to 27) |
| Kawasaki | 26 (7) | 25 (15–39) | 26 (25 to 27) |
| Osaka | 27 (9) | 26 (15–42) | 27 (26 to 28) |
| Kanazawa | 22 (7) | 21 (12–35) | 23 (21 to 24) |
| Nagasaki | 22 (7) | 21 (13–36) | 23 (21 to 24) |
| p Value | p<0.0001 | ||
| SHBG (nmol/l) | |||
| Entire study population | 28 (11) | 26 (13–46) | 27 (26 to 28) |
| Kawasaki | 30 (11) | 29 (14–49) | 28 (27 to 30) |
| Osaka | 29 (11) | 27 (14–50) | 26 (25 to 28) |
| Kanazawa | 24 (9) | 23 (12–41) | 23 (21 to 24) |
| Nagasaki | 24 (9) | 23 (12–42) | 23 (21 to 24) |
| p Value | p<0.0001 | ||
| cFT (pmol/l)* | |||
| Entire study population | 607 (192) | 585 (326–949) | 638 (613 to 663) |
| Kawasaki | 619 (181) | 605 (339–924) | 630 (604 to 657) |
| Osaka | 672 (214) | 649 (371–1029) | 675 (642 to 710) |
| Kanazawa | 556 (183) | 527 (298–894) | 589 (552 to 628) |
| Nagasaki | 566 (177) | 550 (316–922) | 583 (552 to 615) |
| p Value | p<0.0001 | ||
*Calculated cFT.
Observed: results based on raw data.
Adjusted median and 95% CI calculated by linear regression analysis, adjusted to blood sampling at 10:00 in winter season, representing a 21-year-old man having a BMI of 21.
p Value based on regression analyses of natural logarithmic transformed values, comparing all four groups.
(5–95), 5–95th percentile.
BMI, body mass index; cFT, free testosterone; FSH, follicle-stimulating hormone; LH, luteinising hormone; SHBG, sex hormone-binding globulin.
The main outcome variables were the assessed semen and hormone variables, and the between-group differences were tested by multiple-linear regression (tables 2 and 3). Semen volume, sperm concentration and total sperm counts were best normalised by cubic root transformation before analysis to correct for skewed distribution of residuals. The percentages of motile spermatozoa were logit-transformed. Percentages of morphologically normal spermatozoa entered the model untransformed. Ejaculation abstinence up to 96 h had a linear increasing effect, and abstinence above 96 h had a slight, but significant, non-linear increasing effect on semen volume, sperm concentrations and total sperm counts. Abstinence therefore entered the model as a covariate as linear splines and abstinence-squared for the part above 96 h. For motility, winter season was associated with lower motility percentages and season was therefore included as a covariate. For all semen variables, increasing age tended to be slightly, but negatively, associated with semen variables and age was also included in the models. Duration from ejaculation to assessment was additionally evaluated as a confounder for motility, but found to be non-significant, and therefore not included.
Natural logarithmic transformation gave models in which differences between centres and effects of covariates are more easily interpretable. This alternative model approximate closely the model obtained by cubic root transformation and is used when reporting adjusted semen volumes, sperm concentrations and total sperm counts to represent a 21-year-old man having an ejaculation abstinence period of 96 h. QC results did not show any significant interlaboratory differences, changes during the study period or difference to the reference laboratory. Therefore, corrections of data were not needed to make them comparable. The logit-transformed motility data and untransformed morphology percentages were used to give adjusted levels for a 21-years-old man for these variables.
Differences with p<0.05 were considered statistically significant. All statistical analyses were performed twice: MNM using SAS V.9.1.3 (SAS Institute Inc, Cary, North Carolina, USA) and NJ using PASW V.18.
Results
A description of the study population is summarised in table 1. Few men had caused a pregnancy or experienced infertility problems, totalling 4.7%. During the preceding 3 months to participation in the study, 10.4% had used medications which were mainly antibiotics, painkillers, asthma or allergy medicines.
Semen results are shown in table 2. ‘Observed’ values are based on raw data, and ‘adjusted’ are the estimates from regression analyses taking covariates into account. Sperm concentrations did not differ between men from the four study centres, whereas the semen volume for men from Kanazawa was higher than in other centres (p<0.0001–0.02 in pair-wise comparisons). Consequently, also total sperm counts were higher for these men, but only significantly in the pair-wise comparison with men from Kawasaki (p<0.02). The percentages of motile spermatozoa differed significantly because men from Nagasaki had higher frequencies of motile spermatozoa than men from other centres (adjusted medians 64–75%). The percentage of morphologically normal spermatozoa for men from Nagasaki was higher than that from Osaka (p<0.0001 in pair-wise comparison).These results were very similar to those from the healthy subgroup of young men (n=1,307: see online supplementary table S1) who had no history of reproductive problems, that is, cryptorchidism, testicular torsion, orchitis, varicocele, inguinal hernia, sexually transmitted disease (STD), caused pregnancy and experienced fertility problem.
In summary, 2.2% of men had a sperm concentration below 5 million/ml, 4.9% below 10 million/ml, 9% below 15 million/ml and 31.9% below 40 million/ml. For morphology, 5.7% of men had normal spermatozoa below 5%. Figure 1 summarises the distribution of the sperm concentration, total sperm counts, percentages and total numbers of morphologically normal spermatozoa.
Figure 1.
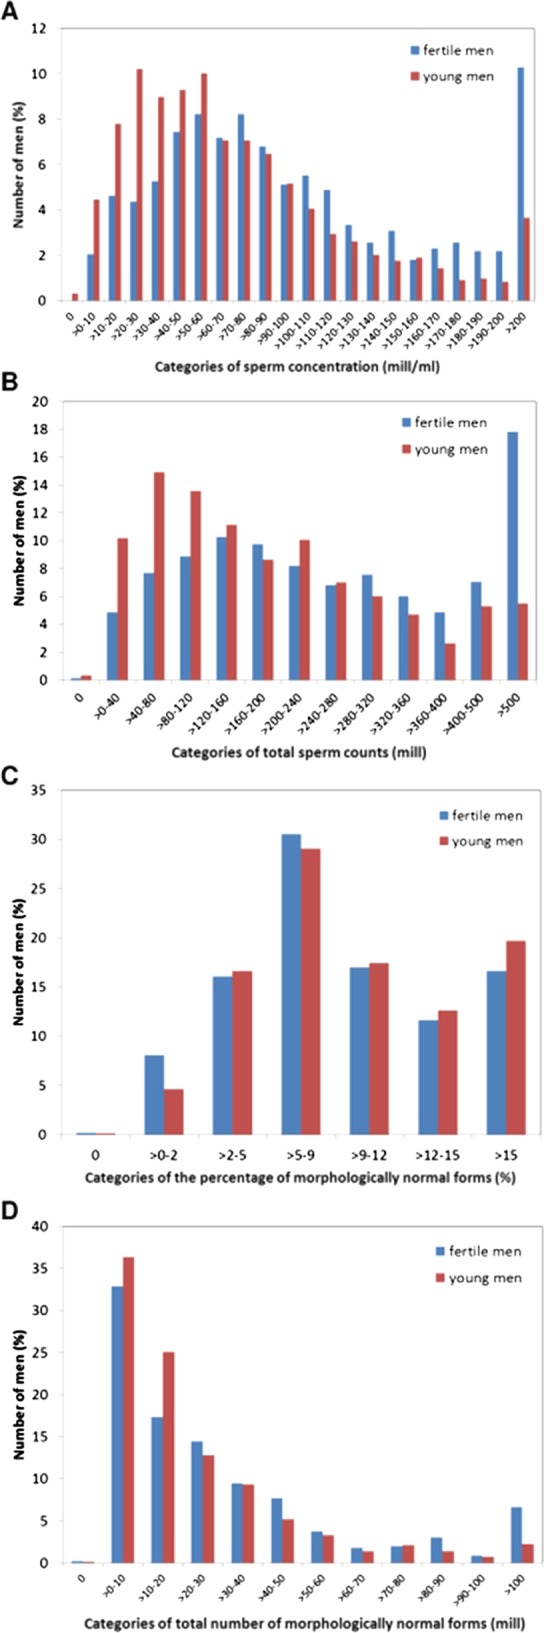
The semen results of the 1559 young men in comparison with those of the 792 fertile men. The semen variables differed between these groups, with fertile men having higher sperm concentration ((A), p<0.0001), total sperm count ((B), p<0.0001), total number of morphologically normal spermatozoa ((D), p<0.0001) than young men, while the percentage of normal spermatozoa did not differ between the groups ((C), p=0.05).
Figure 1 summarises the semen results of the young men in comparison to that of the 792 fertile men. The semen variables differed between these groups, with fertile men having higher semen volume (p<0.002), sperm concentration (p<0.0001), total sperm count (p<0.0001), total number of morphologically normal spermatozoa (p<0.0001) and the percentage of normal spermatozoa (p=0.05) than young men.
The semen variables of men whose mothers had smoked during pregnancy did not significantly differ from non-exposed men, but the number of smoking mothers was very small. The men's own smoking or drinking habits (not shown in table), previous experience of cryptorchidism, testicular torsion, orchitis, STDs (chlamydia, gonnorhoea or epididymitis) or previous fertility experience did not affect their semen variables.
Reproductive hormone levels differed between the groups of young men (table 3). Men from Kawasaki and Osaka had slightly higher FSH (p<0.0001–0.049) and inhibin-B (p<0.003–0.01) levels than men from Kanazawa and Nagasaki. A similar pattern was seen for total testosterone (all p<0.0001), SHBG (all p<0.0001) and cFT (all p<0.0001).The number of men with high (mean+2SD) gonadotropin levels was very small (1–4 men for FSH 0.3–1.3%, and 2–14 for LH 0.7–4.7%). T/LH ratio of men from Kawasaki, Osaka, Kanazawa and Nagawaki were 9.74±4.26, 8.75±3.54, 8.36±3.76 and 7.45±3.51, respectively. All pairwse comparisons between centres except Osaka versus Nagasaki were statistically significant (p<0.0001–0.01).
For the entire group of men, the median (5–95 percentiles) sizes of the left and right testes were both 22 ml (14–28 ml). The average testis size (mean of left and right) differed significantly between the study groups, ranging from 19 to 23 ml in medians (table 1). Overall, 98.8% of study subjects had a pubic hair distribution of Tanner stage 4 or higher: Kawasaki 98.2%, Osaka 98.0%, Kanazawa 100% and Nagasaki 99.7%.
During the physical examination, 27.1% of men were diagnosed with a varicocele: 14.3% stage 1, 9.1% stage 2 and 3.7% stage 3. Varicocele was on the left side only in 23.6%, both sides in 2.9% and only on the right side in 0.6% of men. The presence of a varicocele was non-significantly associated with an 8% (95% CI −20% to 6%) reduction in sperm concentration and 11% decline (−23% to 4%) in total sperm count. No tendencies could be detected for sperm motility or morphology. Inhibin-B and total testosterone tended to be lower in men having a varicocele, however, non-significantly (p>0.05).
Discussion
Sperm concentration, total sperm count, percentage of morphologically normal spermatozoa and percentage of motile spermatozoa varied tremendously between individual participants. However, only small, but statistically significant, differences were detected for both semen and reproductive hormone levels between young men from the four provinces in Japan. Thus, from a biological point of view these groups of men can be regarded as similar. As expected, semen quality of the young men was significantly poorer than that of partners of pregnant women.
To our knowledge, this is the first large-scale prospectively designed study to explore potential differences in testicular function parameters in Japanese men that were not selected by any fertility status. The men were enrolled by the same type of advertisement. They were all university students. We tested for the effects of various covariates and accounted for these when necessary. Thus, the comparison between the four groups is valid, and the results may serve as a reference for future studies on time trends in semen quality.
In Japan, there is not a compulsory medical examination of young men as in the Northern-European countries,4 7 which makes it difficult to recruit men that are representative for the general population. Itoh et al10 not only detected a median sperm concentration of 81 million/ml in 207 young men (18–22 years old) examined in 1998 in Sapporo but also concluded that selection bias in the recruitment and variable ejaculation abstinence might have affected the results. In the design of our study, we therefore decided to restrict the invitation to university students to get a well-characterised study population. Men who have experienced fertility problems may be more likely to volunteer for semen studies than men without any problems.14 Since the sperm count cannot be known without laboratory analysis, it is unlikely that any of the volunteers would have had such information. Testicular size might hint to fertility problem if it were very small. However, there was only small difference (slightly larger in the present cohort) between the testicular size of the young and the fertile men15 in Japan. Moreover, semen variables of the healthy subgroup of young men (n=1307) who had no history of reproductive problems were very similar to those of the entire study population (n=1559). Likewise, it should be noted that the incidence of cryptorchidism was considerably high, which could be an indicator of recruitment bias. In the present study, however, it is unlikely to be a recruitment bias, because the information about cryptorchidism was based on the questionnaire data, that is, history of cryptorchidism, not current cryptorchidism. This included cryptorchidism at any time, that is, both congenital and acquired, which may have different causes and consequences. In fact, there were no differences in semen quality between the healthy subgroup of young men (see online supplemental table S1) and the entire study population (table 2) including the men with history of cryptorchidism or other reproductive problems.We restricted the age of participants to 18–24 years assuming that the majority in such a group would not yet have any direct knowledge about their own fertility chances, since the average Japanese man fathers his first child at the age of 31.8 years.16 Less than 1% of the participants had experienced fertility problems, and such problems are therefore unlikely to severely bias the obtained results. Poorly educated men may be more likely to refuse participation in studies that require delivery of semen samples.17 However, higher educational level has been positively associated with semen quality.17 18 Thus, the selection of university students may bias the results towards a higher level. Nevertheless, semen variables of the healthy subgroup of young men (see online supplementary table S1) who had no history of reproductive problems were very similar to those of the entire study population (table 2). We thus considered that the semen results of the present study population were unlikely to have been subjected to a significant bias.
There were small differences in inhibin-B levels that were lower in men from Kanazawa and Nagasaki than in men from Kawasaki and Osaka. Similar trends were detected for total testosterone, SHBG and cFT. The slightly higher inhibin-B levels in men from Kawasaki and Osaka could theoretically indicate a higher spermatogenic activity in these, which, however, does not fit with the sperm count findings. Also, we hesitate to draw such a conclusion since the detected inhibin-B concentrations at this level do not correlate strongly with sperm counts.19 We have no explanation for the higher total testosterone in men from Kawasaki and Osaka compared with other centres. It is important to keep in mind that the adjusted hormone levels in table 3 were adjusted for the effect of BMI, which thus does not explain the findings. T/LH ratio may inform about Leydig cell function, and therefore we also analysed it. Variation between the study centres was small, but statistically significant; however, biological significance of variation in this scale is questionable.
Diagnostic accuracy of varicocele is very dependent on the clinical experience of the investigator. The high frequency of varicocele may reflect this, since the majority of the cases were grade 1. We saw no significant negative effect on semen quality, which, however, is likely due to the low grade in most varicoceles.
In the European studies, semen volume was assessed by weighing which now is the ‘gold standard’, because aspiration—as used in our study—underestimates the volume by approximately 0.4 ml.20 21 Thus, the true median semen volume might have been 3.4 ml, which is closer to the volumes reported from Finland, Denmark, Germany and Spain,3 7 8 and thus the adjusted median total sperm count in our study would have been 200 million rather than 177. Interobserver variation may explain the higher semen volume detected in men from Kanazawa compared with other centres, because volume measurements were not under external QC.
Three Chinese studies have described semen qualities in apparently normal men. Healthy men, 20–60 years of age, had a median sperm concentration and total sperm count of approximately 65 million/ml and 154 million, respectively.22 The youngest age group, 20–25 years old, comprised only 6.1% of the study population, and overall 83% had previously fathered a child. Another study investigated 20-year-old to 40-year-old men, but excluded those with known andrological diseases and reported a median sperm concentration and total sperm count of 78 million/ml and 168 million.23 Junqing et al24 detected a mean sperm concentration and total sperm count of 55 million/ml and 124 million, respectively, in 22-year-old to 30-year-old men that underwent a premarital physical examination. Thus, the latter may be more comparable to ours, since the men presumably had little knowledge of their fertility potential. These Chinese reference values are clearly lower than the current Japanese figures, suggesting that there are regional differences in semen quality among Asian men. Interestingly, Chinese men who had at least a college education had lower sperm counts than men with a lower educational status.24 If this were true also for Japanese men, the difference in semen quality between Japanese and Chinese men would be even greater than what is evident from the present results.
Other studies have shown an adverse effect of maternal smoking during pregnancy on the son's semen quality.25–27 However, we did not find such an effect, probably because the number of smoking mothers was very small. By contrast, the smoking rates of the young men themselves look exceedingly high for a developed nation, but this is a common trend in Japanese men, which is consistent with the figures from National Health and Nutrition Survey (47.4% in total and 60.8% in 20–29 age group in 2000),28 as well as the results from the previous our study of the fertile Japanese men (52.8% in total).15
The Japanese men appeared to have higher sperm counts than men from the Northern Europe,4 5 7 29–32 but slightly lower than men from Spain.8 Thus, Japanese men may be ranked as having better sperm counts than many populations of European young men. Nevertheless, this does not imply that impaired semen quality is not a problem among young Japanese men. Nearly 10% had sperm counts below the current WHO reference levels of 15 million/ml or 39 million33 rendering them for high risk of reduced fertility in the future. Nearly one-third of men had sperm concentration less than 40 million/ml, indicating reduced fecundity.34–37 We are therefore concerned that a significant proportion of the men may experience problems when they reach the ages when they want to reproduce.34–37
Our prospectively designed study showed no overall difference between men from the four investigation sites, and the semen results were similar to those previously reported for Finnish men that until now have been considered to have the best semen quality among young men from the Northern Europe. The study cohorts were, however, not completely comparable. The recently detected adverse trends in semen quality and testis cancer incidences among men from Finland suggest the underlying environmental causes.32 Whether the semen quality of Japanese men has changed over the years cannot be answered by our current study, but a large proportion of investigated men were shown to have suboptimal sperm counts. These results will serve as a reference for future studies on time trends in semen quality in Japan and for comparison with future studies of university students in other countries.
Supplementary Material
Acknowledgments
Dr K Nishimura, Dr H Miura and Dr M Yamanaka are acknowledged for performing physical examinations of the young men. Ms K Ohata, M Haruki and M Okayama are acknowledged for coordinating the recruitment of the young men. Ms M Nakanome, S Okabe, K Takakura and Y Kawabuchiare are acknowledged for examination of semen quality. All other technicians and study nurses of the four centres are acknowledged for coordinating the recruitment and for examination of semen quality. All the volunteers participating in the study are thanked. Without their participation the study would not have been possible.
Footnotes
Contributors: NJ, NES, JT, SN, MNM, MY and TI conceived and designed this study. TI, MY, SN, KY, KB, MN, EK, JK, AO, KM, AT, HK and JE were involved in acquisition of the data. Data analysis was performed by MNM, NJ and TI. NJ, TI, SN and JT drafted the manuscript. MV assessed the sperm morphology smears. JK, EK, MN, KB, KY, AT, KM, AO, JE, HK and TI performed the physical examinations and collected the data. All authors participated in the interpretation of data, revising the article critically for important intellectual content, final approval of the version to be published.
Funding: This study has been supported economically by several grants: The Ministry of Health and Welfare, Japan (Grant nos. H10-Seikatsu-017 and H13-Seikatsu-014 to TI, AO, MN and JE). Japan Society for the Promotion of Science (nos. 1113001 and 1214001 to TI) and The JSPS Invitation Fellowship Programme (invited scientist from Denmark, NJ) by Japan Society for the Promotion of Science (ID no. S10110),Rigshospitalet (grant no. 961506336) to NJ, Academy of Finland, Sigrid Juselius Foundation and Turku University Hospital to JT. The funding organisations played no role in the design and conduct of the study, in collection, management, analysis and interpretation of the data, or in the presentation, review or approval of the manuscript.
Competing interests: None.
Ethics approval: This study got the approval of the Ethics Review Board in each university and hospital. All participants gave their written consent before participating in the study.
Provenance and peer review: Not commissioned; externally peer reviewed.
Data sharing statement: No additional data are available.
References
- 1.Fisch H, Goluboff ET, Olson JH, et al. Semen analysis in 1283 men from the United States over a 25-year period: no decline in quality. Fertil Steril 1996;65:1009–414 [DOI] [PubMed] [Google Scholar]
- 2.Vierula M, Niemi M, Keiski A, et al. High and unchanged sperm counts of Finnish men. Int J Androl 1996;19:11–17 [DOI] [PubMed] [Google Scholar]
- 3.Jørgensen N, Andersen AG, Eustache F, et al. Regional differences in semen quality in Europe. Hum Reprod 2001;16:1012–19 [DOI] [PubMed] [Google Scholar]
- 4.Jørgensen N, Carlsen E, Nermoen I, et al. East-West gradient in semen quality in the Nordic-Baltic area: a study of men from the general population in Denmark, Norway, Estonia and Finland. Hum Reprod 2002;17:2199–208 [DOI] [PubMed] [Google Scholar]
- 5.Punab M, Zilaitiene B, Jørgensen N, et al. Regional differences in semen qualities in the Baltic region. Int J Androl 2002;25:243–52 [DOI] [PubMed] [Google Scholar]
- 6.Swan SH, Brazil C, Drobinis EZ, et al. Geographic differences in semen quality of fertile US males. Environ Health Perspect 2003;111:414–20 [DOI] [PMC free article] [PubMed] [Google Scholar]
- 7.Paasch U, Salzbrunn A, Glander HJ, et al. Semen quality in sub-fertile range for a significant proportion of young men from the general German population: a co-ordinated, controlled study of 791 men from Hamburg and Leipzig. Int J Androl 2008;31:93–102 [DOI] [PubMed] [Google Scholar]
- 8.Fernandez MF, Duran I, Olea N, et al. Semen quality and reproductive hormone levels in men from southern Spain. Int J Androl 2012;35:1–10 [DOI] [PMC free article] [PubMed] [Google Scholar]
- 9.Adami HO, Bergström R, Möhner M, et al. Testicular cancer in nine northern European countries. Int J Cancer 1994;59:33–8 [DOI] [PubMed] [Google Scholar]
- 10.Itoh N, Kayama F, Tatsuki TJ, et al. Have sperm counts deteriorated over the past 20 years in healthy, young Japanese men? Results from the Sapporo area. J Androl 2001;22:40–4 [PubMed] [Google Scholar]
- 11.World Health Organization Laboratory manual for examination of human semen and sperm-cervical mucus interaction. 4th edn. Cambridge, UK: Cambridge University Press, 1992 [Google Scholar]
- 12.Menkveld R, Stander FS, Kotze TJ, et al. The evaluation of morphological characteristics of human spermatozoa according to stricter criteria. Hum Reprod 1990;5:586–92 [DOI] [PubMed] [Google Scholar]
- 13.Vermeulen A, Verdonck L, Kaufman JM. A critical evaluation of simple methods for the estimation of free testosterone in serum. J Clin Endocrinol Metab 1999;84:3666–72 [DOI] [PubMed] [Google Scholar]
- 13.Muller A, De La Rochebrochard E, Labbé-Declèves C, et al. Selection bias in semen studies due to self-selection of volunteers. Hum Reprod 2004;19:2838–44 [DOI] [PubMed] [Google Scholar]
- 15.Iwamoto T, Nozawa S, Yoshiike M, et al. Semen quality of fertile Japanese men: a cross-sectional population-based study of 792 men. BMJ Open 2013;3:e002223. [DOI] [PMC free article] [PubMed] [Google Scholar]
- 16.Vital statics in Japan, Ministry of Health, Labour and Welfare Japan, 2009
- 17.Jensen TK, Slama R, Ducot B, et al. Regional differences in waiting time to pregnancy among fertile couples from four European cities. Hum Reprod 2001;16:2697–704 [DOI] [PubMed] [Google Scholar]
- 18.Eustache F, Auger J, Cabrol D, et al. Are volunteers delivering semen samples in fertility studies a biased population? Hum Reprod 2004;19:2831–7 [DOI] [PubMed] [Google Scholar]
- 19.Jørgensen N, Liu F, Andersson AM, et al. Serum inhibin-B in fertile men is strongly correlated with low but not high sperm counts: a coordinated study of 1,797 European and US men. Fertil Steril 2010;94:2128–34 [DOI] [PMC free article] [PubMed] [Google Scholar]
- 20.Jørgensen N, Auger J, Giwercman A, et al. Semen analysis performed by different laboratory teams: an intervariation study. Int J Androl 1997;20:201–8 [DOI] [PubMed] [Google Scholar]
- 21.Cooper TG, Brazil C, Swan SH, et al. Ejaculate volume is seriously underestimated when semen is pipetted or decanted into cylinders from the collection vessel. J Androl 2007;28:1–4 [DOI] [PubMed] [Google Scholar]
- 22.Gao J, Gao ES, Yang Q, et al. Semen quality in a residential, geographic and age representative sample of healthy Chinese men. Hum Reprod 2007;22:477–84 [DOI] [PubMed] [Google Scholar]
- 23.Li Y, Lin H, Ma M, et al. Semen quality of 1346 healthy men, results from the Chongqing area of southwest China. Hum Reprod 2009;24:459–69 [DOI] [PubMed] [Google Scholar]
- 24.Junqing W, Qiuying Y, Jianguo T, et al. Reference value of semen quality in Chinese young men. Contraception 2002;65:365–8 [DOI] [PubMed] [Google Scholar]
- 25.Storgaard L, Bonde JP, Ernst E, et al. Does smoking pregnancy affect son's sperm count? Epidemiology 2003;14:278–86 [PubMed] [Google Scholar]
- 26.Jensen TK, Jørgensen N, Punab M, et al. Association of in utero exposure to maternal smoking with reduced semen quality and testis size in adulthood: a cross-sectional study of 1,770 young men from the general population in five European countries. Am J Epidemiol 2004;159:49–58 [DOI] [PubMed] [Google Scholar]
- 27.Ranvborg TL, Jensen TK, Andersen AM, et al. Prenatal and adult exposures to smoking are associated with adverse effects on reproductive hormones, semen quality, final height and body mass index. Hum Reorod 2011;26:1000–11 [DOI] [PubMed] [Google Scholar]
- 28. The National Health and Nutrition Survey 2008, Ministry of Health, Labour and Welfare, Japan.
- 29.Jørgensen N, Asklund C, Carlsen E, et al. Coordinated European investigations of semen quality: Results from studies of Scandinavian young men is a matter of concern. Int J Androl 2006;29:54–61 [DOI] [PubMed] [Google Scholar]
- 30.Axelsson J, Rylander L, Ringnell-Hybdom A, et al. No secular trend over the last decade in sperm counts among Swedish men from general population. Hum Reprod 2011;26:1012–16 [DOI] [PubMed] [Google Scholar]
- 31.Tsarev I, Gagonin V, Giwercman A, et al. Sperm concentration in Latvian military conscripts as compared with other countries in the Nordic-Baltic area. Int J Androl 2005;28:208–14 [DOI] [PubMed] [Google Scholar]
- 32.Jørgensen N, Vierula M, Jacobsen R, et al. Recent adverse trends in semen quality and testis cancer incidence among Finnish men. Int J Androl 2011;34:e37–48 [DOI] [PMC free article] [PubMed] [Google Scholar]
- 33.World Health Organisation WHO laboratory manual for the examination and processing of human semen. 5th edn. 2010. http://whqlibdoc.who.int/publications/2010/9789241547789_eng.pdf (accessed 23 April 2013).
- 34.Bonde JP, Ernst E, Jensen TK, et al. Relation between semen quality and fertility: a population-based study of 430 first-pregnancy planners. Lancet 1998;352:1172–7 [DOI] [PubMed] [Google Scholar]
- 35.Guzick DS, Overstreet JW, Factor-Litvak P, et al. Sperm morphology, motility, and concentration in fertile and infertile men. N Engl J Med 2001;345:1388–93 [DOI] [PubMed] [Google Scholar]
- 36.Slama R, Eustache F, Ducot B, et al. Time to pregnancy and semen parameters: a cross-sectional study among fertile couples from four European cities. Hum Reprod 2002;17:503–15 [DOI] [PubMed] [Google Scholar]
- 37.Jedrzejczak P, Taszarek-Hauke G, Hauke J, et al. Prediction of spontaneous conception based on semen parameters. Int J Androl 2008;31:499–507 [DOI] [PubMed] [Google Scholar]
Associated Data
This section collects any data citations, data availability statements, or supplementary materials included in this article.