

Abstract
Two hundred seven patients with DSM IV Pathological Gambling Disorder completed both the Gambling Symptom Assessment Scale (G-SAS) and the Yale-Brown Obsessive Compulsive Scale – modified for Pathological Gambling (PG-YBOCS) at baseline visit and weekly or biweekly thereafter during the 12 week study period. The week 1 to week 2 visit data were used to assess test-retest reliability. Weekly or biweekly data were used for the G-SAS validity. The PG-YBOCS reliability and validity data have been published previously. We used the PG-YBOCS as the established scale and compared the G-SAS performance to the PG-YBOCS. Test re-test reliability was statistically significant. The correlations between the G-SAS and the PG-YBOCS and Clinical Global Impression rating were excellent. Findings suggest that the G-SAS is reliable and valid in assessing changes in symptoms during a drug treatment study.
Keywords: Gambling Symptom Assessment Scale (G-SAS), Yale-Brown Obsessive-Compulsive Scale-Pathological Gambling (PG-YBOCS), Pathological Gambling Disorder, rating scale, reliability, validity
1. Introduction
A need for gambling disorder treatment grew steadily in recent years because of the expanding gaming business in the U.S. and throughout the world and increased recognition among clinicians and the general public of the devastating consequences of pathological gambling. Clinical investigators involved in drug trials needed a validated rating scale to assess changes in gambling symptoms. Lesieur and Blume published the South Oaks Gambling Screen (SOGS) in 1987 (Lesieur et al., 1987). The SOGS is a valuable instrument that is widely used in gambling research, however, the instrument was designed primarily to screen for problem gamblers. Winters and his colleagues reported a gambling symptom severity measurement scale for adolescents (Winters et al., 1993).
Raylu and Oei (2004) published the Gambling Urge Scale. This scale would serve well in assessing gambling urge symptoms. In 2005, de Castro and her colleges reported the reliability and construct validity data on the Gambling Follow-up Scale (GFS), a physician rated scale (de Castro et al., 2005). In the same year Petry (2005) presented the reliability and validity data on the University of Rhode Island Change Assessment (URICA) scale based on the data from subjects with gambling disorder.
Recently, Hollander, DeCaria and colleagues modified the Yale-Brown Obsessive Compulsive Scale for use in gambling disorder treatment studies (PG–YBOCS) (physician rated scale) and the psychometric data for the PG-YBOCS have been published (Pallanti et al., 2005). The G-SAS is a self-rated scale that encompasses gambling urges, thoughts, behaviors and interpersonal function. The scale description and its development are described below.
1.1. The Gambling Symptom Assessment Scale (G-SAS)
1.1.1. Scale description
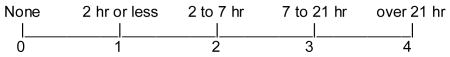
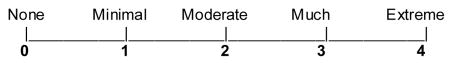
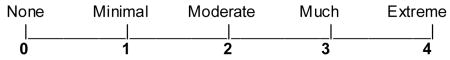
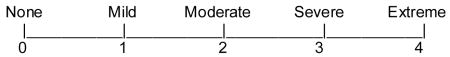
The G-SAS (see appendix) is a 12-item self-rated scale designed to assess gambling symptom severity and change during treatment. The G-SAS is not a diagnostic or screening instrument. Each 12-item scale has a score ranging from 0 – 4 (adjective anchors for 0 and 4 vary for each item). All items ask for an average symptom based on the past 7 days. Items 1 – 4 ask for the average urge (only gambling urges, excludes other urges) (analogous to Penn Alcohol Craving Scale by Flannery et al., 1999) symptom severity, frequency, duration and control; items 5 – 7 ask for the average frequency, duration and control of thoughts associated with gambling (excludes other thoughts); item 8 asks for the time spent on gambling or gambling related behavior, item 9 asks for the anticipatory tension and/or excitement caused by an imminent gambling act; item 10 asks for the excitement and pleasure associated with winning, item 11 asks for emotional distress (mental pain, anguish, shame, guilt, or embarrassment) caused by gambling and item 12 asks for personal trouble (relationship, financial, legal, job, medical or health) caused by gambling. Every effort was given to enhance objectivity and avoid an analog construct. Five items are semi-quantifiable and items 2, 5, and 8 are more objective than the rest. Items 1 – 4 can be used to assess changes in urge symptoms. Total score ranges from 0 – 48: extreme = 41 – 48, severe = 31 – 40, moderate = 21 – 30, mild = 8 – 20.
1.1.2. Scale development
The G-SAS has incorporated the concepts used in the Leyton Obsessional Inventory (LOI) (Cooper, 1970) and the Yale-Brown Obsessive Compulsive Scale (Y-BOCS) (Goodman et al., 1989a and 1989b). The LOI gathers information through 46 inventory items comprised of obsessive or compulsive symptoms and 23 trait items. The “yes” answers given to each inventory item forms the basis for an assessment of symptom severity in the form of resistance and interference. The shortcomings of this scale are that the inventory items may not match the symptoms of a given patient and as a result may lead to a low score even though the patient may suffer from severe symptoms (Kim et al, 1990). The Y-BOCS, on the other hand, asks for an average of all obsessive compulsive disorder symptoms. Although this enhances the sensitivity of the scale, it does not allow investigators to analyze changes in a defined subgroup of symptoms such as washing or checking over a treatment course.
The G-SAS items do not include specific individual symptoms (such as thinking about stealing money to gamble), rather it broadly asks for symptoms that pertain to the three domains (urges, thoughts, and gambling behavior). It also adopts an idea from the Y-BOCS and asks for average symptoms during the past 7 days. The G-SAS does not assess the degree of resistance against gambling related thoughts and urges (see discussion). In assessing the frequency of gambling, the number of trips to a casino is counted instead of the number of gambling activities in a given trip.
The G-SAS was developed not only to detect changes in gambling symptom severity during a treatment but also to provide the data on the pattern of changes for each subgroup of symptoms allowing investigators to analyze the variation of the treatment response pattern unique to each treatment mode. For example, gambling behavior may have stopped through a treatment method but the patient may still have severe gambling urges.
In addition to the rationale described above, the G-SAS, a self-rated scale, was developed so that it could be used in studies in which physician administration of the scale (required for the PG-YBOCS) is not possible, such as survey studies or large scale studies.
The previous version of the G-SAS test-retest reliability showed a good correlation: N = 58, r = 0.704. For the internal consistency, Cronbach’s α = 0.890 and one-factor model G-SAS item loading ranged from 0.661 to 0.811 (Kim and Grant, 2001a). The two-factor model showed that urge symptom item 1 (severity measure) coheres with the significant gambling symptoms such as gambling-related subjective distress, interpersonal difficulty, and gambling activities. The G-SAS showed a good convergent validity when compared to the Pathological Gambling-Clinical Global Impression (PG-CGI) (Improvement): N = 48, r = 0.043 (the first visit in which changes in symptom are recorded), visits 4 – 13 (visit 4 = one week after changes in symptoms are recorded) “r” range from 0.677 to 0.823, p < 0.01 (2-tailed) in all visits.
Each scale item interval has been adjusted to five and added two new items to enhance sensitivity. Because of the changes we made, we examined the psychometric properties of the revised scale based on the preliminary data available from an active treatment study. The revised G-SAS showed a superior convergent validity when compared to the PG-CGI (Improvement and Severity): the median correlation between the G-SAS vs. CGI (Improvement) over an eight-week period (N ranges 16-8, V1 – V4) = 0.784. For the G-SAS vs. CGI (Severity) r = 0.812. The preliminary psychometric data and the revised G-SAS have been published recently (Kim et al., 2001b).
In the present report we used the recent multicenter nalmefene treatment data to assess the test-retest reliability and validity for the G-SAS.
2. Methods
Fifteen study sites randomized 207 subjects either to nalmefene or placebo group. Subjects were recruited through newspaper advertisements and referrals for medication treatment. All subjects met primary DSM-IV diagnosis of Pathological Gambling Disorder, clinician-administered Structured Clinical Interview for Pathological Gambling (SCI-PG) (Grant et al., 2004), a minimum score of 5 or more on the South Oaks Gambling Screen (SOGS) (Lesieur et al., 1987), a score of 2 or more on the urge component of the G-SAS (moderately severe urges or more). Gambling behavior within 2 weeks before enrollment was required. Negative pregnancy test was required for women subjects. Exclusion criteria were 1) current DSM-IV (SCID) Axis I diagnosis except for nicotine dependence, 2) life-time bipolar affective disorder confirmed through SCID, 3) SCID substance use or dependence within past 3 months, 4) gambling treatment within the past 6 months (Gamblers Anonymous treatment was allowed), 5) baseline Hamilton Depression and Anxiety Rating Scale scores < 17, 6) positive urine drug screen except for cannabis, 7) clinically significant medical disorder, 8) concomitant use of psychotropic medication. At the end of the 16 week treatment, the nalmefene treated group improved significantly more than the placebo group (n = 102, F = 5.46, p = 0.006). Consent form was obtained from all study participants.
The reliabilities of both the PG-YBOCS and the G-SAS were measured using two repeated test scores from each subject in the placebo group. The variability of these scores from the subject’s mean value was determined and expressed as a pooled standard deviation. This gives an estimate of the repeatability of the test results for a given subject and is known as the test-retest or within subject standard deviation (SD) (Snedecor and Cochran, 1980). Due to the difference in means and ranges of the two instruments, the coefficient of variation (CV) was computed for each subject to adjust for the different measurement scales and to allow for a statistical comparison of reliability between the G-SAS and the PG-YBOCS. The Spearman correlation was calculated for each test as another measure of reliability. Because the G-SAS and PG-YBOCS provide ordinal categorical measures, weighted kappa for each item was computed as another measure of test – retest reliability.
For the validity study, a correlation between the total G-SAS score and the total PG-YBOCS score was obtained. The two tests were categorized as above or not above the median value and cross-classified to reflect the amount of agreement.
At the end of the 16-week nalmefene trial, clinical global improvement scores were obtained from the patient and from the physician. Both scales ranged from I to 7, with 1 = very much improved, 2 = much improved, 3 = minimally improved, 4 = unchanged, 5 = minimally worse, 6 = much worse, and 7 = very much worse. Changes in PG-YBOCS and G-SAS scores from baseline to week 16 were calculated as simple change scores and as % change from baseline. Spearman correlation coefficients between these change scores and the global ratings from the patient and physician were calculated and compared using Fisher’s r-to-z transformation.
3. Results
3.1. Test-retest reliability and internal item consistency
The study did not include placebo lead-in period so we used the week 1 to week 2 visits placebo group data for the reliability study (in the current study, the G-SAS and PG-YBOCS data were obtained at screening visit but not at baseline visit, thus the week 1 and week 2 data comprise the first week to week data) (N=44). Table 1 presents the means and standard deviations of the G-SAS total score and the PG-YBOCS total, thinking, and behavior scores. The PG-YBOCS total score had a significantly higher test-retest correlation than did the G-SAS total score suggesting more reliability (Table 2). Table 3 shows excellent internal item consistency for both the G-SAS and PG-YBOCS. The G-SAS showed a higher internal item consistency (Cronbach’s alpha) over the PG-YBOCS (Table 3). Table 4 shows weighted kappa for the G-SAS and PG-YBOCS items for the week 1 and week 2.
Table 1.
Week 1 and week 2 means and standard deviations
| Placebo Group (N = 44) | G-SAS Mean (S.D.) | PG-YBOCS Mean (S.D.) | PG-YBOCS Thinking Mean (S.D.) | PG-YBOCS Behavior Mean (S.D.) |
|---|---|---|---|---|
| Week 1 | 23.91 (8.19) | 17.07 (7.92) | 9.07 (3.34) | 8.00 (5.03) |
| Week 2 | 22.64 (8.58) | 15.20 (7.03) | 7.82 (3.66) | 7.39 (3.98) |
Table 2.
Test - retest reliabilities of the G-SAS and the PG - YBOCS total scores (N = 44).
| G-SAS total | PG-YBOCS | p-value of G-SAS vs. PG-YBOCS | |
|---|---|---|---|
| Mean score | 23.27 | 16.14 | |
| Standard Deviation | 5.73 | 3.52 | |
| CV | 0.28 | 0.27 | 0.815 |
| Rho | 0.56 | 0.79 | 0.047 |
Standard Deviation: standard deviation of within-patient variability; CV: average coefficient of variability (paired t-test); rho = Spearman correlation coefficient (Fisher’s r-to-z test). Mean score = mean of week 1 and week 2 mean values for the placebo group. We used the PG-YBOCS as the standard measure and compared the G-SAS through S.D., CV and Rho. All three values for each scale show that PG-YBOCS is more reliable but there was no statistical difference between the two scales.
Table 3.
G-SAS and PG-YBOCS Reliability Analyses (Internal Item Consistency)
| G-SAS | PG-YBOCS | |
|---|---|---|
| Data collected | Screen visit | Screen visit |
| N | 207 | 206 |
| Scale Mean | 31.43 | 23.26 |
| Scale Std. Dev. | 7.353 | 5.071 |
| Alpha | 0.869 | 0.766 |
| Alpha if Item Removed | Alpha if Item Removed | |
| Item #1 | 0.858 | 0.758 |
| Item #2 | 0.862 | 0.728 |
| Item #3 | 0.852 | 0.751 |
| Item #4 | 0.854 | 0.759 |
| Item #5 | 0.862 | 0.750 |
| Item #6 | 0.853 | 0.737 |
| Item #7 | 0.853 | 0.728 |
| Item #8 | 0.855 | 0.739 |
| Item #9 | 0.858 | 0.775 |
| Item #10 | 0.873 | 0.741 |
| Item #11 | 0.861 | |
| Item #12 | 0.867 |
Scale mean = mean G-SAS and PG-YBOCS values from all study subjects at baseline visit.
The G-SAS shows a superior correlation alpha over the PG-YBOCS.
Correlation alpha was also computed with each item omitted to assess relative contribution of each item to the overall alpha for each scale. For example, in a previous study, the resistance items within the Y-BOCS lowered the overall alpha.
The finding is extended in the current study (see the alpha without items 4 or 9 of the PG-YBOCS).
Table 4.
G-SAS and PG-YBOCS Reliability Analyses: Week 1 and Week 2 (Weighted Kappa)
| G-SAS | PG-YBOCS | |
|---|---|---|
| Item #1 | 0.304 | 0.669 |
| Item #2 | 0.528 | 0.509 |
| Item #3 | 0.393 | 0.573 |
| Item #4 | 0.339 | 0.731 |
| Item #5 | 0.600 | 0.642 |
| Item #6 | 0.485 | 0.699 |
| Item #7 | 0.311 | 0.568 |
| Item #8 | 0.526 | 0.509 |
| Item #9 | 0.558 | 0.414 |
| Item #10 | 0.523 | 0.566 |
| Item #11 | 0.394 | |
| Item #12 | 0.612 |
N = 44; Fair = 0.21 – 0.40; Moderate = 0.41 – 0.60; Substantial = 0.61 = 0.80;
Almost perfect = 0.81 – 1.00 (Bartco, 1991; Landi and Koch, 1977)
Test – retest simple correlations for the G-SAS was 0.56 (p < 0.001) and 0.79 (p < 0.001) for the PG-YBOCS. To check if certain study subject data are causing the G-SAS reliability to be low, we ran a regression of visit 2 G-SAS total score on visit 1 G-SAS total score and calculated the residual score for each subject. We then examined the distribution of the residual scores using Tukey’s Hinges (Tukey, 1977) to identify outliers. There were five outliers for the G-SAS scores but there were none for the PG-YBOCS. Without the outliers, the G-SAS test – retest reliability reached 0.781. The outliers may have occurred due in part to the fact that the scale is rated by the patients. Thus, the true correlation score is still 0.56.
3.2. Validity
For the validity study comparing all subjects (N=207) at baseline, Spearman correlations between the PG-YBOCS total and the G-SAS total score were found to be good (rho = 0.51). At baseline, the PG-YBOCS and G-SAS had 65% agreement when coded as above and below the median (see table 5).
Table 5.
Comparison of the G-SAS score and the PG-YBOCS total score. Screen visit data – all subjects (n = 207)
| G-SAS at or below median | G-SAS Above median | Total | |
|---|---|---|---|
| PG-YBOCS total | |||
| At or below median | 68 | 36 | 104 |
| Above median | 38 | 65 | 103 |
| 64.3% agreement Chi-square=16.813 | 106 | 101 | 207 |
| PG-YBOCS thinking | |||
| At or below median | 74 | 40 | 114 |
| Above median | 32 | 61 | 93 |
| 65.3% agreement Chi-square=19.074 | 106 | 101 | 207 |
| PG-YBOCS behavior | |||
| At or below median | 73 | 40 | 113 |
| Above median | 33 | 61 | 94 |
| 64.7% agreement Chi-square=17.867 | 106 | 101 | 207 |
Excellent agreement (Chi-square) found between the G-SAS scores and PG-YBOCS scores at baseline visit
For the validity study, comparing changes during treatment between the PG-YBOCS and G-SAS scores, Tables 6 and 7 present Spearman correlation coefficients between the PG-YBOCS vs. G-SAS; the PG-YBOCS vs. physician rated CGI; the G-SAS vs. physician rated CGI; the PG-YBOCS vs. patient rated CGI; the G-SAS vs. patient rated CGI, respectively. Fisher r-to-z transformations were calculated to detect any significant differences between the correlations in the PG-YBOCS and G-SAS scores vs. the CGI Ratings of change. For subject rated CGI, there is no difference between G-SAS and PG-YBOCS in agreement with the subject’s rating. For the physician ratings, the PG-YBOCS total score showed a better agreement than the G-SAS total score.
Table 6.
Drug group only N=125 (LOCF) Correlations of G-SAS and PG-YBOCS change scores
| Correlated with | Rho | |
|---|---|---|
| Change Score | Change Score | |
| G-SAS | PG-YBOCS total | 0.812 |
| PG-YBOCS thinking | 0.777 | |
| PG-YBOCS behavior | 0.725 | |
| % Change Score | % Change Score | |
| G-SAS | PG-YBOCS total | 0.851 |
| PG-YBOCS thinking | 0.826 | |
| PG-YBOCS behavior | 0.764 |
Table 7.
Drug group only N=124 (LOCF) Correlations with physician and subject-rated CGI.
| Rho | Rho | Fisher r-to-z | p-value | ||
|---|---|---|---|---|---|
| Change Score | |||||
| G-SAS vs. P-CGI | .690 | PG-YBOCS total vs. P-CGI | 0.794 | 1.825 | 0.068 |
| PG-YBOCS thinking vs. P-CGI | 0.711 | 0.321 | 0.748 | ||
| PG-YBOCS behavior vs. P-CGI | 0.765 | 1.249 | 0.212 | ||
| G-SAS vs. S-CGI | 0.705 | PG-YBOCS total vs. S-CGI | 0.729 | 0.385 | 0.700 |
| PG-YBOCS thinking vs. S-CGI | 0.647 | −0.834 | 0.404 | ||
| PG-YBOCS behavior vs. S-CGI | 0.714 | 0.141 | 0.888 | ||
P-CGI = Physician rated CGI, S-CGI = Subject rated CGI
4. Discussion
The G-SAS data we present herein suggest that the G-SAS is reliable and valid in assessing symptom severity and changes in gambling symptoms during a treatment. The PG-YBOCS test-retest reliability, however, was greater than that of the G-SAS. Cronbach’s alpha for the baseline visit, on the other hand, shows that the internal consistency of the G-SAS is greater than that of the PG-YBOCS.
The validity study showed that the G-SAS is valid in measuring symptom severity at baseline and also in assessing changes in symptom severity during treatment. Since the PG-YBOCS has been validated previously (Pallanti et al., 2005) we compared the G-SAS symptom change scores and the % symptom change scores to those of the PG-YBOCS. The correlation values for the symptom change scores and % symptom change scores were good (0.81 and 0.85 each). When the physician rated CGI and patient rated CGI were used as established standards both the PG-YBOCS and G-SAS scores showed good correlations except in the case of physician rated CGI, the PG-YBOCS scores showed a higher correlation value.
It is interesting to note that correlation value between the G-SAS (self-rated) total scores and the self-rated CGI scores is better (although a difference of 0.15 is a well within random variation) than the correlation value between the G-SAS total scores and physician rated CGI scores. The physician rated PG-YBOCS total scores are also more tightly correlated with the physician rated CGI scores than the patient rated CGI scores. The variations in correlation values observed above might be, to a small degree, linked to a tendency by clinicians and patients to rate symptom severity similarly for the two different scales.
In the original G-SAS we included ‘weekly amount of money loss’ as a measure to assess gambling symptom change but treatment outcome study data (factor analysis) showed that the item that measures money loss showed the lowest factor loading (0.56) in comparison to the rest of the scale items (0.66 to 0.81). When we went back to the medical records and interviewed the patients who showed a rather dramatic improvement in terms of money loss we found out that the reason for not losing money was not necessarily because of gambling symptom improvement, rather it was because they did not have money left to gamble. So, it gave a false impression that they were improving. Therefore, we removed the money loss item from the G-SAS.
Likewise, we were careful not to include resistance items in the G-SAS. This was based on our previous study that showed that resistance items within the Y-BOCS adversely affected scale sensitivity (Kim et al., 1994). Ideally, each scale item should move in tandem with the rest of the scale items in the course of symptom change. In the case of the Y-BOCS, resistance symptoms seem to move independent of the rest of the scale items. When symptoms are mild patients often are able to resist and suppress the symptoms. As the symptoms escalate, resistance symptoms also seem to increase along with the rest of the gambling symptoms. However, when symptoms become severe resistance symptoms seem to decrease in intensity while the rest of the gambling symptoms seem to increase in intensity. That is, resistance symptoms seem to move in an opposite direction from the rest of the scale items. Therefore, resistance symptoms are viewed as a healthy part (not a disease process) of the self trying to cope with the pathological side (PGD) of the disease process.
Although not the primary objectives of this paper, the two and three factor, factor analytic study (Varimax rotated) of the current version of the PG-YBOCS showed that resistant items within the gambling obsessions (item 4) and gambling compulsions sections (item 9) segregate and affect the scale performance adversely (data not shown). This finding essentially confirms our previous findings (Kim et al., 1994) that resistance items do not change in tandem with the rest of the gambling symptoms. The overall psychometric data we have on the PG-YBOCS suggest that the scale performs very well during clinical trials, however, we believe, with minor adjustment the scale would perform even better.
Limitations
In developing the G-SAS we paid close attention to the urge symptom subscales. Most gamblers have reasonably strong gambling urge symptoms and some of them have very strong urges but not all. Some gamblers, especially chronic gamblers, often present mild or no urges to gamble or excitement after winning. To them gambling is a form of habit, very much like what clinicians see from chronic drug users. We expect that the G-SAS would not be as sensitive for these patients. Also, for those patients who gamble primarily to escape from depression, loneliness or stress, the G-SAS may not be as sensitive a scale as it was intended to be. Investigators using the G-SAS need to pay close attention during the first and second visits to ensure that each study subject understands the questionnaires correctly and also to minimize carelessness that might arise due to the fact that it is a self-rated scale. Also, a self-rated scale is usually inferior to a clinician rated scale.
Acknowledgments
The multisite study, the data of which the current study is based, was sponsored by BioTie Therapies, Helsinki, Finland. The work was, in part, supported by grants from the National Institute of Mental Health (K23 MH069754-01A1) to Dr. Grant and the National Institute of Drug Abuse (R01 DA013039; R01 DA019039) to Dr. Potenza.
Appendix
Gambling Symptom Assessment Scale (G-SAS)
The following questionnaires are aimed at evaluating gambling symptoms. Please read the questions carefully before you answer.
-
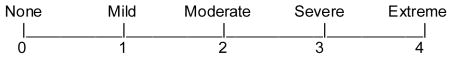
If you had unwanted urges to gamble during the past WEEK, on average, how strong were your urges? Please circle the most appropriate number:
-
During the past WEEK, how many times did you experience urges to gamble? Please circle the most appropriate number.
0) None
1) Once
2) Two to three times
3) Several to many times
4) Constant or near constant
-
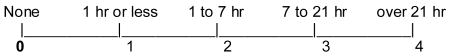
During the past WEEK, how many hours (add up hours) were you preoccupied with your urges to gamble? Please circle the most appropriate number.
-
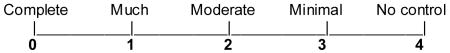
During the past WEEK, how much were you able to control your urges? Please circle the most appropriate number.
-
During the past WEEK, how often did thoughts about gambling and placing bets come up? Please circle the most appropriate number.
0) None
1) Once
2) Two to four times
3) Several to many times
4) Constantly or nearly constantly
-
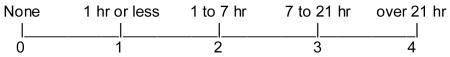
During the past WEEK, approximately how many hours (add up hours) did you spend thinking about gambling and thinking about placing bets? Please circle the most appropriate number.
-
During the past WEEK, how much were you able to control your thoughts of gambling? Please circle the most appropriate number.

-
During the past WEEK, approximately how much total time did you spend gambling or on gambling related activities? Please circle the most appropriate number.
-
During the past WEEK, on average, how much anticipatory tension and/or excitement did you have shortly before you engaged in gambling? If you did not actually gamble, please estimate how much tension and/or excitement you believe you would have experienced, if you had gambled. Please circle the most appropriate number.
-
During the past WEEK, on average, how much excitement and pleasure did you feel when you won on your bet. If you did not actually win at gambling, please estimate how much excitement and pleasure you would have experienced, if you had won. Please circle the most appropriate number.
-
During the past WEEK how much emotional distress (mental pain or anguish, shame, guilt, embarrassment) has your gambling caused you? Please circle the most appropriate number.
-
During the past WEEK how much personal trouble (relationship, financial, legal, job, medical or health) has your gambling caused you? Please circle the most appropriate number.
Maximum score = 48
Extreme = over 40
Severe = 31 – 40
Moderate = 21 – 30
Mild = 8 – 20
Footnotes
Publisher's Disclaimer: This is a PDF file of an unedited manuscript that has been accepted for publication. As a service to our customers we are providing this early version of the manuscript. The manuscript will undergo copyediting, typesetting, and review of the resulting proof before it is published in its final citable form. Please note that during the production process errors may be discovered which could affect the content, and all legal disclaimers that apply to the journal pertain.
References
- Bartco JJ. Measurement and reliability: statistical thinking considerations. Schizophrenia Bullietin. 1991;17:483–489. doi: 10.1093/schbul/17.3.483. [DOI] [PubMed] [Google Scholar]
- de Castro V, Fuentes D, Tavares H. The gambling follow-up scale: development and reliability testing of a scale for pathological gamblers under treatment. Canadian Journal of Psychiatry. 2005;50:81–86. doi: 10.1177/070674370505000202. [DOI] [PubMed] [Google Scholar]
- Cooper J. Leyton Obsessional Inventory. Psychological Medicine. 1970;1:48–64. doi: 10.1017/s0033291700040010. [DOI] [PubMed] [Google Scholar]
- Flannery BA, Volpicelli JR, Pettinati HM. Psychometric properties of the Penn Alcohol Craving Scale. Alcoholism: Clinical & Experimental Research. 1999;23:1289–1295. [PubMed] [Google Scholar]
- Goodman WK, Price LH, Rasmussen SA, Mazure C, Fleischmann RL, Hill CL, Heninger GR, Charney DS. The Yale-Brown Obsessive Compulsive Scale. I. Development, use, and reliability. Archives of General Psychiatry. 1989a;46:1006–1011. doi: 10.1001/archpsyc.1989.01810110048007. [DOI] [PubMed] [Google Scholar]
- Goodman WK, Price LH, Rasmussen SA, Mazure C, Delgado P, Heninger GR, Charney DS. The Yale-Brown Obsessive Compulsive Scale. II. Validity. Archives of General Psychiatry. 1989b;46:1012–1016. doi: 10.1001/archpsyc.1989.01810110054008. [DOI] [PubMed] [Google Scholar]
- Grant JE, Steinberg M, Kim SW, Rounsaville B, Potenza MN. Preliminary validity and reliability testing of a Structured Clinical Interview for Pathological Gambling (SCI-PG) Psychiatry Research. 2004;128:79–88. doi: 10.1016/j.psychres.2004.05.006. [DOI] [PubMed] [Google Scholar]
- Kim SW, Dysken MW, Kuskowski M. The Yale-Brown Obsessive-Compulsive Scale: A reliability and validity study. Psychiatry Research. 1990;34:99–106. doi: 10.1016/0165-1781(90)90061-9. [DOI] [PubMed] [Google Scholar]
- Kim SW, Dysken MW, Pheley AM, Hoover KM. The Yale-Brown Obsessive-Compulsive Scale (Y-BOCS): Measures of internal consistency. Psychiatry Research. 1994;51:203–211. doi: 10.1016/0165-1781(94)90039-6. [DOI] [PubMed] [Google Scholar]
- Kim SW, Grant JE. An open naltrexone treatment study in pathological gambling disorder. International Clinical Psychopharmacology. 2001a;16:285–289. doi: 10.1097/00004850-200109000-00006. [DOI] [PubMed] [Google Scholar]
- Kim SW, Grant JE, Adson DE, Shin YC. Double-blind naltrexone and placebo comparison study in the treatment of pathological gambling. Biological Psychiatry. 2001b;49:914–921. doi: 10.1016/s0006-3223(01)01079-4. [DOI] [PubMed] [Google Scholar]
- Landis JR, Koch GG. The measurement of observer agreement for categorical data. Biometrics. 1977;33:159–174. [PubMed] [Google Scholar]
- Lesieur HR, Blume SB. The South Oaks Gambling Screen (SOGS): a new instrument for the identification of pathological gamblers. American Journal of Psychiatry. 1987;144:1184–1188. doi: 10.1176/ajp.144.9.1184. [DOI] [PubMed] [Google Scholar]
- Petry NM. Stages of change in treatment-seeking pathological gamblers. Journal of Consulting and Clinical Psychology. 2005;73:312–322. doi: 10.1037/0022-006X.73.2.312. [DOI] [PubMed] [Google Scholar]
- Pallanti S, Decaria CM, Grant JE, Urpe M, Hollander E. Reliability and validity of the Pathological Gambling adaptation of the Yale-Brown Obsessive-Compulsive Scale (PG-YBOCS) Journal of Gambling Studies. 2005;21:431–443. doi: 10.1007/s10899-005-5557-3. [DOI] [PubMed] [Google Scholar]
- Raylu N, Oei TP. The gambling urge scale: development, confirmatory factor validation, and psychometric properties. Psychology of Addictive Behaviors. 2004;18:100–105. doi: 10.1037/0893-164X.18.2.100. [DOI] [PubMed] [Google Scholar]
- Snedocor GW, Cochran WG. Statistical Methods. Ames, IA: Iowa State University Press; 1980. pp. 238–246. [Google Scholar]
- Tukey JW. Exploratory data analysis. Reading, Mass: Addison-Wesley; 1977. [Google Scholar]