

Abstract
Group II metabotropic glutamate receptors (mGlu-IIs) modulate hippocampal information processing through several presynaptic actions. We describe a novel postsynaptic inhibitory mechanism mediated by the mGlu2 subtype that activates an inwardly rectifying potassium conductance in the dendrites of DG granule cells of rats and mice. Data from glutamate-uncaging experiments and simulations indicate that mGlu2-activated potassium conductance uniformly reduces the peak amplitude of synaptic inputs arriving in the distal two-thirds of dendrites, with only minor effects on proximal inputs. This unique shunting profile is consistent with a peak expression of the mGlu2-activated conductance at the transition between the proximal and middle third of the dendrites. Further simulations under various physiologically relevant conditions showed that when a shunting conductance was activated in the proximal third of a single dendrite, it effectively modulated input to this specific branch while leaving inputs in neighboring dendrites relatively unaffected. Therefore, the restricted expression of the mGlu2-activated potassium conductance in the proximal third of DG granule cell dendrites represents an optimal localization for achieving the opposing biophysical requirements for uniform yet selective modulation of individual dendritic branches.
Introduction
An important role of group II metabotropic glutamate receptors (mGlu-IIs) is the inhibition of glutamate release from mossy fibers, the axons of DG granule cells (GCs). Because mGlu-IIs, which comprise mGlu2 and mGlu3 receptors, are not expressed on neighboring associational/commissural fibers in the CA3 area, these receptors represent a useful means of distinguishing pharmacologically between synaptic responses originating from GCs as opposed to CA3 pyramidal cells (Kamiya et al., 1996). The reduction of glutamate release results from a decrease in calcium conductance mediated by mGlu2, which is localized on the preterminal axon of mossy fibers (Yokoi et al., 1996, Kamiya and Ozawa, 1999, Shigemoto et al., 1997). mGlu-IIs are also involved in the modulation of the perforant path inputs to GCs by a mechanism similar to that at mossy fiber terminals (Macek et al., 1996). In addition to these axonal localizations, mGlu-IIs have also been described in the dendritic compartment of GCs (Petralia et al., 1996), but their function there has not been investigated. In axons, the effects of G-protein-coupled receptors are thought to be limited spatially because of the required direct interaction between the molecular machinery modulating release and the receptor. In contrast, the major function of the dendrites, the integration of synaptic inputs, is influenced by remote changes in membrane parameters induced by G-protein-coupled receptors. The strength of this effect is dependent on the distance between the activated receptors and the synaptic inputs that are modulated (Gidon and Segev, 2012). The unique dendritic morphology and the sparseness of active dendritic conductances give rise to rules of dendritic integration in GCs that are distinct from those of other principal cells, and these properties are instrumental in determining the physiological roles of GCs (Krueppel et al., 2011, Schmidt-Hieber et al., 2007). However, several fundamental functions of GCs, such as their ability to represent multiple place fields and to quickly transform their firing characteristics in response to small changes in input pattern, cannot be accounted for by these mechanisms (Leutgeb et al., 2007, Rolls and Kesner, 2006). Theoretical studies suggest that one potential process underlying these physiological functions is the isolated modulation of individual dendrites (Hayman and Jeffery, 2008; Ujfalussy et al., 2009), which is required to fulfill two criteria. First, synaptic inputs within individual dendritic units have to be uniformly modulated, resulting in proportional changes of their original amplitude. Second, the modulation has to be more effective in the modulated branch(es) compared with nonmodulated branches. To date, however, experimental evidence for such dynamic, dendritic-branch-specific modulation is lacking. Here we characterized the pharmacological and electrophysiological properties of the responses induced by dendritically localized mGlu-IIs in GCs, establishing in transgenic mice that mGlu2 is the receptor responsible for the postsynaptic inhibitory current. We then localized the subcellular origin of the response to the proximal dendrite. Our data provide evidence that the circumscribed expression of mGlu2-coupled potassium conductance represents a biophysically strategic localization that enables precise and selective inhibition of individual dendrites in GCs.
Materials and Methods
Experimental procedures.
All experimental procedures were in accordance with the ethical guidelines of the Institute of Experimental Medicine Protection of Research Subjects Committee (22.1/1760/003/2009).
Electrophysiological recordings.
For rat acute slice preparations, adolescent Wistar rats (postnatal day 23–30, both sexes) were deeply anesthetized with isoflurane (in accordance with the ethical guidelines of the Institute of Experimental Medicine Protection of Research Subjects Committee) and slices (350 μm) were cut in ice-cold ACSF consisting of the following (in mm): 85 NaCl, 75 sucrose, 2.5 KCl, 25 glucose, 1.25 NaH2PO4, 4 MgCl2, 0.5 CaCl2, and 24 NaHCO3. The orientation of cutting was perpendicular to the axis of the hippocampus at its medial part to better preserve both the axonal and dendritic arborization of the cells. After the cutting, the slices were kept at 32°C for 30 min and then at room temperature until used for recordings. Cells were visualized with an upright microscope (Eclipse FN-1; Nikon) with infrared (900 nm) Nomarksi differential interference contrast optics. The recordings were made in a solution (ACSF) composed of the following (in mm): 126 NaCl, 2.5 KCl, 26 NaHCO3, 2 CaCl2, 2 MgCl2, 1.25 NaH2PO4, and 10 glucose at 35 ± 1°C using Multiclamp 700B amplifiers (Molecular Devices) with pClamp10 software. The normal intracellular solution contained the following (in mm): 90 K-gluconate, 43.5 KCl, 1.8 NaCl, 1.7 MgCl2, 10 HEPES, 2 Mg-ATP, 0.4 Na2-GTP, 10 phosphocreatine-disodium, and 8 biocytin, along with 50 μm EGTA (pH 7.2; 270–290 MΩ; pipette resistance: 3–4.5 MΩ). In experiments to block G-protein function, the 0.4 mm Na2-GTP was replaced with an equimolar amount of GDP-β-S-Li3. In intracellular BAPTA experiments, EGTA was omitted from the internal solution and the K-gluconate concentration was reduced to 85 mm to maintain the osmolarity of the solution. When a drug was applied intracellularly, wash-in of DCG IV started at least 30 min after breaking into the cells to allow sufficient time for diffusion. Dendrites were recorded using Nomarsky imaging with a high numerical aperture (NA) objective (1.1 NA). These recording solutions contained Alexa Fluor 594 (10 μm) that allowed us to label the cell through the recorded dendrite and the in situ anatomical identification of the cell after the recordings using confocal microcopy (Eclipse C1 Plus; Nikon). Criteria for the granule cell identity were the presence of dendritic spines, polarized axonal and dendritic arborization, and the position of the small parent cell body in the GC layer. In one case, we subsequently established dual somatodendritic recording for electrophysiological verification that the recorded dendrite belonged to a granule cell. Nucleated patch recordings were made from GCs by slowly retracting the recording pipette with gentle negative pressure to keep the nucleus at the tip of the pipette. Mossy fiber recordings were made from giant boutons in the stratum lucidum of the CA3b region. The anatomical criterion for accepting the structure as a mossy fiber bouton (MFB) was the presence of a large-diameter terminal with filopodial extensions in the CA3 area revealed by biocytin labeling and subsequent DAB staining (see below). For presynaptic calcium current measurements, K-gluconate and KCl were replaced with CsCl and the extracellular solution contained TTX (1 μm), 4-aminopyridine (5 mm), tetraethylammonium (10 mm) and elevated calcium concentration (3 mm). In voltage-clamp recordings, the holding current was recorded at −65 mV unless stated otherwise and series resistance was continuously monitored using 100-ms-long −5 mV voltage steps every 5 s. The input resistance was determined from the steady-state phase of the current in response to −5 mV voltage steps. The chemicals for the intracellular and extracellular solutions were purchased from Sigma-Aldrich and modulators and blockers were from Tocris Bioscience. Data are presented as means and SEM. For statistical comparison, Student's t test was used. The normality of distribution of data points were analyzed with Shapiro-Wilk test. Significant differences were at the level of p < 0.05.
Hippocampal organotypic slice cultures were prepared from 6-d-old rat pups killed by decapitation and maintained for 3–5 weeks in vitro (Gähwiler, 1981). For electrophysiological recordings, cultures were then transferred to a recording chamber on an inverted microscope and superfused with saline containing the following (in mm): 137 NaCl, 2.7 KCl, 11.6 NaHCO3, 0.4 NaH2PO4, 2 MgCl2, 3 CaCl2, 5.6 d-glucose, and 0.001% phenol red. Granule cells in these slice cultures were whole-cell voltage clamped at −70 mV using an intracellular solution that consisted of the following (in mm): 135 K-gluconate, 5 KCl, 10 HEPES, 1 EGTA, 5 phosphocreatine, 2 Mg-ATP, 0.4 Na2-GTP, and 0.07 CaCl2, pH 7.2. Cell capacitance and series resistance were monitored throughout experiments.
Slices from the acute rat preparation were fixed in 0.1 m phosphate buffer containing 4% paraformaldehyde and 0.1% picric acid for 1 d at 4°C. After fixation, slices were resectioned to 60 μm and processed for either conventional DAB staining (GCs, CA1 and CA3 pyramidal cells, and neurogliaform cells) or immunocytochemistry (basket cells and CA2 pyramidal cells). For immunocytochemistry, the sections were incubated with primary antibodies against parvalbumin (1:1000, polyclonal rabbit PV28; Swant) or calbindin (1:1000 monoclonal mouse 300; Swant) overnight in 0.5% Triton-X 100 and 2% NGS containing TBS buffer at 4°C. Immunoreactions were revealed using appropriate Alexa Fluor 488 or Alexa Fluor 594-conjugated secondary goat antibodies (Invitrogen) against rabbit and mouse IgGs, and the biocytin labeling was revealed using Alexa Fluor 350-conjugated streptavidin. In the DAB staining, endogenous peroxidase activity was blocked with 1% H2O2 after washing in phosphate buffer. After another wash, sections were incubated with ABC reagent (1:500, Vectastain ABC Elite kit; Vector Laboratories) in 0.1% Triton-X 100 containing buffer for 1 h at room temperature. Sections were preincubated with DAB and NiCl2 and the reactions were developed with 0.2% H2O2 for 3–10 min. Sections were dehydrated (50%, 70%, 90%, 95%, absolute ethanol, and Sigma HistoChoice clearing agent solutions) on slides and mounted using DPX mounting medium (Sigma). Cells were visualized with epifluorescence and conventional transmitted light microscopy (DM2500; Leica).
Granule cells were identified based on their accommodating firing pattern in which individual action potentials are followed by a fast after-depolarization (ADP) during the after-hyperpolarization (AHP) phase, polarized axonal and dendritic orientation, spines, and large-axon terminals with filopodia in the hilus and stratum lucidum of CA3. GCs with unusually high input resistance (>550 MΩ) were excluded from electrophysiological analysis to avoid young, adult-born granule cells. Ramp depolarization before firing, a typical ADP-AHP sequence, more than one large apical dendrite in the stratum radiatum, thorny excrescences on proximal dendrites, and normal spines on the distal dendrites were the characteristics of CA3 pyramidal cells. CA1 pyramidal cells were identified based on an accommodating firing pattern with a slow AHP, prominent sag, a major apical dendrite in the stratum radiatum, and spines. CA2 pyramidal cells lack thorny excrescences and are located just outside of the mossy fiber innervation zone (which was determined by calbindin staining). The axon of neurogliaform cells had numerous small boutons and formed a dense axonal arbor within the stratum moleculare of the DG. The axon occasionally entered the stratum lacunosum moleculare of CA1 and subiculum. The parvalbumin-expressing basket cells were characterized by a nonaccommodating firing pattern with fast action potentials and AHPs, a fast membrane time constant, the presence of parvalbumin, multipolar, or pyramid-shaped soma, and axons that mostly remained in the stratum granulosum. Regular-spiking perisomatic interneurons were identified based on an accommodating firing pattern, their multipolar-shaped soma, the presence of dendrites in the hilus, and the restriction of the majority of their axons within the inner third of the strata moleculare and granulosum.
Glutamate-uncaging experiments.
Slices were prepared as described for electrophysiological recording from acute rat slices. To obtain intracellular recordings, GCs were visualized with an upright microscope (Eclipse FN-1 with 25× 1.1 NA water-immersion objective; Nikon) with infrared (900 nm) Nomarksi differential interference contrast optics and imaging was performed with a single-photon confocal imaging system (Eclipse C1 Plus; Nikon).
For MNI glutamate-uncaging experiments, cells were recorded in presence of the NMDA receptor blocker APV (20 μm) with a normal intracellular solution containing 25 μm Alexa Fluor 594 to visualize the dendrites (543 nm laser, 4.8–5.9 μW at the tip of the objective) at room temperature. MNI glutamate was delivered by constant pressure from a small pipette close to the photolysis site. The solution in this pipette was normal ACSF with 14 mm MNI glutamate and 20 μm APV. The photolysis of MNI glutamate was evoked with a 405 nm laser (60–175 μW; Trigo et al., 2009) through the confocal head of the microscope at a 2.5 μm2 area (0.64 × 3.84 μm). The illumination lasted for 289 μs. Pipette capacitance neutralization (<10% uncompensated component), bridge balance compensation, and input resistance (to determine DCG IV effect) were monitored after every evoked response by applying −5 pA 200-ms-long steps. At least 20 photolysis events were evoked at resting membrane potential (in both the control solution and in presence of DCG IV or SKF97541). Only those experiments in which the DCG IV effect on the input resistance was between −16.5% and −30% (except when the agonist was coapplied with tertiapin-Q) were used for the analysis. At the end of the recordings, the three-dimensional architecture of the dendrites was imaged with higher laser intensities in the red channel for determining the somatic distance of the photolysis site.
Immunohistochemistry for light and electron microscopy.
Eleven adult male mGlu3−/− and three mGlu2−/− mice (25–30 g) were used for light and electron microscopy experiments. All experimental protocols were approved by the Austrian Animal Experimentation Ethics Board in compliance with both the European Convention for the Protection of Vertebrate Animals used for Experimental and Other Scientific Purposes (ETS #123) and the European Communities Council Directive of 24 November 1986 (86/609/EEC). Every effort was made to minimize the number and suffering of the animals used. Animals were deeply anesthetized by intraperitoneal injection of thiopental (100 mg/kg) and perfused transcardially with PBS (25 mm, 0.9% NaCl, pH 7.4), followed by ice-cold fixative made of 4% w/v paraformaldehyde and 15% of a saturated solution of picric acid in PB (0.1 m, pH 7.3) for 15 min for light microscopy experiments, or with the addition of 0.05% glutaraldehyde immediately before the perfusion for pre-embedding electron microscopy. Brains were then immediately removed from the skull, washed in 0.1 m PB, and sliced coronally in 40- or 70-μm-thick sections on a Vibratome (VT1000S; Leica Microsystems). Sections were stored in 0.1 m PB containing 0.05% sodium azide at 6°C until further use.
Immunohistochemistry for light and electron microscopy was performed according to previously published procedures (Sreepathi and Ferraguti, 2012). Briefly, free-floating sections were cryoprotected in 20% sucrose made in 0.1 m PB overnight at 4°C, and then freeze-thawed twice to allow antibody penetration. Sections were then washed in TBS (0.9% NaCl; pH 7.4) and incubated with 20% NGS in TBS to block nonspecific binding sites and then with primary antibodies diluted in TBS containing 2% NGS for 72 h at 6°C. For this study, we used the rabbit polyclonal anti-mGlu2/3 (used at a dilution of 1 μg/ml; catalog #AB1553, lot #24061610; Millipore). For light microscopy, biotinylated (diluted 1:500, catalog #BA-1000; Vector Laboratories) or Alexa Fluor 488-conjugated (diluted 1:500, catalog #A21206; Invitrogen) secondary antibodies were applied in a buffer with the same composition as for primary antibodies overnight at 6°C. For fluorescence experiments, 0.1% Triton X-100 was added to both the primary and secondary antibody solution. The sections were then washed and those incubated with fluorescent antibodies were mounted onto gelatin-coated glass slides coverslipped with Vectashield (Vector Laboratories). The other sections were incubated in the avidin-biotin-HRP complex (diluted 1:100; Vector Laboratories) in TB overnight at 6°C. On the following day, the sections were washed in TB several times, pre-incubated with DAB (0.5 mg/ml) for 5 min, and then H2O2 was added to the solution at a final dilution of 0.003% for 3–6 min. Subsequently, the sections were extensively washed with TB, mounted onto gelatin-coated glass slides, air dried, treated with graded ethanol and butyl-acetate, and coverslipped with Eukitt (Agar Scientific). Analyses were performed either under an AxioPhot microscope or AxioImager M1 equipped with Plan-Apo or Plan-Neofluar objective lenses, respectively (Zeiss). Epifluorescence illumination was obtained through a metal halide lamp and the signal visualized through the following filter block: excitation filter BP 480/40 nm, reflection short-pass filter 505 nm, and emission filter BP 527/30 nm. Fluorescence images were acquired with an ORCA-ER CCD camera (Hamamatsu) and color images were acquired with an AxioCam HR (Zeiss), both controlled by the Openlab software (version 5.5.0; Improvision). Whole images were contrast adjusted, sharpened, and cropped in Adobe Photoshop without changing any specific features within. Semiquantitative evaluation of the fluorescence signal in DG was obtained by surface plot analysis using ImageJ (version 1.45s).
For pre-embedding electron microscopy, the antigen-antibody complex was visualized either by HRP or by nanogold-silver-enhanced reaction. Sections processed for the HRP reaction were incubated with biotinylated anti-mouse secondary antibodies (diluted 1:100; Vector Laboratories) and then in ABC complex (diluted 1:100; Vector Laboratories) made up in TB overnight at 6°C. Visualization was performed with DAB (0.5 mg/ml) using 0.003% H2O2 for 3–6 min. For the nanogold-silver-enhanced reaction, sections were incubated with Fab fragment secondary antibodies coupled to nanogold (1.4 nm; Nanoprobes) and then extensively washed in milliQ water before silver enhancement of the gold particles with the HQ kit (Nanoprobes) for 8–10 min. After both reactions, sections were washed with 0.1 m PB and treated with 2% OsO4 in 0.1 m PB for 40 min at room temperature (RT) and contrasted with 1% uranyl-acetate in 50% ethanol for 30 min at RT. Sections were dehydrated and transferred into epoxy resin (Durcupan ACM; Sigma-Aldrich) overnight at RT. The following day, the sections were transferred onto greased slides, coverslipped, and incubated for 3 d at 60°C. Blocks of the DG were cut under a stereomicroscope and re-embedded in epoxy resin. Ultrathin sections (70 nm) were cut using a diamond knife (Diatome) on an ultramicrotome (Ultracut; Leica, Vienna), collected on copper slot grids coated with Pioloform, and analyzed at 80 kV in a Philips CM120 electron microscope.
Multicompartmental modeling.
Computer simulations were performed on morphologically detailed passive granule cell models (cells 3, 4, and 7 downloaded from http://senselab.med.yale.edu/ModelDb; Schmidt-Hieber et al., 2007) using the Neuron 7.2 simulation environment (Hines and Carnevale, 1997). Passive parameters (Cm ranging from 0.9 to 1.05 μF*cm−2, Rm ranging from 36.4 to 44.9 kΩ*cm2, Ri ranging from 93 to 218 Ω*cm), temperature adjustment and spine scaling were as described previously (Schmidt-Hieber et al., 2007). The reversal potential of the passive leak conductance was −80 mV. The number of segments was determined by the “d_lambda rule” for 0.1 kHz (Hines and Carnevale, 2001), except in the case of spine compartments, in which the number of dendritic segments was 5, and the integration time step was set to 0.025 ms. Increasing the temporal and spatial resolution of the simulation by a factor of 10 and 3, respectively, did not have significant effects on the results. Synaptic and uncaging-evoked conductances were simulated as a point-like transient conductance using the sum of two exponential functions with the appropriate time constants (maximum peak conductance: 1 nS, reversal potential: 0 mV). Kinetic parameters for modeling uncaging-evoked events (10–90% rise time: 0.388 ms, 3.95 ms decay time) were adjusted to match the properties of the experimentally measured membrane potential responses. The rise time constant and the decay time constant of AMPAR-mediated synaptic inputs were 0.27 ms and 2.75, respectively. The NMDA-receptor-mediated conductance (rise time constant: 2 ms, decay time constant: 26 ms, at 35°C, Q10 = 3.5) showed voltage-dependent magnesium block (Jahr and Stevens, 1990), with an external magnesium concentration of 0.2 mm. The mGlu2-activated conductance was simulated as a time-independent point-like conductance with a reversal potential of −80 mV, which shows the characteristics of the experimentally observed voltage dependence, namely a moderate (−20%) deviation from the linear relationship at −55 mV and no conductance at positive membrane potentials. Synaptic mechanisms were placed directly onto explicitly modeled dendritic spines. We used two different set of morphological and passive electrophysiological parameters to produce high and low spine neck resistance. For low neck resistance, the passive parameters were set as the parameters of the parent cell. Length and diameter of the spine were 0.75 and 0.18 μm, respectively. In the case of high neck resistance, the passive parameters were as follows: Cm = 1 μF*cm−2, Rm = 20 kΩ*cm2, Ri = 150 Ω*cm. Length and diameter of the spine were 1.9 μm and 0.07 μm, respectively, which produced a neck resistance of ∼500 MΩ (Harnett et al., 2012). In both cases, the spine head had a length and diameter of 0.5 μm. When the shunting conductances were placed on each dendrite at the desired distance from the soma, the total amount of shunting conductance in each cell was set to reproduce the experimentally determined mean reduction of somatically measured input resistance (−28%). When the shunting conductances were placed on single dendrites, the shunting conductance was set at 1 nS. The positions of the inputs and the shunting conductance were measured from the center of the somatic section.
Results
mGlu2 activates GIRK channels in GCs
We observed that low concentrations of mGlu-II agonists induce an outward current in GCs in rat acute slices. In whole-cell patch-clamped GCs, application of DCG IV (1 μm), a specific agonist of mGlu-II, induced a large outward current (46.3 ± 1.5 pA, n = 77; Fig. 1A). The holding current returned to control levels after washout (8 min washout, 0.8 ± 2.3 pA, n = 14), but the effect persisted when application of the agonist was maintained. The somatically recorded outward current was associated with a large decrease in input resistance (Rin, −27.7 ± 2.1%, p = 1.1 × 10⁻¹⁰; Fig. 1A). APDC (50 μm), an mGlu-II agonist structurally unrelated to DCG IV, also induced an outward current and reduced the Rin (36.6 ± 2.3 pA, −23.4 ± 3.2%, n = 12). In addition, LY395756 (5 μm), which acts as an agonist at mGlu2 but inhibits mGlu3 (Dominguez et al., 2005), induced an outward current in GCs similar to that observed with DCG IV (37.8 ± 4.7 pA, −26 ± 3.0% change in Rin; Fig. 1B). The outward current and the reduction in Rin induced by DCG IV were blocked in the presence of the mGlu-II-specific antagonists APICA (500 μm, 3.6 ± 2.3 pA, 0.9 ± 2.8%, n = 7) and LY341495 (0.5 μm, −6.5 ± 3 pA, 1.3 ± 3.7%, n = 12; Fig. 1B). The effect of APICA was reversible, such that application of DCG IV in the same cell after antagonist washout produced an outward current (n = 4; Figure 1D1). Before DCG IV application, the holding current in the presence of antagonists was not significantly different from control cells (control: 63.6 ± 3.1 pA, APICA: 67.3 ± 13.2 pA, p = 0.76, LY341495: 66.9 ± 9.6 pA, p = 0.71), suggesting a lack of constitutive activity of these receptors under our recording conditions. These results confirm that the DCG-IV-activated outward current is indeed mediated by mGlu-II receptors.
Figure 1.

mGlu2-activated outward current in GCs in rat acute slices. A, Average holding current and input resistance of GCs after application of 1 μm DCG IV. Data points indicate values averaged over 5 s and gray bars are the SEM (n = 23). B, Outward currents induced by the mGlu-II agonists DCG IV (1 μm), APDC (50 μm), and LY395756 (5 μm). Other columns show the block of DCG-IV-induced currents in GCs in the presence of the mGlu-II antagonists APICA (500 μm) and LY341495 (0.5 μm), the GIRK channel blocker tertiapin-Q (0.5 μm), and an intracellular solution containing the G-protein inhibitor, GDP-β-S (0.4 mm). C, DCG-IV-induced currents in anatomically identified hippocampal neurons. PC indicates pyramidal cells; PV+BC, parvalbumin-expressing basket cells in the DG; RSBC, regular spiking basket cells in the DG; NGFC, neurogliaform cells in the DG. D1, The mGlu-II specific antagonist APICA blocked the DCG-IV-induced current in GCs. After washout of the antagonist, agonist application resulted in an outward current. D2, Effect of tertiapin-Q on DCG-IV-induced currents during incubation with the toxin (left trace, n = 6 cells) and during subsequent application (right trace, n = 5 cells from separate experiments). D3, DCG IV effects in simultaneously recorded pairs of GCs with normal intracellular solution and with an added G-protein blocker, GDP-β-S. D4, DCG IV effects in simultaneously recorded pairs of GCs and neurogliaform cells. E, Reversal potential of the DCG-IV-induced current in GCs (average current between −100 and −55 mV, n = 8 cells). The gray line indicates the linear fit for the current values between −100 and −80 mV. Dashed line shows the calculated reversal potential for potassium. F, Inward rectification of the DCG-IV-induced current. Black and gray symbols mark the average whole-cell current (n = 3 cells) in control solution and in presence of DCG IV, respectively. The inset trace is the difference current.
We next investigated whether other hippocampal cell types exhibit a comparable outward current in response to mGlu-II activation in rat acute slices. CA1, CA2, CA3 pyramidal cells (−2.3 ± 2.4 pA, n = 10; 0.8 ± 4.4 pA, n = 12; −4 ± 7.2 pA, n = 9), DG parvabumin positive basket cells (1 ± 3.2 pA, n = 7), DG regular-spiking perisomatic interneurons (−2.4 ± 1.9 pA, n = 7), and DG neurogliaform cells (−1.5 ± 2.7 pA, n = 7) showed no significant outward current after application of 1 μm DCG IV (Fig. 1C). To verify that the lack of the DCG IV effect is indeed dependent on the cell type, we recorded GCs simultaneously with the other investigated cell types (n = 13). In all cases, GCs responded with an outward current, whereas the holding current of the simultaneously recorded cells belonging to other cell types was unaffected. Figure 1D4 shows the average of six simultaneous recordings of GC and neurogliaform pairs. In CA3 pyramidal cells, 1 μm DCG IV induced a small inward current, which evolved much more slowly than the outward current in GCs and was mediated by mGlu3 (Ster et al., 2011).
We also investigated the mechanisms that mediate the DCG-IV-induced outward current in GCs. First, we confirmed that the mGlu-II-activated outward current requires G-protein function using the nonhydrolyzable GDP analog GDP-β-S. GDP-β-S (0.4 mm intracellularly, replacing GTP) prevented DCG-IV-induced currents in GCs from rat acute slices (1.7 ± 3.8 pA, n = 7; Fig. 1B,D3). In control recordings (n = 4 pairs), two GCs were recorded simultaneously during DCG IV application, one with a normal intracellular solution and the other with a solution containing GDP-β-S. DCG IV resulted in a significant outward current in control cells recorded with normal intracellular solution (31.5 ± 5.4 pA), whereas the holding current did not change in cells recorded with GDP-β-S (−2.9 ± 7 pA). The measured reversal potential of the DCG-IV-activated outward current (−92.1 ± 2.7 mV, n = 8; Fig. 1E) was not significantly different from the expected equilibrium potential of potassium (−94.3 mV, p = 0.47, Student's t test), suggesting that the current is due to the activation of a potassium conductance. Furthermore, the voltage- dependency of the difference of whole-cell currents in control solution and in presence of 1 μm DCG IV (i.e., DCG-IV-induced current) showed a strong inward rectification (n = 3; Fig. 1F). To determine the identity of the effector potassium channels, we tested for the involvement of GIRK channels, which are commonly associated with G-protein-coupled receptors through Gi/o proteins and show strong inward rectification. Tertiapin-Q (0. 5 μm), a peptide toxin that blocks GIRK channels (Kitamura et al., 2000), strongly attenuated the DCG-IV-induced outward current (9.0 ± 3.4 pA, n = 6; Fig. 1B,D2). In additional experiments, the possible involvement of the cAMP and calcium-signaling pathways was excluded using the adenylyl cyclase activator forskolin (10 μm, 38.4 ± 3.5 pA, n = 6), a high intracellular concentration of the fast calcium chelator BAPTA (10 mm, 47.9 ± 8.5 pA, n = 7), and an extracellular solution that contained low (nominally zero) Ca2+ concentration (31.3 ± 5.9 pA, n = 6). Two blockers of voltage- and calcium-activated potassium channels, 4-amino-pyridine (1–2 mm) and iberiotoxin (0.2 μm), did not prevent the DCG-IV-induced current (27.0 ± 3.6 pA, n = 6; 53.8 ± 4.7 pA, n = 8, respectively, data not shown). These findings allow us to conclude that the most of the mGlu-II agonist-induced outward current in GCs is due to the activation of GIRK channels through G-protein signaling, similar to the response in other types of neurons (Knoflach and Kemp, 1998; Watanabe and Nakanishi, 2003).
To identify the mGlu receptor subtype responsible for the DCG IV response, we used organotypic slices obtained from mice lacking either mGlu2 (Yokoi et al., 1996, Morishima et al., 2005) or mGlu3. First, we established that mGlu2/3 activation had a similar effect in mice organotypic slice preparations as in rat acute slices. DCG IV (2 μm) application induced a large outward current in organotypic slice preparations from wild-type C57BL/6 mice (66.3 ± 7.4 pA, n = 10), white mice (44.2 ± 7.3 pA, n = 5), and rats (49.9 ± 11.5 pA, n = 7; Fig. 2A,B). GCs in acute slices from C57BL/6 mice also showed a similar outward current (39.8 ± 9.6 pA, n = 5), indicating that the DCG IV effect is consistent throughout various species and preparations. The mGlu-II antagonist LY341495 prevented (0.6 ± 0.6 pA, n = 5) and the GIRK channel blocker tertiapin-Q reduced the DCG-IV-activated outward currents (0.5 μm, 20 ± 2 pA, n = 6; Fig. 2C). α-Dendrotoxin, an inhibitor of Kv1.1, 1.2, and 1.6 channels, did not change the DCG-IV-induced current (54.6 ± 14.5 pA, n = 6). The DCG-IV-induced current in GCs from organotypic slices reversed (−91.2 ± 2.2 mV, n = 4; Fig. 2D) at the expected potassium reversal potential under these recording conditions (−88 mV), showed a strong inward rectification, and was abolished when intracellular potassium was replaced with cesium (−4.1 ± 7.8 pA, n = 7). Therefore, we conclude that DCG-IV-induced currents in GCs from rat acute slices and rat and mouse organotypic cultures share the same molecular mechanisms and their main effectors are GIRK channels.
Figure 2.

mGlu2-activated outward current in GCs in organotypic slice cultures. A, Bath application of the mGlu-II-specific agonist DCG IV (2 μm) induced outward currents in GCs from organotypic slices from wild-type and mGlu3−/− mice. This current was not present in GCs from mGlu2−/− mice. B, DCG-IV-induced currents in GCs in organotypic slice cultures of C57BL/6 mice, white mice, rats, and mGlu2- and mGlu3-lacking mice. The lighter column shows the DCG-IV-induced currents in acute slices from C57BL/6 mice. C, The mGlu antagonist LY341495 prevented the outward current in C57BL/6 mice. An NMDA antagonist (APV, 40 μm), a sodium channel blocker (TTX, 1 μm), and a potassium channel blocker (α-DTX, 2 μm) did not affect the DCG-IV-induced current. The GIRK channel blocker tertiapin-Q (0.5 μm) reduced the DCG-IV-induced current. D, Voltage dependence of the DCG-IV-induced current in GCs in organotypic slice cultures (n = 3 cells). The black line indicates the linear fit for the current values between −85 and −65 mV. Dashed line shows the calculated reversal potential for potassium.
We recorded GCs from mice lacking one of the two members of the mGlu-II family, mGlu2 or mGlu3, to reveal their contribution to the agonist-induced outward current. In organotypic slices from mGlu3−/− animals, DCG IV induced an outward current similar to that of wild-type animals (71.0 ± 6.5 pA, n = 5; Fig. 2A,B). In contrast, DCG IV did not induce any significant change in the holding current of GCs in organotypic slices from mGlu2−/− mice (1.8 ± 1.2 pA, n = 5). These findings indicate that the outward current induced by mGlu-II agonists is mediated solely by mGlu2, which is also responsible for the classical presynaptic inhibitory effect on mossy fibers (Yokoi et al., 1996).
Further experiments showed that the mGlu2-activated outward current in GCs is not due to a network effect, because the DCG IV effect remained after the blockade of sodium channels (1 μm TTX, 40.9 ± 3.8 pA, n = 8, rat acute slices, 69.3 ± 11.1 pA, n = 6, organotypic slice), NMDA receptors (40 μm d-APV, 62.4 ± 19.7 pA, n = 5, organotypic slice; Jourdain et al., 2007), and the majority of ionotropic glutamate and GABAA receptors (5 μm SR95531, 20 μm d-APV, and 10 μm CNQX, 50.8 ± 6.1 pA, n = 4 rat acute slices).
Dendritic localization of mGlu2-activated potassium conductance
To address the question of whether the mGlu2-activated potassium conductance originates in the axon, soma, or dendrites of GCs, we obtained recordings from functionally distinct membrane regions in rat acute slices. Direct recording from MFBs, provided they are >500 μm away from the parent soma, measures only axonal membrane currents (Alle and Geiger, 2006). Application of DCG IV did not change significantly the holding current and input resistance of whole-bouton recorded MFBs in the CA3 region (0.3 ± 0.7 pA, p = 0.65, −3.8 ± 2.4%, p = 0.17, n = 6; Fig. 3A,B). In control experiments, DCG IV suppressed axonal calcium currents in MFBs (from −228 ± 49 pA to −160 ± 37 pA, 69.4 ± 3.5%, n = 3, p = 0.04; Fig. 3C), suggesting that the lack of mGlu2-activated outward current in MFBs is not due to the absence of the receptors, but rather is the consequence of the coupling to different molecular machineries at distinct subcellular domains of GCs. Furthermore, in somatically recorded GCs with cut axons (shorter than 50 μm), DCG IV induced a similar outward current (46 ± 5.6 pA, p = 0.001, −37.7 ± 5.5%, p = 0.002, n = 5; Fig. 3B) as the average of all control recordings, supporting the nonaxonal origin of the mGlu2-activated outward current.
Figure 3.

Dendritic origin of the mGlu2-activated outward current. A, Averaged holding currents from whole-cell-recorded GCs, large MFBs in the CA3 region, nucleated patches, and whole-cell-recorded GC dendrites from rat acute slices during DCG IV (1 μm) application. Insets show representative images of the recorded subcellular compartments. Scale bars, 50, 10, and 10 μm. B, The DCG-IV-induced outward current and relative change in input resistance in control GCs, in whole-cell recorded MFBs, in GCs with cut axons (<50 μm), in GC dendrites, and in nucleated patches pulled from GCs. C, Effect of DCG IV on isolated calcium currents recorded from MFBs. Representative traces are shown on the left and the voltage dependence of the absolute and normalized currents on the right. D, The simulated changes in local steady-state input resistance with various shunt locations (soma: black, 80 μm light gray, 120 μm dark gray, 200 μm gray) show the expected changes in local input resistance throughout the entire dendritic arborization of a mulicompartmental GC cell model (Schmidt-Hieber et al., 2007). Symbols show the measured changes in three different subcellular domains (open circles: individual experiments, black circles: averages).
We recorded the effect of mGlu2 activation directly at the dendrites of GCs (in the range of 80–111 μm from the soma). In these recordings, DCG IV (1 μm) induced an outward current (28 ± 2.2 pA, p = 0.001, n = 4; Fig. 3A,B), which was accompanied by a drop in the membrane resistance (−19.4 ± 1.9%, p = 0.002). However, current recordings should be interpreted cautiously when obtained from GC dendrites. Because most GC dendrites converge onto the soma and proximal dendritic stalk, with rare bifurcations in more distal regions (Claiborne et al., 1990), and because the local input impedance of GC dendrites is high, it is possible that conductances from individual dendrites cumulate to result in the largest change at their point of origin at the soma (Gidon and Segev, 2012). Therefore, we investigated how much change in the steady-state input resistance would be expected in dendritic recordings when a shunting conductance (such as the mGlu2-activated potassium conductance) is activated at various locations along the somatodendritic membrane. We used an available GC model with realistic morphology and passive membrane properties (Schmidt-Hieber et al., 2007) and tested four potential scenarios in which shunting conductances were distributed at the soma or at a distance of 80, 120, or 200 μm from the soma on all dendritic branches (mimicking bath application of an agonist). The magnitudes of the activated conductance were set to replicate the average change in input resistance (28%) of our somatic recordings. These simulations showed that the largest changes in local steady-state input resistance were generated at or near the soma regardless of the location of the shunt (Fig. 3D). In the case of a somatically localized shunting conductance, the effect on local input resistance in the dendrites decreased steeply and continuously, whereas distal dendritic shunts resulted in complex shunting profiles along the dendrites, reflecting the branching pattern of the simulated cell. At 100 μm from the soma, the expected changes in local input resistance were smaller than at the soma, even if the shunting conductance was nearby (80 and 120 μm). The dendritically measured DCG IV effect was most consistent with a relatively proximal dendritic origin of the mGlu2-activated potassium conductance in GCs. However, this simulation highlights the fact that dendritic recordings in GCs are not suitable to determine the origin of a shunting conductance within the somatodendritic compartment. Nevertheless, it was possible to exclude a somatic origin of the DCG-IV-activated current by recording from physically isolated nucleated patches of somatic membrane. As in axonal membranes, DCG IV did not induce an outward current or change the input resistance in the somatic membrane (3.4 ± 1.6 pA, p = 0.08, 4.3 ± 3.7%, p = 0.3, n = 6; Fig. 3A,B). These results indicate that the mGlu2-activated outward current originates in the dendritic region of GCs and is absent in axonal and somatic membranes.
To establish the precise localization of mGlu2 receptors in GCs, we used pre-embedding immunoelectron microscopy. Because no highly specific mGlu2 receptor antibodies for immunocytochemistry are available, we analyzed the immunolabeling obtained with mGlu2/3 antibodies in mGlu3-KO, mGlu2-KO, and wild-type mice (Fig. 4A–C). The labeling in mGlu3-lacking and mGlu2-lacking mice showed entirely different localization patterns (Fig. 4A,B). In the hippocampal formation of mGlu3 knock-out (KO) mice, mGlu2 immunoreactivity (IR) was observed in the mossy fibers, CA1 stratum lacunosum moleculare, and the molecular layer of the DG. In the DG, mGlu2-IR was particularly intense in the molecular layer, but not in close proximity to the GC layer (Fig. 4A). In mGlu2-KO mice, intense mGlu3-IR was observed only in the molecular layer of the DG, with no substantial difference between the different layers (Fig. 4B). Weak mGlu3-IR was detected throughout the hippocampal formation, most likely associated with glial cells, as described previously (Tamaru et al., 2001). The immunolabeling pattern for mGlu2 and mGlu3 receptors observed in wild-type animals appeared analogous to the combination of the labeling obtained in the individual KOs (Fig. 4C).
Figure 4.

Localization of mGlu2 receptors in the DG. A, Immunoreactivity for the mGlu2 receptor in the DG of a mGlu3-KO mouse. The immunolabeling is particularly intense in the molecular layer at ∼30 μm from the border of the GC layer and it decrements toward the outer layer. ML indicates molecular layer of the DG; LM, stratum lacunosum moleculare of CA1 region. B, Immunoreactivity for the mGlu3 receptor in the DG of an mGlu2-KO mouse. The staining appears homogeneous throughout the molecular layer. C, Immunoreactivity for mGlu2 and mGlu3 in the DG of a wild-type mouse. D, Left, Immunofluorescence labeling for the mGlu2 receptor in the hippocampal formation of an mGlu3-KO mouse. Middle, Surface plot traces of the immunofluorescence signal (relative optical density, R.O.D.) across the DG (sampled as shown by the blue bar in the left panel) obtained from different mGlu2-KO animals (n = 4). The distance was normalized between the borders of the hilus and the GC layer (0) and the DG molecular layer and CA1 (1). Right, Averaged R.O.D. distribution of mGlu2 immunoreactivity. E–F, Subcellular distribution of mGlu2 (i.e., in mGlu3-KO mice) in GC dendrites. Immunoreactivity for mGlu2, visible as an electron opaque peroxidase end product (arrows), can generally be detected at some distance from the cell body in the proximal portion of GC dendrites, whereas somata are mostly devoid of labeling. G, Immunoperoxidase end product for mGlu2 can be seen unevenly distributed at and near the plasma membrane of GC dendrites in the inner molecular layer (arrows). H, Immunometal particles marking mGlu2 receptors (arrows) in presynaptic terminals of putative entorhinal cortex axons were mostly observed outside the active zone. I, Similar to the immunoperoxidase end product, immunometal particles for mGlu2 were observed unevenly distributed at and near the plasma membrane of GC dendrites in the inner molecular layer (arrows). J, Labeling for mGlu2 was also sporadically detected in association with GC dendritic spines.
At the ultrastructural level, mGlu2-IR was found generally associated with dendrites of GCs, whereas somata were mostly devoid of labeling (Fig. 4E–G,I,J). The labeling on dendritic membranes was irregular or in patches, suggesting a nonhomogeneous distribution along the dendrites unrelated to synaptic specializations. As reported previously, the mGlu2 signal was also found in axons within the molecular layer of the DG (Petralia et al., 1996) probably originating from the entorhinal cortex (Fig. 4H). Therefore, these data clearly confirm that mGlu2 is expressed in the dendrites of GCs, in addition to its axonal expression in mossy fibers and perforant path axons.
To examine the relative degree of mGlu2 labeling within distinct layers of the DG, we measured the intensity of mGlu2 signals in mGlu3-KO samples. Surface plot analysis of the intensity of mGlu2-IR in the DG showed that the most intense mGlu2 labeling was present in the inner molecular layer (Fig. 4D), which may correspond primarily to dendritic mGlu2 in GCs (Fig. 4G), whereas the labeling in the outer molecular layer probably reflects in large part presynaptic mGlu2 receptors in perforant path axons. However, it is unfeasible by pre-embedding electron microscopy to differentiate quantitatively between the presynaptic and postsynaptic components. These results demonstrate a dendritic localization of mGlu2 receptors and suggest an inhomogeneous distribution along the dendrites with preferential accumulation in the inner molecular layer.
mGlu2-activated potassium conductance is restricted to a short proximal dendritic segment in GCs
To test the prediction that the mGlu2-activated potassium conductance is localized in a restricted dendritic region and to determine this location more precisely, we took advantage of the large change in the input resistance caused by mGlu2 agonist application in GCs. We hypothesized that a spatially restricted shunt on the dendrite should have a different profile than shunts that are more homogeneously distributed along the dendrites when monitoring the inhibition of transient dendritic voltage responses in the soma. That is, if the shunt is spatially restricted, the peak amplitude of responses that originate distal to the shunt should be affected similarly because these events are shunted uniformly during their propagation toward the soma. In contrast, if the shunt is distributed on long dendritic segments, shunting efficacy should increase steadily in the distal direction along the dendrites.
To test this hypothesis experimentally, we induced mGlu2-mediated shunting of transient membrane depolarizations evoked by uncaging glutamate (with MNI glutamate) at specific dendritic loci in whole-cell-recorded GCs using confocal microscopy. We analyzed the somatic voltage responses with and without DCG IV and, after these recordings, we measured the distance of the uncaging spots from the soma to draw the shunting profile of DCG IV (n = 35 cells, n = 57 locations, in presence of the NMDA blocker d-APV; Fig. 5A). Our results show that the inhibition of the peak amplitude of uncaging-evoked responses by mGlu2 activation was relatively small in the proximal 90 μm of the dendrite (−6.9 ± 1.0%), but was 2.5× more effective in the distal region (−17 ± 1.2%, beyond 125 μm; Fig. 5B,C). There was a sharp transition between minimal shunting of proximal responses and strong shunting of more distal events at distances between 90 and 125 μm, which corresponds approximately to a region in the distal portion of the first third of the dendritic length (average dendritic length: 304.9 ± 8.7 μm). Most importantly, we did not see a further increase in the efficacy of the shunting at more distal dendritic sites, suggesting that the mGlu2-activated potassium conductance is located within 125 μm from the soma of the recorded cells. The shunting of the evoked events did not depend on their control amplitudes, suggesting that the inhibition is not due to interference with nonlinear dendritic processes under these experimental circumstances (Fig. 5B, right). We also monitored the DCG IV effect on the half-width and integrated area of the evoked responses (Fig. 5D), which are predominantly determined by global membrane parameters such as the membrane time constant. As a consequence, changes of these two parameters are not expected to show a strong correlation with location and reflect the total amount of conductance activated by the agonist. Therefore, normalization of the peak effect to the effects on the area of the events reduced the variability between individual recordings introduced by the different levels of global conductance activated by the bath-applied agonist (Fig. 5E). This normalized shunting profile also showed clear characteristics: (1) an ∼2.5-fold difference in shunting efficacy between the proximal one-third and the distal two-thirds of the dendrites, (2) a sharp increase in efficacy at 90–125 μm, and (3) uniform inhibition of the distal two-thirds of the dendrites.
Figure 5.
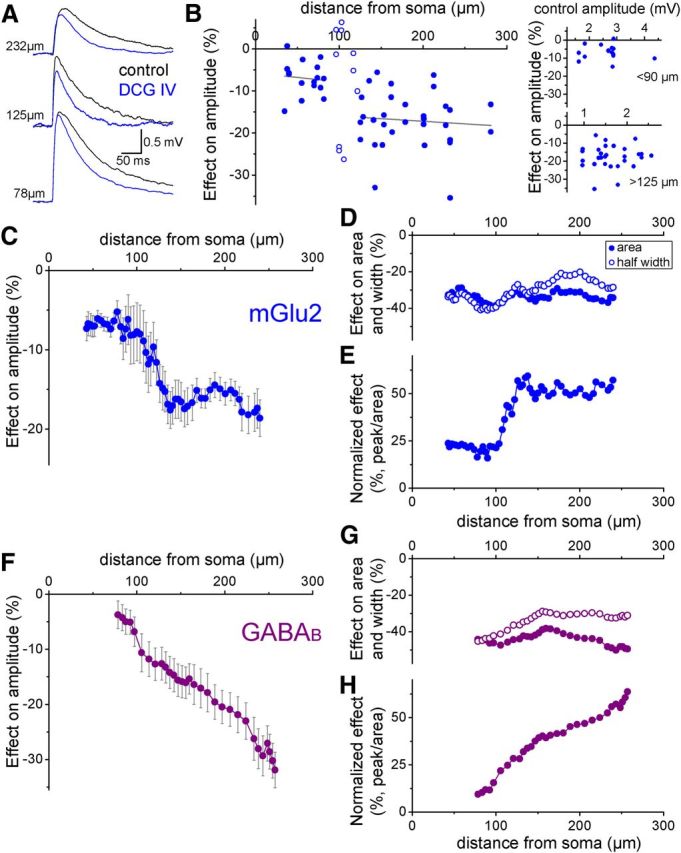
Shunting profiles of agonist-activated dendritic potassium conductances on dendritic events. A, Representative events evoked by MNI glutamate uncaging in control conditions (black) and in the presence of DCG IV (blue) from three different somatically recorded cells. B, Inhibition of glutamate-evoked dendritic events by DCG IV. Note that the amount of inhibition did not show a tendency of change for those events that originated >125 μm from soma. The right panel shows that the shunting effect did not depend on the control amplitudes of the evoked events. C, Average shunting profile of DCG IV on the somatically measured peak amplitude of glutamate-evoked events. The data are presented as a moving average in which both distance (x-axis) and the effect (y-axis) are averaged from 11 neighboring measurements. D, The DCG IV effect on integrated area (filled symbols) and half-width (open symbols) of the events. E, DCG IV effect on peak amplitude after normalization to the effect on the integrated area of the events within individual experiments. F, Average shunting profile of the GABAB agonist SKF97541 on the peak amplitude of glutamate-evoked events. G, SKF97541 effect on integrated area (filled symbols) and half-width (open symbols) of the events. H, SKF97541 effect on peak amplitude after normalization to the effect on the integrated area of the events within individual experiments.
Reduction of GIRK channel activation by coapplication of tertiapin-Q with DCG IV (remaining change in Rin: −4.1 ± 2.5%) prevented significant changes in the evoked responses (peak: −2.8 ± 1.4%, area: −3.1 ± 1%, n = 6, at locations 97–158 μm from soma), indicating that the shunting effect by DCG IV was dependent on GIRK channel activation. Because of the presence of mGlu-II receptors on perforant path axons, synaptically evoked EPSPs could not be used for the shunting profile measurements (Macek et al., 1996). As a positive control experiment, we tested the effect of GABAB receptor activation. Even though these receptors target the same postsynaptic effector mechanisms as mGlu2, namely GIRK channels (Andrade et al., 1986), GABAB receptors are distributed over large segments of the distal dendritic region of GCs (Kulik et al., 2003). Therefore, we expected a different shunting profile of dendritic events upon activation of GABAB receptors. In contrast to mGlu2 activation, the inhibitory effect of GABAB receptor activation by the agonist SKF97541 on the peak amplitude of the glutamate-evoked responses increased continuously in the distal direction along the dendrites without plateauing (Fig. 5F). The effect on integrated area and half-width varied little with dendritic distance (Fig. 5G), but the continuous increase was also evident in the normalized shunting profile of GABAB activation (Fig. 5H). Therefore, the results of the control experiments with GABAB receptor activation correspond to the expected shunting profile from the known location of these receptors, further validating the approach that we used for the localization of the shunt activated in the dendrites of GCs.
To corroborate the results gained from the uncaging experiments, we used multicompartmental modeling using available biophysically realistic GC models (Schmidt-Hieber et al., 2007; our modeling experiments were performed on cells 3, 4, and 7 described in that study). First, we set the AMPA conductance kinetics to replicate the amplitude and kinetics of the responses evoked in our uncaging experiments (rise time: 0.388 ms, decay time constant: 3.95 ms; Fig. 6A,B). AMPAR-mediated conductances (peak: 1 nS) were placed at different dendritic locations (0, 25, 40, 70, 90, 105, 125, 150, 175, 195, 220, 240, and 260 μm) along 4 dendrites in each cell and were activated individually. Some of the dendrites of the GCs in the model were shorter than these lengths. In these cases, simulated AMPA events were tested at fewer locations. An important difference between the cells used in our uncaging experiments and in these simulations was the average length of the dendrites (305 μm vs 232 μm, respectively). We used these configurations to explore the location dependency of input shunting by spatially restricted conductances located on the soma or on the dendrites at 20, 50, 80, 120, 160, and 200 μm from the soma (Fig. 6A). The shunting conductance was placed on every dendrite at the desired distance from the soma and was provided with inward rectification based on our experimental data. The magnitude of the shunting conductance (i.e., mGlu2-activated potassium conductance) in the seven scenarios was set to replicate the mean change of the somatically measured input resistance in our previous recordings (−28%). We analyzed the somatically measured peak amplitude, the integrated area, and the half-width of the simulated AMPAR-mediated conductances similarly to our recordings of uncaging evoked responses.
Figure 6.
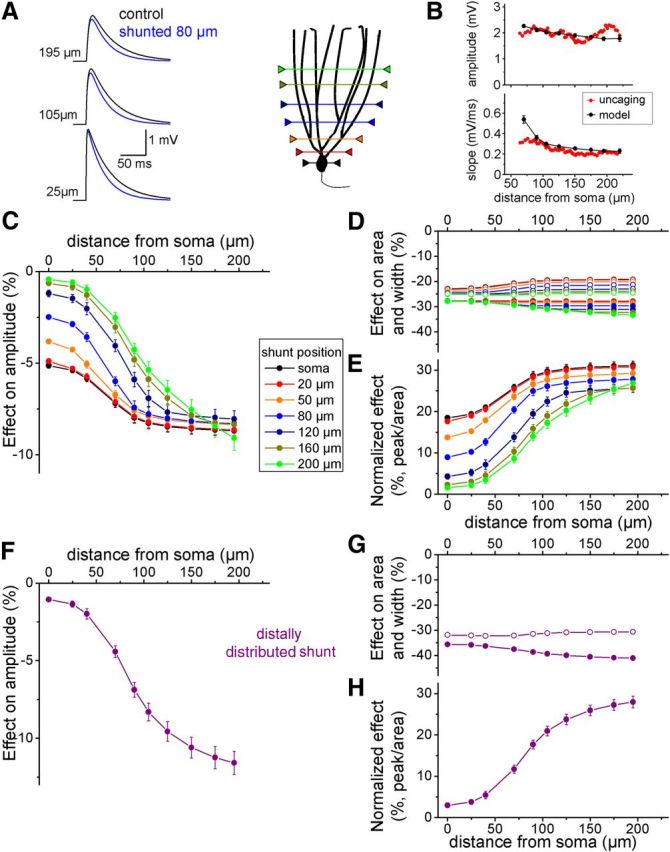
Shunting profiles of dendritic conductances on simulated dendritic events. A, Simulated somatic voltage responses at three different dendritic locations (25, 125, and 195 μm) in a multicompartmental model of a GC in control conditions (black) and during activation of a shunting conductance at 80 μm from the soma (blue traces). B, Comparison of the peak amplitude and slope of the rising phase of events evoked by glutamate uncaging (red) and simulation (black). C, Average shunting profiles of 7 differently localized, spatially restricted shunting conductances on the somatic peak amplitude of simulated events (n = 3 cells, 4 dendrites each). The x-axis indicates the location of the simulated synapses. D, Effect of the differently localized shunts on integrated area (filled symbols) and half-width (open symbols) of the events. E, Shunting effects on peak amplitude after normalization to the effect on the integrated area. F, Average shunting profile of a distally distributed shunting conductance (simulating GABAB distribution) on the somatic peak amplitude of simulated events. G, Effect of the distributed shunt on integrated area (filled symbols) and half-width (open symbols) of the events. H, Shunting effect on peak amplitude after normalization to the effect on the integrated area.
As expected, the difference in shunting effectiveness on the peak amplitudes of proximal and distal simulated AMPA events was the smallest when the shunt was located at the soma (Fig. 6C, black symbols). In the case of distal shunts, inhibition of proximal AMPA events was small, whereas distal responses were shunted with similar efficacy as was the case for the somatic shunt. When the shunt was placed close to the proximal third of the total length of the dendrites (80 μm from the soma), there was a large, ∼2.7-fold increase in shunting inhibition of the peaks for proximal (<70 μm) versus distal (>90 μm) simulated AMPA events. Moreover, for both proximal and somatic shunting, the inhibition of simulated responses originating from distal dendritic regions (>105 μm) was not further enhanced, resulting in uniform inhibition of these events. In contrast to the effects on peak amplitudes, only minor differences in the integrated area and half-width were observed for these different configurations (Fig. 6D,E), which was as expected because this parameter reflects global effects on the membrane parameters. Therefore, for a proximal conductance in the first third of the dendrites, the model predicts a sharp increase in the shunting efficacy of the peak of transient responses, resulting in a uniform effect on the distal two-thirds of the dendrites. We simulated the shunting profile of a conductance that mimics the GABAB-activated potassium conductance. In this simulation, the shunts were placed on each dendrite every 20 μm beginning at 100 μm until their end. The simulated shunting profile matched that of the recorded GABAB-receptor-mediated effect on uncaging evoked events (compare Fig. 6F–H with Fig. 5F–H).
From the dendritic shunting profiles of mGlu2 activation in the uncaging and simulation experiments (taking into consideration the difference between the length of the dendrites of the simulated and recorded cells), we can conclude that the mGlu2-activated potassium conductance is restricted to small regions in the distal portion of the proximal one-third of the dendrites.
Proximal and spatially restricted localization of the mGlu2-activated potassium conductance enables effective shunting of individual branches
What are the potential functional consequences of spatially restricted proximal dendritic shunting in GCs? Our experiments suggest that mGlu2-activated potassium conductance is confined to a restricted region on the proximal dendrites, which results in uniform inhibition of the major excitatory drive to GCs arriving from the entorhinal cortex to the distal two-thirds of the dendrites. The uniformity of inhibition within individual dendritic branches is a crucial prerequisite for the branch-specific modulation of GCs, along with the ability to modulate individual branches selectively (i.e., the modulation has to be more effective in the modulated branch compared with nonmodulated branches). Branch-specific modulation of GCs has been proposed as a potential underlying mechanism for crucial GC functions such as dynamic multiple place fields (Hayman and Jeffery, 2008; Ujfalussy et al., 2009). However, several key circumstances are different under physiological conditions compared with our previous experiments. For example, it is unlikely that mGlu2 receptors are activated to a similar degree in all dendrites (as is the case during bath application of an agonist) and it is more plausible under physiological conditions that these receptors are activated differentially on individual dendrites at any given time. Therefore, to explore whether the strategic localization of the mGlu2-activated potassium conductance promotes uniform and selective modulation of individual dendritic branches of GCs, we again implemented the multicompartmental model to examine the consequences of shunting conductances occurring only on a single dendritic branch under various physiological conditions (Fig. 7A–C). In these single dendrite analyses, we applied equal amounts of shunting conductance at every tested location (1 nS) and measured the shunting efficacy in four dendritic branches from each cell (one that contained the shunting conductance and three neighboring dendrites without the shunt).
Figure 7.
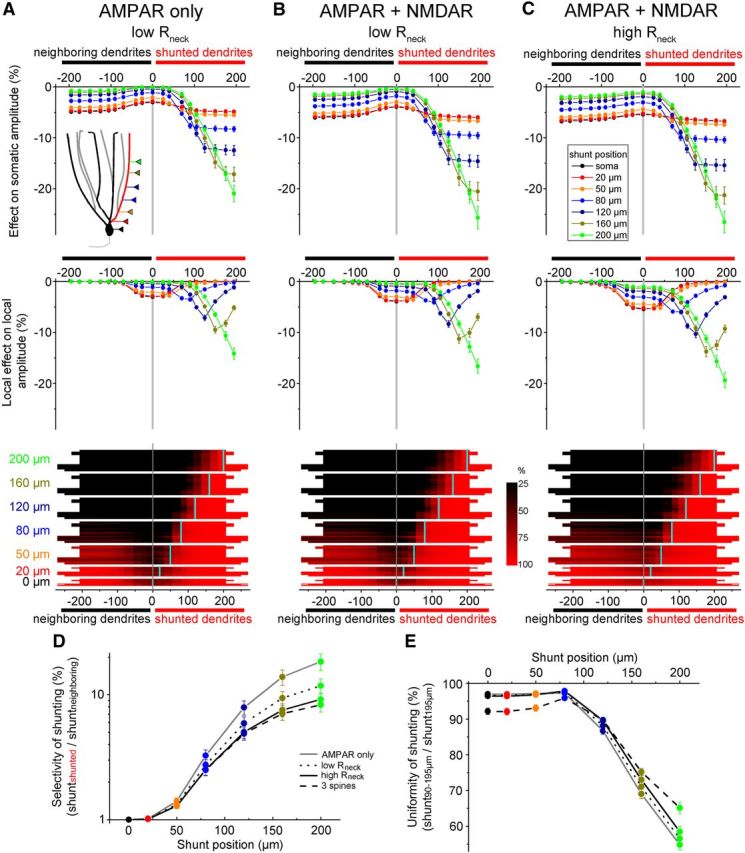
Shunting of individual dendritic branches by spatially restricted dendritic conductances. A, Top, Average effect of shunting of the somatic peak amplitude of simulated AMPAR-mediated EPSPs originating from single shunted dendrites (positive x-axis values) or from neighboring dendrites (negative x-axis values). Middle, Same as above for the local peak amplitude of the EPSPs. Bottom, Effect on individual dendritic branches depending on the location of the shunt. Each horizontal line within a block represents the same dendritic branch with the shunt (positive x-axis values) and the same dendrite with the shunt located on one of the neighboring dendrites (negative x-axis values). The inhibitory efficacy on the peak amplitude was normalized to the shunting level of EPSPs at 195 μm on the shunted branch. The red color thus indicates a strong shunting effect, whereas the least inhibited regions are shown in black. B, Same as in A for compound EPSPs mediated by AMPA and NMDA conductances. C, Same as in A for compound EPSPs mediated by AMPA and NMDA conductances in spines with a 500 MΩ neck resistance. D, Selectivity of the inhibition of individual branches calculated as the ratio of shunting in the dendrites (90–195 μm) with the conductance compared with without the conductance. Each shunt location is color coded as in the previous panels. The various simulation conditions are indicated by the connected lines. E, Uniformity of the shunting within individual dendritic branches calculated as the proportion of the shunting of the EPSPs at 90–125 μm relative to the shunting of EPSPs at 195 μm. A higher percentage in this ratio thus indicates more uniform shunting along the dendrites.
First, we adjusted the settings of the previous simulation to include physiologically relevant temperature and AMPA conductance kinetics (rise time: 0.27 ms, decay time constant: 2.75 ms; Figure 7A). To quantify the branch selectivity of the shunting in the various scenarios, we calculated the ratio of the shunting efficacy of simulated EPSPs (90–195 μm) between shunted and neighboring branches for each dendrite. Therefore, a high value in this ratio indicates strong selectivity and when individual branches are shunted equally (i.e., for a somatic shunt) the value is 1 (Fig. 7D). As expected, the most distal shunting location yielded the highest selectivity ratio. However, the results show that even the relatively proximal shunt (80 μm) was able to shunt dendrites with a 3.26 ± 0.36-fold selectivity ratio. To quantify the uniformity of the inhibition within individual shunted dendrites, we compared the average inhibition of simulated EPSPs originating between 90 and 195 μm with the inhibition of EPSPs at 195 μm (Fig. 7E). This index for the 80 μm shunt was similar (97.3 ± 0.2%) to that of somatic shunts (97 ± 0.3%). Examination of the shunting effects on the local EPSP amplitudes revealed that the local effects were always smaller than the somatically measured loss of the peak amplitude of the corresponding events (compare the similarly color-coded plots in the top and middle panels of Fig. 7A–C). Furthermore, the local effect decreases distally to the shunt toward the end of dendrites (Gidon and Segev, 2012). Therefore, these findings suggest that the somatically detected inhibition was mostly due to reduction of the potential during passive propagation to the soma rather than to the shunting effect on the synaptic inputs. EPSPs with both AMPA and NMDA conductances are expected to react differently than pure AMPA EPSPs to a shunt because of the slower kinetics of the compound response. Therefore, in the second set of simulations, we added an NMDA conductance (maximum available peak conductance: 1 nS) to the spines (Fig. 7B). As expected, the selectivity ratio of the shunting of neighboring dendrites decreased. However, this decrease was small and the inhibition remained relatively selective (2.74 ± 0.3) when the shunt was placed at 80 μm from the soma. The uniformity index remained high for this shunt location (97.5 ± 0.3%). These GC models are equipped with spines based on morphological data, which are assumed to have similar properties (including axial resistance) as the dendritic shafts. Therefore, it is likely that simulated spines have a lower neck resistance than physiological spines, resulting in smaller depolarizations within the spine heads and consequently fewer NMDA channel openings (Grunditz et al., 2008). However, a recent study measured the neck resistance of the spines of CA1 pyramidal cells directly (Harnett et al., 2012). Therefore, in a third series of simulations, we changed the spine morphology to match the neck resistance (500 MΩ) measured in CA1 pyramidal cells (Fig. 7C). GC spines have shorter necks than CA1 pyramidal cells (Harris and Stevens, 1989; Trommald and Hulleberg, 1997) and, therefore, neck resistance in GCs is likely <500 MΩ. Nevertheless, even in this high neck resistance case for shunt positions at 80 μm, inhibition was uniform within the dendrites (97.9 ± 0.3%) and remained relative selective for individual branches (2.51 ± 0.24). Finally, we simulated three AMPA and NMDA compound synapses that were located in close proximity to each other (within 10 μm) and were activated simultaneously. In this case, the 80 μm shunt resulted in the highest relative uniformity value, whereas the selectivity ratio was 2.5 ± 0.25. Note that the above analysis included dendrites (n = 4 of the 12; Fig. 7A–C) that originated from the same primary dendrite. This condition clearly impedes selective inhibition of individual branches. Excluding these dendrite pairs from the analysis further increased the selectivity ratio in all four tested scenarios (by 15.1%, 12.9%, 8.8% and 9.7%, respectively, for 80 μm shunt position).
These simulations suggest that the predicted location of the mGlu2-activated potassium conductance in the distal portion of the proximal third of the dendrite (which corresponds to 80–100 μm from the soma in the cells used in the simulations) is ideally positioned under various conditions to meet two major requirements for branch-specific modulation of GC dendrites: uniform yet selective inhibition of individual dendrites.
Discussion
Our study reveals a novel inhibitory mechanism for mGlu2 in GCs mediated by a G-protein-dependent activation of a potassium conductance. The other member of the mGlu-IIs, mGlu3, is not involved in this GC-specific response. The restricted localization in the proximal dendrites of GCs allows the mGlu2-activated potassium conductance to exert a complex modulation on incoming signals. This proximal shunt is as efficient as somatic inhibition (Koch et al., 1983, Miles et al., 1996) in reducing synaptic inputs from entorhinal cortex that arrive in the distal dendrites. Furthermore, the mGlu2-activated shunt results in uniform inhibition of inputs on the distal two-thirds of the dendrites of GCs, imposing similar inhibition on all inputs within an individual dendritic branch. The second important feature of the mGlu2-activated shunt is that, in contrast to somatic shunting, it is less effective on inputs to the perisomatic region. As a consequence of this strategic localization, mGlu2 activation in a single dendrite leaves the inputs to neighboring dendrites relatively unaffected. Therefore, dendrite-specific inhibition mediated by mGlu2 enhances the ability of individual dendrites to operate as independent units, a mechanism that would not be possible with other locations of the shunt. If the dendritic conductance were closer than the transition between the proximal and middle third of the dendrites (which corresponds to ∼100–130 μm from the soma in the recorded shunting profile in rat GCs and 75–100 μm in the mouse simulation and anatomy data), then neighboring dendrites would be modulated similarly to the shunted dendrites. Conversely, if the site of modulation were more distal, the amount of inhibition of individual inputs would not be uniform within the distal two-thirds of the dendrites, the termination zone of two major excitatory drives from the medial and the lateral entorhinal cortex. This branch-specific modulation relies on a ligand-activated mechanism that allows the dynamic (within tens of milliseconds) regulation of somatically integrated synaptic inputs arriving from individual dendrites.
The dendritic tree of GCs consists of several equivalent dendrites that emanate from a few short major dendrites close to the soma (Claiborne et al., 1990). This distinctive branching pattern appears to be ideal for assigning independent computational competence to individual dendritic segments, an arrangement that may underlie several key functions of GCs, including their ability to code unique multiple and irregular place fields and for the disambiguation of overlapping representations (Rolls and Kesner, 2006; Leutgeb et al., 2007; Hayman and Jeffery, 2008; Ujfalussy et al., 2009). However, in contrast to pyramidal cells (Hoffman et al., 1997, Magee, 1998), the local input impedance of the dendrites of GCs is high due to the low density of active conductances (Krueppel et al., 2011, Schmidt-Hieber et al., 2007). This characteristic of GCs tends to counteract the biophysical isolation of their dendrites. The strategically positioned mGlu2-mediated dendritic inhibition can to some degree overcome this limitation because it enables selective modulation of individual dendritic branches of GCs. Therefore, the differential compartmental weighting of individual dendritic branches by the mGlu2-activated potassium conductance can precisely modulate the integration of a select group of synaptic inputs from the entorhinal cortex. The optimal location for a shunting conductance to exert both uniform and selective modulation on individual dendritic branches is strongly cell-type specific. In addition to the diverse dendritic branching patterns of various neuronal types, the biophysical properties of the dendrites also play a crucial role in shaping the integration. In hippocampal pyramidal cells, which play distinct functions in hippocampal information processing (Rolls and Kesner, 2006; Leutgeb et al., 2007), the increasing dendritic conductance compensates for the high local input impedance of the terminal branches (Hoffman et al., 1997, Magee, 1998).
In contrast to ionotropic receptors or voltage-gated channels, the function of metabotropic receptors requires dynamic interactions between at least three molecular components: receptors, heterotrimeric G-proteins, and their effectors. Interpretation of metabotropic responses is complicated by the diversity of downstream effectors that are potentially modulated by the activation of other receptors. Therefore, we have adopted a functional mapping approach that localizes directly the physiological consequences of activation of G-protein-coupled receptors in dendrites by measuring the effects of the mGlu2-activated shunting conductance on the generation and propagation of transient dendritic events. The predicted location of the highest mGlu2 density from the shunting experiments and from the anatomical studies cannot be compared directly because the former approach considers the dendritic length whereas the latter measures the locations relative to the layers. However, the outcomes of the two approaches are highly consistent when the basic morphological features of the DG and GCs are considered. First, GCs are not organized into a single cell layer, but ∼5–15 cell bodies are packed one on top of each other to form the stratum granulosum. Therefore, the cells deeper in the layer have longer proximal dendritic segments. Second, there is a relatively wide emerging angle of individual dendrites within the dendritic tree of GCs. Therefore, the branches in the middle of the tree are shorter than those that are at the edge of the arborization. Third, in contrast to the almost linear distal dendritic segments, the proximal dendrites are more often curved and bifurcated. Therefore, the relative length of the dendritic segments within the first third of the stratum moleculare is longer than that of the more distal ones.
The restricted expression of the mGlu2-activated potassium conductance to the proximal dendrites of GCs is likely to have a number of additional physiological consequences. The spatially distinct localization of mGlu2 on proximal GC dendrites versus mGlu2 on the terminals of perforant path axons arriving on the distal GC dendrites allows nonoverlapping activation of these two receptor populations by different sources of glutamate, which may be essential for the differential modulation of GC functions. At present, however, the origin of the glutamate that activates mGlu2 on the proximal dendrites remains unclear. Candidate sources for glutamate include fibers from the supramammillary nucleus (Maglóczky et al., 1994), hilar mossy cells (Buckmaster et al., 1996), stellate cells from layer II of the medial entorhinal cortex (Steward, 1976), cells in the deep layers of the entorhinal cortex (Deller et al., 1996), and astrocytes (Jourdain et al., 2007).
In light of recent clinical studies showing an alleviation of the positive symptoms of schizophrenia following treatment with agonists or positive allosteric modulators of mGlu-IIs (Conn and Jones, 2009, Patil et al., 2007), much interest has developed about the functional consequences of mGlu2 activation. Our results indicate that, in addition to the known presynaptic effects of mGlu2, postsynaptic dendritic effects that can modify the integration of neuronal input and alter local network behaviors must be considered for a comprehensive assessment of drugs acting on these receptors.
Footnotes
This work was funded by the Wellcome Trust (International Senior Research Fellowship #087497 to J.S.), the Hungarian Academy of Sciences (Lendület Iinitiative #LP-2009–009 to J.S.), Gedeon Richter (to J.S.), and the Swiss National Science Foundation (to U.G.). We thank the Nikon Microscopy Center at IEM, Nikon Austria GmbH, Auro-Science Consulting Ltd, and László Barna for kindly providing microscopy support, Norbert Hájos, Roland Krueppel, Andrea Lörincz, and Zoltán Nusser for valuable comments on an earlier version of the manuscript, Szabolcs Káli for his help with the Neuron 7.2 simulation environment, Dóra Hegedús, Andrea Juszel, D. Göckeritz-Dujmovic, S. Giger, and H Kasper for technical assistance, and Shigetada Nakanishi for permission to use the mGlu2−/− mice.
References
- Alle H, Geiger JR. Combined analog and action potential coding in hippocampal mossy fibers. Science. 2006;311:1290–1293. doi: 10.1126/science.1119055. [DOI] [PubMed] [Google Scholar]
- Andrade R, Malenka RC, Nicoll RA. A G protein couples serotonin and GABAB receptors to the same channels in hippocampus. Science. 1986;234:1261–1265. doi: 10.1126/science.2430334. [DOI] [PubMed] [Google Scholar]
- Buckmaster PS, Wenzel HJ, Kunkel DD, Schwartzkroin PA. Axon arbors and synaptic connections of hippocampal mossy cells in the rat in vivo. J Comp Neurol. 1996;366:271–292. doi: 10.1002/(sici)1096-9861(19960304)366:2<270::aid-cne7>3.0.co;2-2. [DOI] [PubMed] [Google Scholar]
- Claiborne BJ, Amaral DG, Cowan WM. Quantitative, three-dimensional analysis of granule cell dendrites in the rat dentate gyrus. J Comp Neurol. 1990;302:206–219. doi: 10.1002/cne.903020203. [DOI] [PubMed] [Google Scholar]
- Conn PJ, Jones CK. Promise of mGluR2/3 activators in psychiatry. Neuropsychopharmacology. 2009;34:248–249. doi: 10.1038/npp.2008.156. [DOI] [PMC free article] [PubMed] [Google Scholar]
- Deller T, Martinez A, Nitsch R, Frotscher M. A novel entorhinal projection to the rat dentate gyrus: direct innervation of proximal dendrites and cell bodies of granule cells and GABAergic neurons. J Neurosci. 1996;16:3322–3333. doi: 10.1523/JNEUROSCI.16-10-03322.1996. [DOI] [PMC free article] [PubMed] [Google Scholar]
- Dominguez C, Prieto L, Valli MJ, Massey SM, Bures M, Wright RA, Johnson BG, Andis SL, Kingston A, Schoepp DD, Monn JA. Methyl substitution of 2-aminobicyclo[3.1.0]hexane 2,6-dicarboxylate (LY354740) determines functional activity at metabotropic glutamate receptors: identification of a subtype selective mGlu2 receptor agonist. J Med Chem. 2005;48:3605–3612. doi: 10.1021/jm040222y. [DOI] [PubMed] [Google Scholar]
- Gähwiler BH. Organotypic monolayer cultures of nervous tissue. J Neurosci Methods. 1981;4:329–342. doi: 10.1016/0165-0270(81)90003-0. [DOI] [PubMed] [Google Scholar]
- Gidon A, Segev I. Principles governing the operation of synaptic inhibition in dendrites. Neuron. 2012;75:330–341. doi: 10.1016/j.neuron.2012.05.015. [DOI] [PubMed] [Google Scholar]
- Grunditz A, Holbro N, Tian L, Zuo Y, Oertner TG. Spine neck plasticity controls postsynaptic calcium signals through electrical compartmentalization. J Neurosci. 2008;28:13457–13466. doi: 10.1523/JNEUROSCI.2702-08.2008. [DOI] [PMC free article] [PubMed] [Google Scholar]
- Harnett MT, Makara JK, Spruston N, Kath WL, Magee JC. Synaptic amplification by dendritic spines enhances input cooperativity. Nature. 2012;491:599–602. doi: 10.1038/nature11554. [DOI] [PMC free article] [PubMed] [Google Scholar]
- Harris KM, Stevens JK. Dendritic spines of CA 1 pyramidal cells in the rat hippocampus: serial electron microscopy with reference to their biophysical characteristics. J Neurosci. 1989;9:2982–2997. doi: 10.1523/JNEUROSCI.09-08-02982.1989. [DOI] [PMC free article] [PubMed] [Google Scholar]
- Hayman RM, Jeffery KJ. How heterogeneous place cell responding arises from homogeneous grids–a contextual gating hypothesis. Hippocampus. 2008;18:1301–1313. doi: 10.1002/hipo.20513. [DOI] [PubMed] [Google Scholar]
- Hines ML, Carnevale NT. The NEURON simulation environment. Neural Comput. 1997;9:1179–1209. doi: 10.1162/neco.1997.9.6.1179. [DOI] [PubMed] [Google Scholar]
- Hines ML, Carnevale NT. NEURON: a tool for neuroscientists. Neuroscientist. 2001;7:123–135. doi: 10.1177/107385840100700207. [DOI] [PubMed] [Google Scholar]
- Hoffman DA, Magee JC, Colbert CM, Johnston D. K+ channel regulation of signal propagation in dendrites of hippocampal pyramidal neurons. Nature. 1997;387:869–875. doi: 10.1038/43119. [DOI] [PubMed] [Google Scholar]
- Jahr CE, Stevens CF. Voltage dependence of NMDA-activated macroscopic conductances predicted by single-channel kinetics. J Neurosci. 1990;10:3178–3182. doi: 10.1523/JNEUROSCI.10-09-03178.1990. [DOI] [PMC free article] [PubMed] [Google Scholar]
- Jourdain P, Bergersen LH, Bhaukaurally K, Bezzi P, Santello M, Domercq M, Matute C, Tonello F, Gundersen V, Volterra A. Glutamate exocytosis from astrocytes controls synaptic strength. Nat Neurosci. 2007;10:331–339. doi: 10.1038/nn1849. [DOI] [PubMed] [Google Scholar]
- Kamiya H, Ozawa S. Dual mechanism for presynaptic modulation by axonal metabotropic glutamate receptor at the mouse mossy fibre-CA3 synapse. J Physiol. 1999;518:497–506. doi: 10.1111/j.1469-7793.1999.0497p.x. [DOI] [PMC free article] [PubMed] [Google Scholar]
- Kamiya H, Shinozaki H, Yamamoto C. Activation of metabotropic glutamate receptor type 2/3 suppresses transmission at rat hippocampal mossy fibre synapses. J Physiol. 1996;493:447–455. doi: 10.1113/jphysiol.1996.sp021395. [DOI] [PMC free article] [PubMed] [Google Scholar]
- Kitamura H, Yokoyama M, Akita H, Matsushita K, Kurachi Y, Yamada M. Tertiapin potently and selectively blocks muscarinic K(+) channels in rabbit cardiac myocytes. J Pharmacol Exp Ther. 2000;293:196–205. [PubMed] [Google Scholar]
- Knoflach F, Kemp JA. Metabotropic glutamate group II receptors activate a G protein-coupled inwardly rectifying K+ current in neurons of the rat cerebellum. J Physiol. 1998;509:347–354. doi: 10.1111/j.1469-7793.1998.347bn.x. [DOI] [PMC free article] [PubMed] [Google Scholar]
- Koch C, Poggio T, Torre V. Nonlinear interactions in a dendritic tree: localization, timing, and role in information processing. Proc Natl Acad Sci U S A. 1983;80:2799–2802. doi: 10.1073/pnas.80.9.2799. [DOI] [PMC free article] [PubMed] [Google Scholar]
- Krueppel R, Remy S, Beck H. Dendritic integration in hippocampal dentate granule cells. Neuron. 2011;71:512–528. doi: 10.1016/j.neuron.2011.05.043. [DOI] [PubMed] [Google Scholar]
- Kulik A, Vida I, Luján R, Haas CA, López-Bendito G, Shigemoto R, Frotscher M. Subcellular localization of metabotropic GABA(B) receptor subunits GABA(B1a/b) and GABA(B2) in the rat hippocampus. J Neurosci. 2003;23:11026–11035. doi: 10.1523/JNEUROSCI.23-35-11026.2003. [DOI] [PMC free article] [PubMed] [Google Scholar]
- Leutgeb JK, Leutgeb S, Moser MB, Moser EI. Pattern separation in the dentate gyrus and CA3 of the hippocampus. Science. 2007;315:961–966. doi: 10.1126/science.1135801. [DOI] [PubMed] [Google Scholar]
- Macek TA, Winder DG, Gereau RW, 4th, Ladd CO, Conn PJ. Differential involvement of group II and group III mGluRs as autoreceptors at lateral and medial perforant path synapses. J Neurophysiol. 1996;76:3798–3806. doi: 10.1152/jn.1996.76.6.3798. [DOI] [PubMed] [Google Scholar]
- Magee JC. Dendritic hyperpolarization-activated currents modify the integrative properties of hippocampal CA1 pyramidal neurons. J Neurosci. 1998;18:7613–7624. doi: 10.1523/JNEUROSCI.18-19-07613.1998. [DOI] [PMC free article] [PubMed] [Google Scholar]
- Maglóczky Z, Acsády L, Freund TF. Principal cells are the postsynaptic targets of supramammillary afferents in the hippocampus of the rat. Hippocampus. 1994;4:322–334. doi: 10.1002/hipo.450040316. [DOI] [PubMed] [Google Scholar]
- Miles R, Tóth K, Gulyás AI, Hájos N, Freund TF. Differences between somatic and dendritic inhibition in the hippocampus. Neuron. 1996;16:815–823. doi: 10.1016/S0896-6273(00)80101-4. [DOI] [PubMed] [Google Scholar]
- Morishima Y, Miyakawa T, Furuyashiki T, Tanaka Y, Mizuma H, Nakanishi S. Enhanced cocaine responsiveness and impaired motor coordination in metabotropic glutamate receptor subtype 2 knockout mice. Proc Natl Acad Sci U S A. 2005;102:4170–4175. doi: 10.1073/pnas.0500914102. [DOI] [PMC free article] [PubMed] [Google Scholar]
- Patil ST, Zhang L, Martenyi F, Lowe SL, Jackson KA, Andreev BV, Avedisova AS, Bardenstein LM, Gurovich IY, Morozova MA, Mosolov SN, Neznanov NG, Reznik AM, Smulevich AB, Tochilov VA, Johnson BG, Monn JA, Schoepp DD. Activation of mGlu2/3 receptors as a new approach to treat schizophrenia: a randomized Phase 2 clinical trial. Nat Med. 2007;13:1102–1107. doi: 10.1038/nm1632. [DOI] [PubMed] [Google Scholar]
- Petralia RS, Wang YX, Niedzielski AS, Wenthold RJ. The metabotropic glutamate receptors, mGluR2 and mGluR3, show unique postsynaptic, presynaptic and glial localizations. Neuroscience. 1996;71:949–976. doi: 10.1016/0306-4522(95)00533-1. [DOI] [PubMed] [Google Scholar]
- Rolls ET, Kesner RP. A computational theory of hippocampal function, and empirical tests of the theory. Prog Neurobiol. 2006;79:1–48. doi: 10.1016/j.pneurobio.2006.04.005. [DOI] [PubMed] [Google Scholar]
- Schmidt-Hieber C, Jonas P, Bischofberger J. Subthreshold dendritic signal processing and coincidence detection in dentate gyrus granule cells. J Neurosci. 2007;27:8430–8441. doi: 10.1523/JNEUROSCI.1787-07.2007. [DOI] [PMC free article] [PubMed] [Google Scholar]
- Shigemoto R, Kinoshita A, Wada E, Nomura S, Ohishi H, Takada M, Flor PJ, Neki A, Abe T, Nakanishi S, Mizuno N. Differential presynaptic localization of metabotropic glutamate receptor subtypes in the rat hippocampus. J Neurosci. 1997;17:7503–7522. doi: 10.1523/JNEUROSCI.17-19-07503.1997. [DOI] [PMC free article] [PubMed] [Google Scholar]
- Sreepathi HK, Ferraguti F. Subpopulations of neurokinin 1 receptor-expressing neurons in the rat lateral amygdala display a differential pattern of innervation from distinct glutamatergic afferents. Neuroscience. 2012;203:59–77. doi: 10.1016/j.neuroscience.2011.12.006. [DOI] [PMC free article] [PubMed] [Google Scholar]
- Ster J, Mateos JM, Grewe BF, Coiret G, Corti C, Corsi M, Helmchen F, Gerber U. Enhancement of CA3 hippocampal network activity by activation of group II metabotropic glutamate receptors. Proc Natl Acad Sci U S A. 2011;108:9993–9997. doi: 10.1073/pnas.1100548108. [DOI] [PMC free article] [PubMed] [Google Scholar]
- Steward O. Topographic organization of the projections from the entorhinal area to the hippocampal formation of the rat. J Comp Neurol. 1976;167:285–314. doi: 10.1002/cne.901670303. [DOI] [PubMed] [Google Scholar]
- Tamaru Y, Nomura S, Mizuno N, Shigemoto R. Distribution of metabotropic glutamate receptor mGluR3 in the mouse CNS: differential location relative to pre- and postsynaptic sites. Neuroscience. 2001;106:481–503. doi: 10.1016/S0306-4522(01)00305-0. [DOI] [PubMed] [Google Scholar]
- Trigo FF, Corrie JE, Ogden D. Laser photolysis of caged compounds at 405 nm: photochemical advantages, localisation, phototoxicity and methods for calibration. J Neurosci Methods. 2009;180:9–21. doi: 10.1016/j.jneumeth.2009.01.032. [DOI] [PubMed] [Google Scholar]
- Trommald M, Hulleberg G. Dimensions and density of dendritic spines from rat dentate granule cells based on reconstructions from serial electron micrographs. J Comp Neurol. 1997;377:15–28. doi: 10.1002/(SICI)1096-9861(19970106)377:1<15::AID-CNE3>3.0.CO;2-M. [DOI] [PubMed] [Google Scholar]
- Ujfalussy B, Kiss T, Erdi P. Parallel computational subunits in dentate granule cells generate multiple place fields. PLoS Comput Biol. 2009;5:e1000500. doi: 10.1371/journal.pcbi.1000500. [DOI] [PMC free article] [PubMed] [Google Scholar]
- Watanabe D, Nakanishi S. mGluR2 postsynaptically senses granule cell inputs at Golgi cell synapses. Neuron. 2003;39:821–829. doi: 10.1016/S0896-6273(03)00530-0. [DOI] [PubMed] [Google Scholar]
- Yokoi M, Kobayashi K, Manabe T, Takahashi T, Sakaguchi I, Katsuura G, Shigemoto R, Ohishi H, Nomura S, Nakamura K, Nakao K, Katsuki M, Nakanishi S. Impairment of hippocampal mossy fiber LTD in mice lacking mGluR2. Science. 1996;273:645–647. doi: 10.1126/science.273.5275.645. [DOI] [PubMed] [Google Scholar]