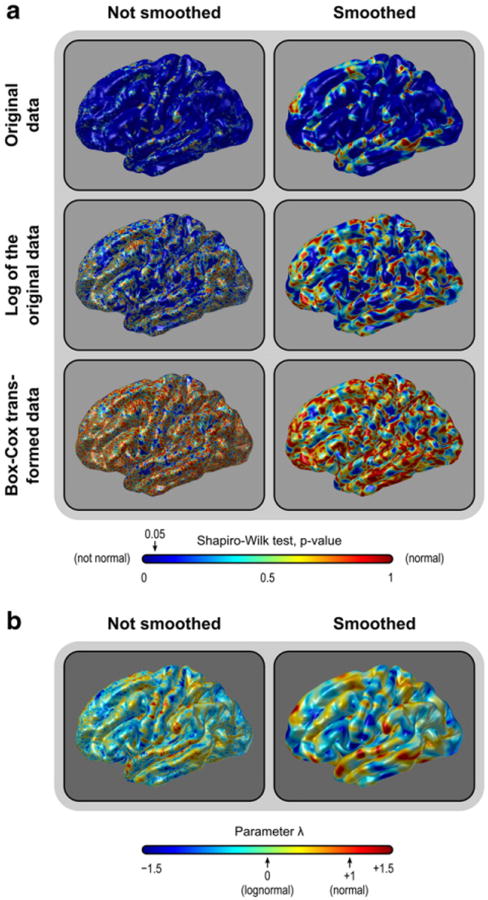
Fig. 5.
(a) The area of the cortical surface is not normally distributed (upper panels). Instead, it is lognormally distributed throughout most of the brain (middle panels). A Box–Cox transformation can further improve normality (lower panels). The same pattern is present without (left) or with (right) smoothing (FWHM = 10 mm). (b) Spatial distribution of the parameter λ across the brain. When λ approaches zero, the distribution is more lognormal. See the Supplemental Material for the other views of the brain and histograms for λ.

