Abstract
The mechanical properties of the joint influence how we interact with our environment and hence are important in the control of both posture and movement. Many studies have investigated how the mechanical properties—specifically the impedance—of different joints vary with different postural tasks. However, studies on how joint impedance varies with movement remain limited. The few studies that have investigated how impedance varies with movement have found that impedance is lower during movement than during posture. In this study we investigated how impedance changed as people transitioned from a postural task to a movement task. We found that subjects’ joint impedances decreased at the initiation of movement, prior to increasing at the cessation of movement. This decrease in impedance occurred even though the subjects’ torque and EMG levels increased. These findings suggest that during movement the central nervous system may control joint impedance independently of muscle activation.
I. Introduction
The mechanical properties of a joint define how the joint interacts with the environment that surrounds it. Hence it is important in both the control of posture and movement [1]. Understanding how people modulate their mechanics during everyday movement will not only provide insight as to the control mechanism people use to regulate their movement but may establish a greater understanding of how these mechanisms fail in people with motor impairments [2]. Furthermore, this understanding is crucial for designing powered prostheses that behave as the limb they are replacing [3].
The majority of studies that have investigated joint mechanics have focused on how joint impedance—the dynamic relationship between the position of the joint and the torque acting about it—is modulated during different postural conditions [4, 5]. Fewer studies have investigated how impedance changes during movement [6, 7]; and even fewer have attempted to estimate impedance throughout the entire movement cycle [8]. These studies found that joint impedance is lower during movement than it is during posture; in fact joint impedance was found to be lower during movement than at passive levels [8].
A major challenge with estimating joint impedance during movement, is developing an algorithm that can produce unbiased estimates of impedance under these conditions. Impedance is known to vary with both position and activation levels of the surrounding muscles [4, 5]; both of which vary throughout movement. One approach to deal with this non-linearity is to treat this system as a time-varying (TV) system, where the position is the TV parameter. Using an ensemble of positions and torque traces, TV estimates of joint impedance can be generated [9]; however, one drawback of this approach is that many hundreds of realizations of the same movement are required [10]. A second difficulty with estimating the impedance during movement is that it is a closed-loop problem, and estimating joint impedance as the relationship between position and torque directly will lead to biased estimates [11].
In this paper, we aim to further investigate how joint impedance changes during movement. In particular, we are investigating how people alter their impedance as they transition from posture to movement. We accomplished this by having subjects move their forearms between two positions at 5 second intervals, while continuously perturbing their forearms. Using a couple of hundred realizations of this movement, we estimated joint impedance using an algorithm developed in our lab [12] that can estimate time-varying joint impedance using fewer realizations than other TV methods; furthermore, we modified this algorithm to use the perturbation as an instrumental variable, solving the closed-loop problem. The results found here do confirm previous findings that joint impedance is lower during movement than during posture. Our results further show that this drop in impedance occurs at movement initiation, and that joint impedance greatly increases at movement cessation. Paradoxically, this drop in joint impedance occurs simultaneously with an increase in both torque and EMG levels, suggesting that during movement the central nervous system may control joint impedance independently of muscle activation.
II. Methods
A. Subjects
8 subjects (5 male, 3 female) between the ages of 22 and 30, all with no history of neuromuscular impairment participated in the study. All subjects gave informed consent to the experimental protocol, which was approved by the Northwestern Institutional Review Board.
B. Apparatus
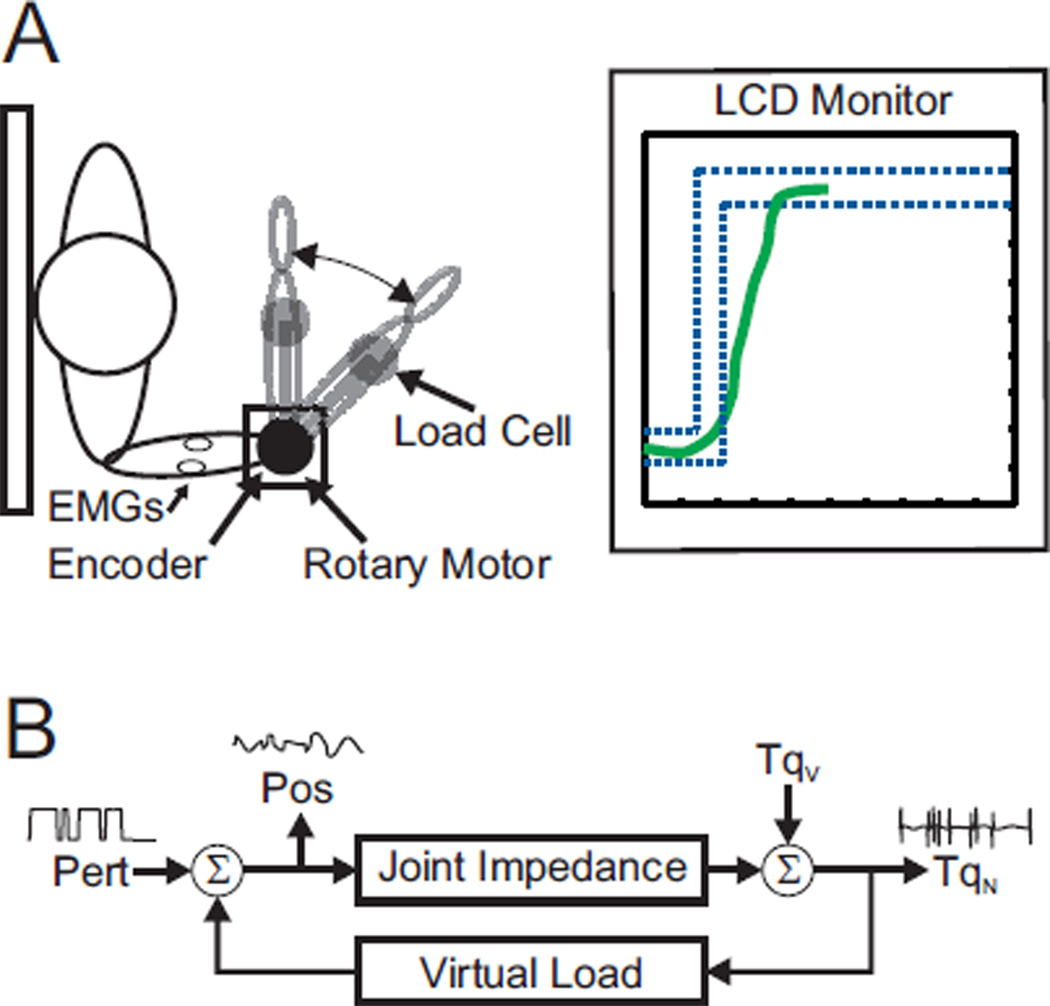
Subjects sat upright with their right forearms attached to a rotary motor via a custom made thermoplastic or fiberglass cast (Fig. 1A). The center of rotation of their elbow was visually aligned to the center of rotation of the motor. Shoulder straps immobilized subjects’ shoulders and prevented these muscles from contributing in the task. Electrical and mechanical safety stops were placed at each end of the subjects’ range of motion preventing the motor from exceeding the subjects’ voluntary range of motion. Position, torque and surface EMGs—brachiaradialis (Brd), biceps (Bic), the long head of the triceps (TLo) and the lateral head of the triceps (TLat)—were filtered at 500 Hz and recorded at 2.5 kHz.
Fig. 1.
A) Schematic of experimental setup. Subject moved their forearms—with the aid of visual feedback—while position, torque and elbow flexor and extensor EMGs were recorded. B) Schematic of closed-loop experiment. Subjects forearm position (Pos) was determined both by the perturbation (Pert) signal as well as a virtual load. The virtual load was programmed to act as an inertia with a bias force. The net torque (TqN) was the sum of the torque due to the joint impedance and voluntary torque (TqV).
C. Procedure
Each subject participated in one session lasting approximately 3 hours. At the start of each session, subjects’ maximal voluntary isometric contraction (MVC) levels were measured, allowing for appropriate scaling for later trials.
Subjects, provided with visual feedback of their forearm position and the target position, were instructed to move their forearms between two positions (±0.175 rad or 10°) every 5 seconds. The subjects interacted with a virtual load that consisted of an inertia of 1 kgm2 and a bias equal to 5% of that subjects flexion MVC. Position perturbations—consisting of 0.03 rad pseudorandom binary sequence (PRBS) with a 0.15 s switching time—were applied so that the final position of the subjects’ forearms depended on both the perturbation and the subjects’ interactions with the virtual load (Fig 1B). Up to 20 trials of 185 s were run; some subjects stopped prior to the completion of all 20 trials due to fatigue.
Prior to the start of these experimental trials, subjects were provided with a minimum of 3 minutes of practicing the movement without perturbations.
D. Analysis
Position, torque and rectified EMG were decimated to 100 Hz prior to any other analysis. To estimate joint impedance during this time-varying condition a modified version of the TV algorithm developed in our lab was used [12]. This algorithm needed to be modified so that it would generate unbiased impedance estimates under these closed-loop conditions. To accomplish this an instrumental variable approach, similar to the one used by de Vlugt et al. [13] was used.
First the data were segmented to create an ensemble of movements. To ensure consistency across the ensemble, the data were aligned to a theoretical ramp movement, by finding the time at which the movement maximally correlated with the theoretical ramp movement. Finally, the trials that correlated the worst with the ramp movement were discarded.
Impedance was estimated as the impulse response function (IRF) relating position to torque. This was computed by solving the following equation
| (1) |
where
h(t) is the joint impedance at time t, Δt is the sampling interval (0.01 s), M1 and M2 are the minimum and maximum lag (−0.04 & 0.04 s), and ϕux and ϕuy are the multisegment correlations between the perturbation and the position, and the perturbation and the torque respectively. The multi-segment correlations were computed by
| (2) |
where u(i,r) is the perturbation at time i and segment r, x(i,r) is the position (or torque) at time i and segment r, N is the length of the window over which joint impedance estimates were generated (0.2 s or 20 samples) and R is the total number of segments (150–225 depending on subject). The stiffness—the steady state gain of the impedance—was computed by integrating the impedance IRFs.
The quality of the impedance estimates were assessed by computing the percentage of variance accounted for (%VAF)
| (3) |
where Tq(t) is the measured torque, and T̂q(t) is the torque predicted by the impedance estimates.
As a validation of the stiffness estimates produced by integrating the impedance IRFs, a second estimate of stiffness was generated. This was done by finding all PRBS transitions that occur in a given time window (0.2 seconds) and aligning the perturbation—along with the corresponding position and torque data—on the transition of the perturbation. Stiffness estimates were then estimated by dividing the change in torque by the change in position
| (4) |
where a is the time after the perturbation (0.06–0.10 s relative to the perturbation) and b is the time before the perturbation (−0.05–−0.01 s).
III. Results
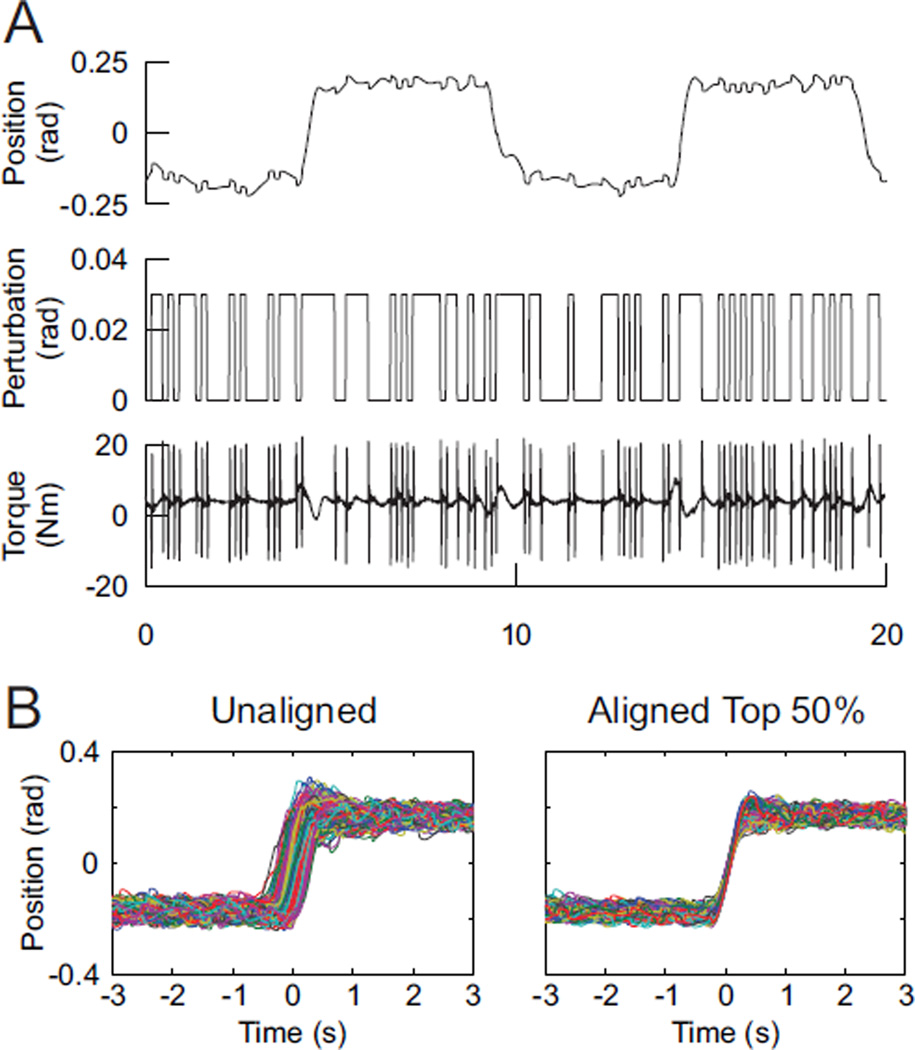
Sample data from the TV experimental trial is shown in Fig. 2A. Subjects moved their forearms between two positions at 5 second intervals, while perturbations were applied. Fig 2B shows an example of the results of the alignment process; the process made a clear visual improvement in the alignment of the data and reduced the variability in the position record ensemble from 9.3 ×10⁻³ rad2 to 2.4 ×10⁻³ rad2. The results shown in Fig. 2B depict the alignment of data for one subject when the best 50% of segments were used; this percentage varied from subject to subject. In Fig. 2B, and throughout the rest of the paper, we defined the middle of the movement to correspond to time 0.
Fig. 2.
A) Sample data of an experimental trial. B) Alignment and selection of segments results in more visibly coherent ensembles.
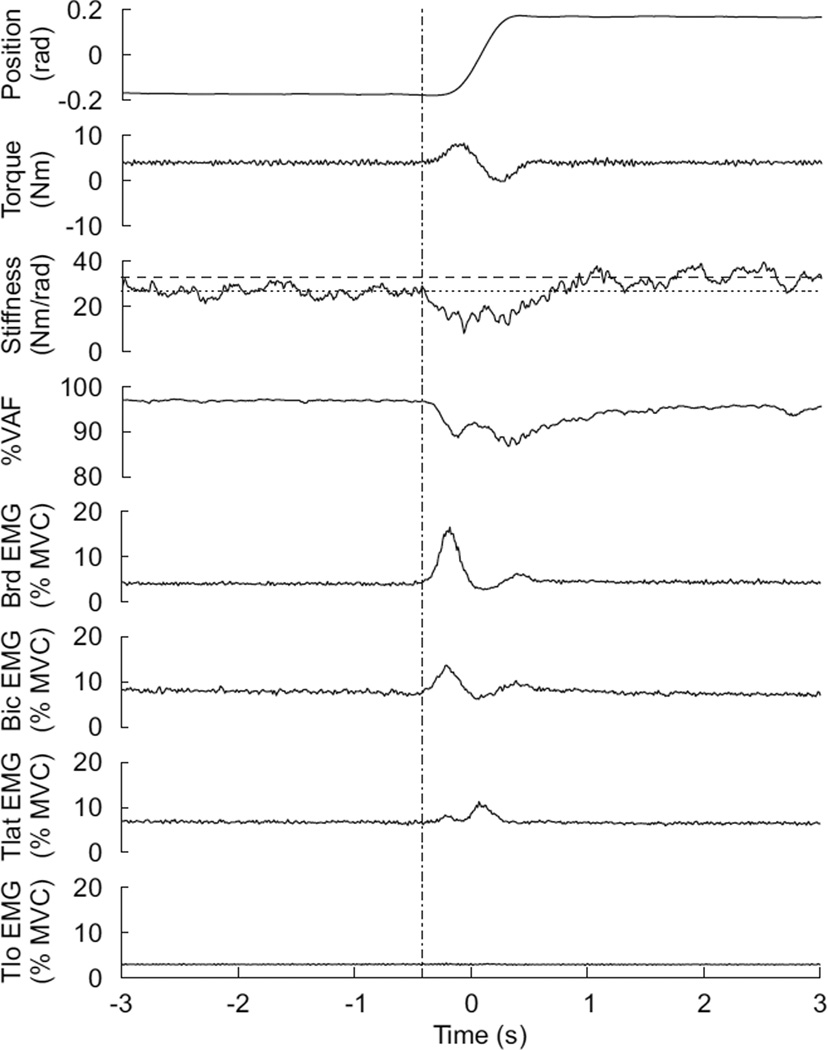
Figure 3 shows comprehensive results of the TV experiment for one subject. The analysis presented in this figure, and throughout the paper will focus on the flexion movement, and not the extension movement. It can be seen that prior to the flexion, the subjects stiffness remained constant at approximately 25 Nm/rad, while after the movement the stiffness remained constant at approximately 30 Nm/rad. However, during the movement (from −.25–.25 s) the stiffness decreased to 15 Nm/rad. This decrease is rather surprising, as it coincided with an increase in torque and flexor EMGs (Bic and Brd) and no decrease in extensor EMG. The estimated impedance IRFs did a good job at modeling the system at all times, as the %VAF remained at or above 90% throughout the trial. The %VAF did decrease slightly during the movement, however this was most likely due to increased noise that resulted from inconsistent movements trajectories and not an indication of poor IRF estimates.
Fig. 3.
Summary of experimental findings. At the initiation of the movement (dash-dotted line) impedance dipped below pre-movement levels (dotted line), while at the cessation of movement stiffness increased to post-movement level (dashed-line). This drop in stiffness occurred despite increased levels of torque and EMG.
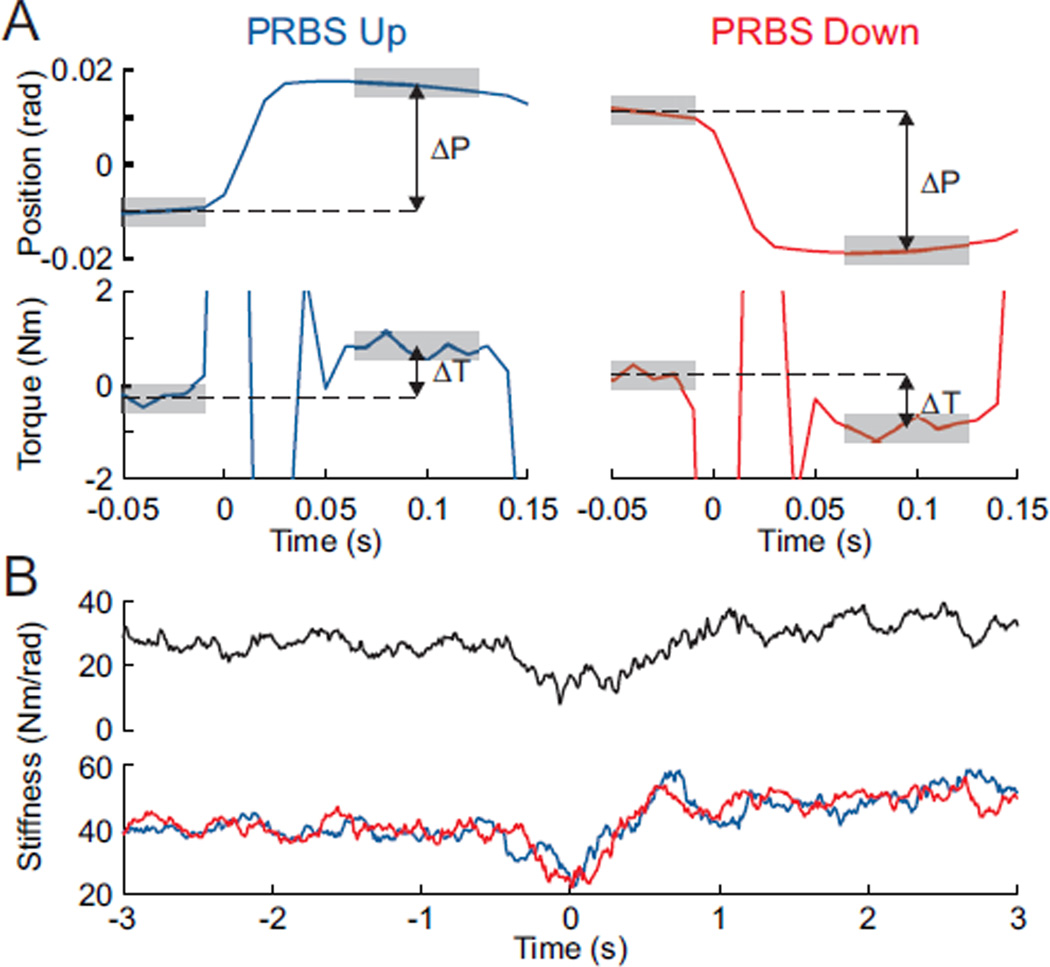
As a validation of the estimates produced using the system identification techniques, we also used more classical step response methods to estimate the stiffness. Fig. 4A demonstrates how this was done: by measuring the relationship between the change in torque and position before and after a perturbation, a stiffness estimate can be generated. Fig 4B shows the stiffness estimates generated from both the impedance IRFs and this step method. Both methods show the same TV behavior; stiffness decreased during movement before reaching an increased value when the subjects maintained their forearm at the new position. There is an offset between the stiffness estimates generated by the two methods, however this is expected as the step method is known to misestimate stiffness in this compliant condition. This phenomenon will be discussed in further detail in the discussion.
Fig. 4.
Estimation of stiffness from step responses. A) Stiffness can be estimated from each individual PRBS step, by computing the change in torque (ΔT)—measured as the difference in the average torque before and after the perturbation (gray shaded areas)—divided by the change in position (ΔP). B) Stiffness estimated from the step analysis (bottom: blue & red) shows the same drop in stiffness at the initiation of movement as the estimates generated from the IRFs (top: black).
IV. Discussion
Joint impedance has been extensively studied during postural tasks [4, 5]; however few studies have investigated thoroughly how impedance varies during movement. Here in this study we estimated joint impedance throughout a movement. In particular we investigated how stiffness changes when people transition from posture to movement and vice-versa. We found that impedance dropped at the initiation of movement and increased at the cessation of movement. These findings were determined using both a system identification approach as well as analysis of individual steps.
A. Stochastic vs. Step Analysis
We presented two methods for estimating the stiffness: a stochastic method where we generated IRFs relating position and torque; and a step method where we found the average step response at each time point. Though both estimates show the same time-varying behavior, there is a clear offset between the two estimates. This offset is expected as the step analysis method will produce biased estimates. This bias arises due the closed-loop nature of the system.
When doing this type of static analysis it is essential for the system to be in steady state. However if one waited until the closed-loop system reached a steady state, estimating stiffness would not be possible because the position would return to zero. Instead, the goal is to estimate the position and torque after the joint impedance reaches a steady state, but before the closed-loop system has time to affect the position. Indeed, the joint impedance has very rapid dynamics and reaches steady state within a few tens of milliseconds and the closed-loop system is very slow needing over 5 seconds to reach steady state. Nonetheless there is a contribution of the closed-loop dynamics to this method of estimating stiffness, resulting in a biased stiffness estimate.
The stochastic method used in this study does not have the same limitation. Because we are using an instrumental variable approach, where we correlate the position and torque with the perturbation, the impedance estimates are not biased by the dynamics of the closed-loop system. Thus, the stochastic method is superior to the step method because it produces unbiased estimates of the impedance, as well as producing dynamic impedance estimates and not static stiffness estimates.
B. Stiffness Dropped at Movement Initiation
The main finding of this study is that impedance dropped at the initiation of movement and increased at movement cessation. These results agree with other findings that show that stiffness is lower during movement than posture [8]. Interestingly, the drop in stiffness occurs simultaneously with an increase in both torque and EMG levels. This contradicts previous studies that showed that muscle stiffness increases monotonically with muscle activation [14]. This would suggest that the central nervous system has the ability to control joint impedance independently of muscle activation.
Acknowledgments
This work was supported by the NIH (grant R01 NS053813) and the NSF Program in Cyber Physical Systems (award 0939963).
Contributor Information
Daniel Ludvig, Sensory Motor Performance Program, Rehabilitation Institute of Chicago, Chicago, IL 60611 USA (phone: 312-238-3381; fax: 312-238-2208; daniel.ludvig@mail.mcgill.ca)..
Stephen A. Antos, Department of Biomedical Engineering at Northwestern University, Chicago, IL 60611 USA (santos@u.northwestern.edu).
Eric J. Perreault, Department of Biomedical Engineering and the Department of Physical Medicine and Rehabilitation at Northwestern University, Chicago, IL 60611 USA, and also with Sensory Motor Performance Program, Rehabilitation Institute of Chicago, Chicago, IL 60611 USA (eperreault@northwestern.edu)..
References
- 1.Kearney RE, Hunter IW. System identification of human joint dynamics. Crit Rev Biomed Eng. 1990;vol. 18:55–87. [PubMed] [Google Scholar]
- 2.Galiana L, et al. Identification of intrinsic and reflex ankle stiffness components in stroke patients. Exp Brain Res. 2005 Sep;vol. 165:422–434. doi: 10.1007/s00221-005-2320-z. [DOI] [PubMed] [Google Scholar]
- 3.Hansen AH, et al. The human ankle during walking: implications for design of biomimetic ankle prostheses. J Biomech. 2004 Oct;vol. 37:1467–1474. doi: 10.1016/j.jbiomech.2004.01.017. [DOI] [PubMed] [Google Scholar]
- 4.Mirbagheri MM, et al. Intrinsic and reflex contributions to human ankle stiffness: variation with activation level and position. Exp Brain Res. 2000 Dec;vol. 135:423–436. doi: 10.1007/s002210000534. [DOI] [PubMed] [Google Scholar]
- 5.Zhang LQ, et al. In vivo human knee joint dynamic properties as functions of muscle contraction and joint position. J Biomech. 1998 Jan;vol. 31:71–76. doi: 10.1016/s0021-9290(97)00106-1. [DOI] [PubMed] [Google Scholar]
- 6.Popescu F, et al. Elbow impedance during goal-directed movements. Exp Brain Res. 2003 Sep;vol. 152:17–28. doi: 10.1007/s00221-003-1507-4. [DOI] [PubMed] [Google Scholar]
- 7.Latash ML, Gottlieb GL. Reconstruction of shifting elbow joint compliant characteristics during fast and slow movements. Neuroscience. 1991;vol. 43:697–712. doi: 10.1016/0306-4522(91)90328-l. [DOI] [PubMed] [Google Scholar]
- 8.Bennett DJ, et al. Time-varying stiffness of human elbow joint during cyclic voluntary movement. Exp Brain Res. 1992;vol. 88:433–442. doi: 10.1007/BF02259118. [DOI] [PubMed] [Google Scholar]
- 9.MacNeil JB, et al. Identification of time-varying biological systems from ensemble data. IEEE Trans Biomed Eng. 1992 Dec;vol. 39:1213–1225. doi: 10.1109/10.184697. [DOI] [PubMed] [Google Scholar]
- 10.Ludvig D, et al. Identification of time-varying intrinsic and reflex joint stiffness. IEEE Trans Biomed Eng. 2011 Jun;vol. 58:1715–1723. doi: 10.1109/TBME.2011.2113184. [DOI] [PubMed] [Google Scholar]
- 11.Soderstrom T, Stocia P. System Identificaton. Cambridge: Prentice Hall Internaitonal; 1988. [Google Scholar]
- 12.Ludvig D, Perreault EJ. Estimation of joint impedance using short data segments. Conf Proc IEEE Eng Med Biol Soc. 2011 Aug;vol. 2011:4120–4123. doi: 10.1109/IEMBS.2011.6091023. [DOI] [PMC free article] [PubMed] [Google Scholar]
- 13.de Vlugt E, et al. Closed-loop multivariable system identification for the characterization of the dynamic arm compliance using continuous force disturbances: a model study. J Neurosci Methods. 2003 Jan;vol. 122:123–140. doi: 10.1016/s0165-0270(02)00303-5. [DOI] [PubMed] [Google Scholar]
- 14.Stein RB, Gordon T. Nonlinear stiffness--force relationships in whole mammalian skeletal muscles. Can J Physiol Pharmacol. 1986 Sep;vol. 64:1236–1244. doi: 10.1139/y86-209. [DOI] [PubMed] [Google Scholar]


