Abstract
Purpose
We compared results from various methods of analysis of diffusion tensor imaging (DTI) data from a single data set consisting of 10 healthy adolescents.
Methods
All subjects were imaged on a single 3T MRI system (single-shot echo-planar imaging (EPI) pulse sequence, b value 1000). We measured fractional anisotropy (FA), apparent diffusion coefficient (ADC), axial diffusivity and radial diffusivity values using 64 pixel rectangular regions of interest (ROIs) in the right-side, midline and left-side of the central portion of the splenium of the corpus callosum for fixed (i.e., at same sites in all subjects) and targeted (i.e., at sites of highest FA values) locations, We compared results with those obtained using 64 pixel oval ROIs and 100 pixel rectangular ROIs in same locations. Finally, we compared results from ROI-based methods and from tractography. All comparisons used the Wilcoxon signed rank test and the intraclass correlation of individual values.
Results
Compared to tractography, the average of mean ROI-based values was significantly higher for fixed FA (14%) and targeted FA (39%) values and significantly lower for ADC (16%) and radial diffusivity (38%) values. For solely ROI-based comparisons, significant differences were found in the following comparisons: 64 pixel ROI vs. 100 pixel ROI, oval ROI vs. rectangular ROI, targeted FA left of midline vs. mean targeted FA value, and targeted ROI right of midline vs. mean targeted FA value.
Conclusion
Markedly different values were obtained when using either ROI-based or tractography-based techniques, or ROI analysis techniques that differ only relatively slightly.
Introduction
Diffusion tensor imaging (DTI) is an imaging technique that measures microscopic motion of water molecules as a means to make determinations about the local physical environment. DTI has been used most commonly to assess the integrity of brain white matter (WM) structures and has proven valuable in evaluating normal WM development (to assess rate of myelination) as well as understanding effect of various brain diseases on WM. Depending on the choice of the analysis technique, one may derive different values. As some investigators have noted, many variables need to be considered when assessing the adequacy of a DTI study, including whether investigators employed appropriate methods to pre-process data, estimate the diffusion tensor, and extract quantitative parameters [1]. A number of methods exist for analysis of DTI data, including placement of a region of interest (ROI) within areas to be interrogated, tractography, and voxel-based morphometry, each with relative advantages and disadvantages [2].
One of the issues faced in evaluating studies performed using DTI is the fact that substantial differences may exist between study findings when different analysis techniques are employed, even when data acquisition methods are the same. With this in mind, we set out to measure the influence of two different analysis techniques using the same acquisition protocol and post-processing steps prior to data analysis. Because the ROI-based method and tractography-based method are two of the more commonly used means of assessing WM integrity, we chose those two analysis techniques for our comparison. We examined DTI measurements obtained using various types of ROI-based measurements on fractional anisotropy (FA) maps (e.g., ROIs of differing sizes, shapes and locations) as well as differences between those obtained using ROI's on FA maps and those obtained using tractography.
MATERIALS AND METHODS
The local university hospital IRB committee approved the study The study population consisted of 10 healthy adolescent individuals (7 girls, mean age 199 months; range 190–212 months) who were enrolled as part of a prospective study that included 87 healthy subjects without a history of any significant medical, neurological and psychiatric illness (50 girls, 37 boys; mean age, 11.2 ±3.6 [standard deviation]; age range, 4.2–17.7 years). Children and adolescents provided assent and legal guardians provided informed consent before participation. The details of the larger cohort have been described elsewhere [4]. In this larger study, DTI metrics were compared against results of cognitive testing. However, in the study described here, we solely concentrated on DTI imaging features for purposes of comparing alternative means of data analysis. Cognitive testing was done to include that controls had no DSM-IV Axis I disorders or learning disabilities. Exclusion criteria included: 1) Full Scale Intelligence Quotient (FSIQ) < 70; 2) disability that made a comprehensive interview of the child difficult; 3) significant medical illness, head injury, or neurological disorder; 4) autism or pervasive developmental disorder; 5) birth weight under 5 lbs or severe prenatal compromise with NICU stay; 6) current or lifetime alcohol or substance use disorder (defined as DSM-IV abuse or dependence).
MR Technique
Magnetic resonance imaging (MRI) was performed using a Siemens Trio 3.0 Tesla MRI system (Trio, Siemens Medical Systems) running version VA 24 software. Diffusion weighted images (DWI) were acquired using a single-shot echo-planar imaging (EPI) pulse sequence. Imaging parameters were TE = 90 msec, TR = 7200 msec, bandwidth of 1346 Hz/pixel, acquisition matrix of 128 × 64, FOV of 220 mm, contiguous 3-mm slice thickness. We used a long turbo spin echo technique with a TE of 158 ms and a short turbo spin echo with a TE of 24ms rather than a double spin echo/dual spin echo sequence. All axial slices were acquired parallel to the anterior commissure-posterior commissure line. Images were acquired with diffusion weighting in each of 6 different directions, all with a b-value (diffusion weighting factor) of 1000. In addition, an image with no diffusion weighting (b-value of 0) was acquired as reference. There were four separate acquisitions using a standard six direction Siemens Trio scheme.
The corresponding directions were averaged together (over the acquisitions, so for a given direction we averaged the four acquisitions for that direction after thresholding and smoothing). The diffusion tensor eigenvalues were calculated in each voxel allowing the calculation of the mean diffusivity (ADC) and the FA value in each voxel using established methods [5]. The images obtained before application of diffusion gradients (i.e., B0 images) were co-registered with diffusion-weighted images before analysis. The ADC value is a measure of the rate of microscopic water motion without any attention to the directionality (i.e., anisotropy). The FA value refers to the tendency for microscopic water motion to proceed preferentially in one direction (i.e., anisotropic motion), as opposed to randomly (i.e., isotropic motion). The term radial diffusivity refers to the degree of water motion perpendicular to the major eigenvector and the term axial diffusivity refers to the degree of water motion along the direction of the major eigenvector.
A neuroradiologist reviewed scans and excluded clinically significant abnormalities. Subjects tolerated the procedure well. No sedation was used. Adolescents received saliva and urine toxicology screening to confirm the absence of alcohol, tobacco or other drug use on the day of interview and MR imaging.
Types of ROIs Used
We first set out to assess variability associated with different ROI-based techniques. Region of interest (ROI)-based measurements were implemented for the splenium of corpus callosum by a single neuroradiologist with 8 months experience analyzing DTI maps. ROI's were placed on an axial color map and automatically transferred to the FA map, ADC map and maps of Ai, A2, and /3 to generate the values. Unless otherwise designated, all ROIs were oval and encompassed an area of 64 pixels. The Ai values are hereafter referred to as axial diffusivity values and the average of A2 and A3 values as radial diffusivity values.
We performed tests using two types of ROI placement (fixed and targeted), two shapes of ROIs and two sizes of ROIs. A fixed ROI is here used to refer to an ROI whose placement is always in a standard location on the same slice in each patient. In this study, the fixed ROIs were placed in the most caudad slice on which an ROI could be placed entirely within the splenium of the corpus callosum without risk of volume-averaging with other structures (Figures 1A–C). We obtained one such ROI in the midline and one each in a location just right of midline and one just left of midline. The distance between the center of the left/right ROIs and midline is approximately 15 pixel regions. We determined the mean of the three values. The mean FA value obtained via this method is hereafter designated as FAF. The mean ADC values obtained using fixed ROIs are designated as ADCF, radial diffusivity values as Rad DiffF and those for axial diffusivity values as Ax DiffF.
Figure 1.
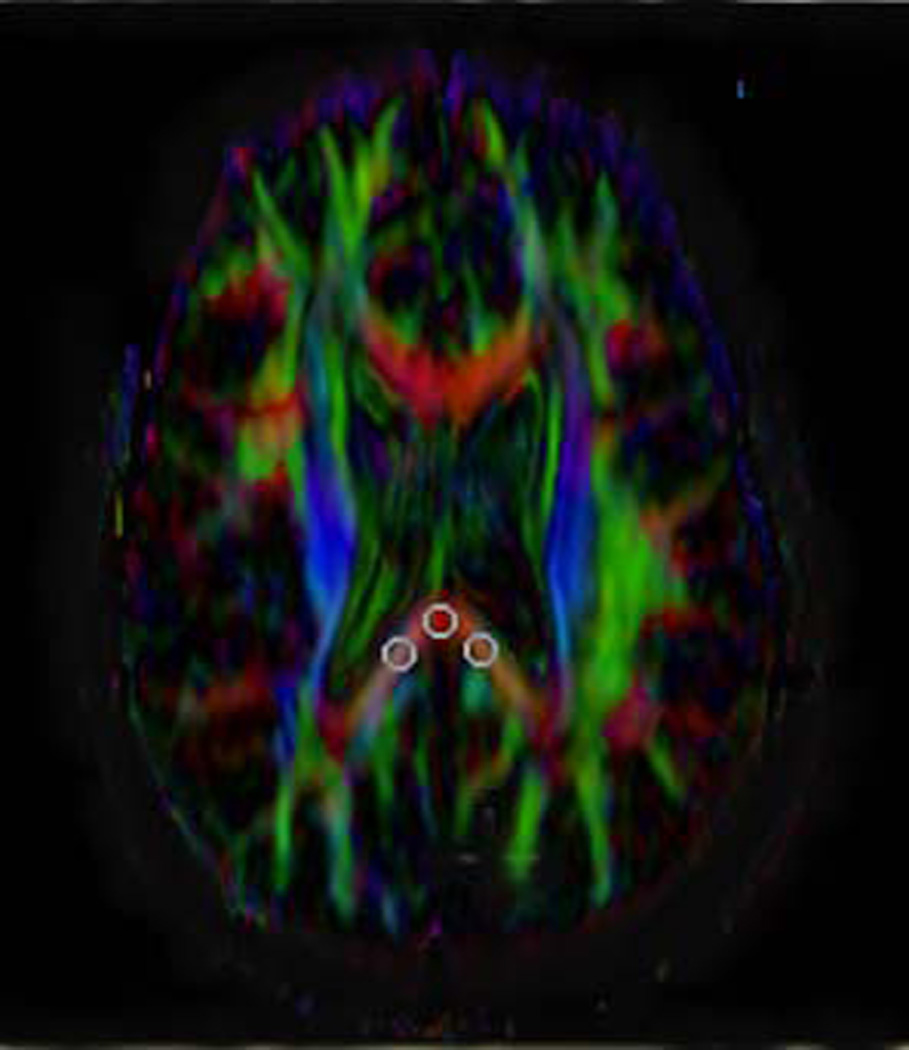
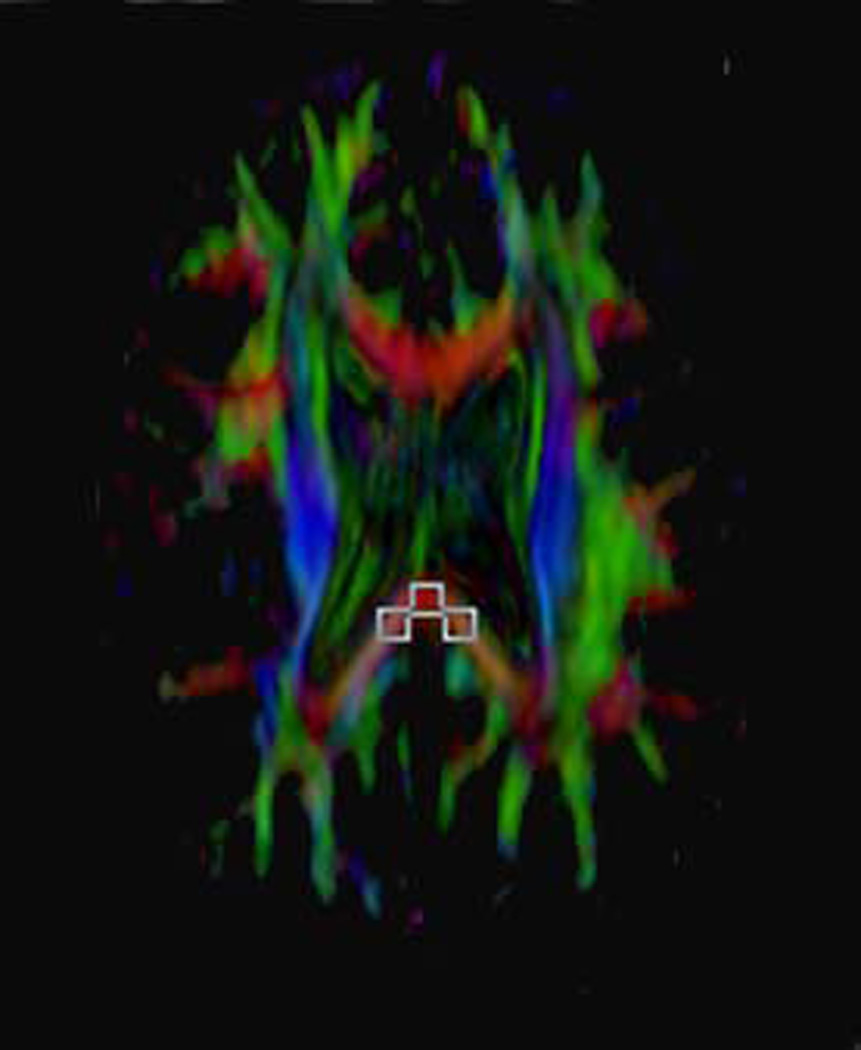
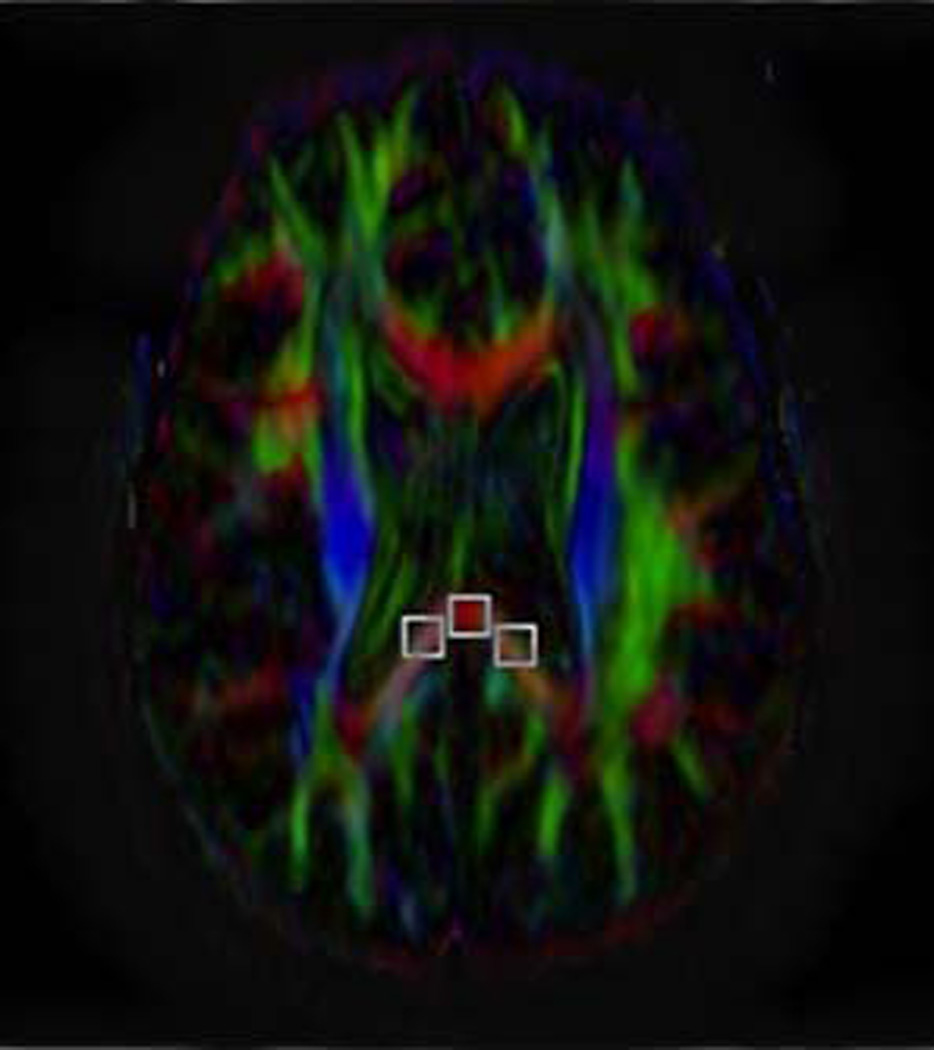
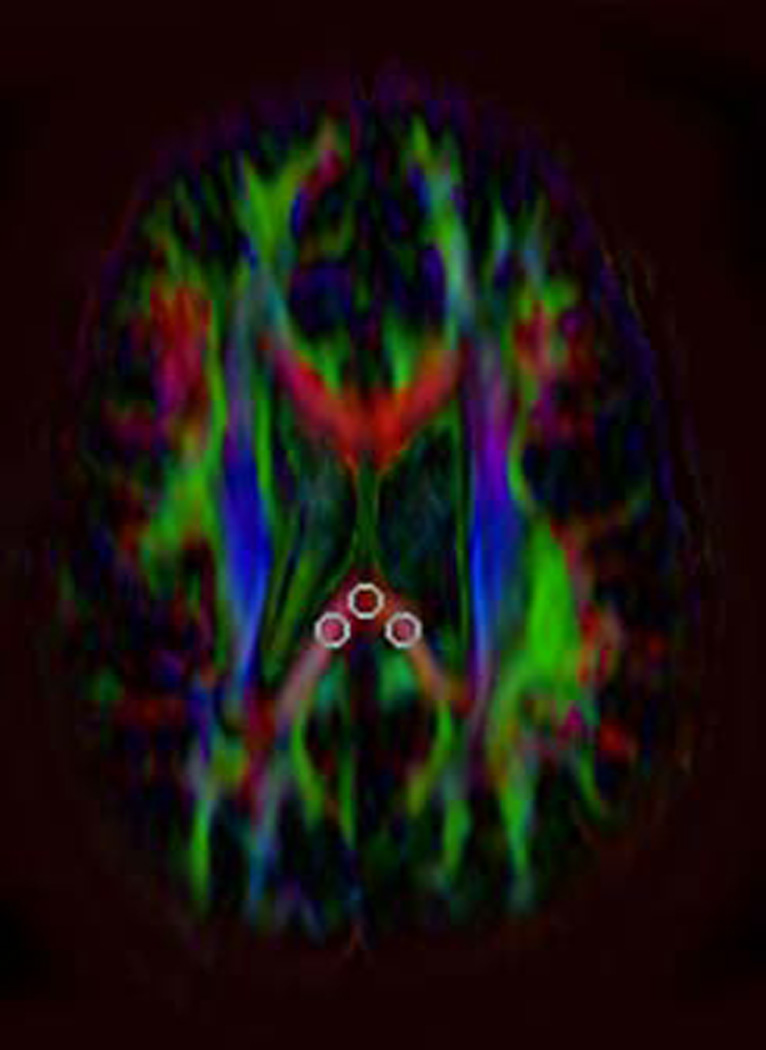
Depiction of method for placing the fixed ROIs and targeted ROIs and showing the various sizes and shapes of ROIs used. The term fixed ROIs refers to those always placed the same location and on the same slice across patients. In this study, the three fixed ROIs (midline, right and left position) were placed in the most caudad slice on which all three such ROIs could be placed on the splenium of the corpus callosum.
A) Axial FA map showing placement of oval, 8 pixel × 8 pixel ROIs. The distance between the center of the left/right ROIs and midline is approximately 15 pixel regions.
B) Axial FA map showing placement of rectangular 8 pixel × 8 pixel ROIs on the same single slice of the same subject as shown in A. The resultant FA values were then compared against the oval ROIs of the same size depicted in A.
C) Axial FA map showing the placement of rectangular 10 pixel × 10 pixel ROIs placed on the same slice as shown in A and B. The resultant FA values were then compared against the rectangular ROIs of a different size depicted in B.
D) Axial color map showing the placement of Targeted ROIs, i.e., an ROI that is placed after moving the ROI to different locations before finally placing the ROI on the site at which the highest FA value was obtained. These three ROIs could potentially be found on three different slices in the same patient. In the example shown (obtained from the same subject shown in A–C), the ROIs indicating the highest FA values at the three locations are all on the same slice. However, this slice is a different slice from that used for the fixed ROIs in A–C (indicating that the fixed ROIs did not capture the highest FA values). For targeted ROIs, solely oval, 8 pixel × 8 pixel ROIs were used.
As opposed to a fixed ROI, a targeted ROI is here used to refer to an ROI that is placed after moving the ROI to different locations (and from one slice to another) before finally placing the ROI on the site at which the highest FA value was obtained. We obtained one such ROI in the midline and one each in a location just right of midline and one just left of midline (Figure 1D). We determined the mean of the three values. The mean FA value obtained via this method is hereafter designated as FAT. The mean ADC values obtained using targeted ROIS are designated as ADCT, radial diffusivity values as Rad DiffT and those for axial diffusivity values as Ax DiffT.
The comparisons are described below.
Comparison of ROI-Based approaches
I. Measuring Fixed ROI Values
To obtain values for fixed ROIs, the observer chose the most caudad axial slice on the FA map that allowed placement of oval ROIs encompassing 64 pixels in the midline, right of midline and left of midline (Figure 1A). Then the FA, ADC, radial diffusivity and axial diffusivity values at each of the sites of ROI placement were also obtained and recorded. Finally, the mean FAF> ADCF, Rad DiffF and Ax DiffF values were recorded. The individual FAF values were compared against the mean value using the Wilcoxon signed rank test and the intraclass correlation of individual values with the mean value was determined. The same comparisons were performed for ADC values, axial diffusivity values and radial diffusivity values.
II. Measuring Targeted ROI Values
The observer placed the same size ROI in the midline of each of the images showing the splenium until the highest FA value was obtained and recorded. The same process was performed to obtain the highest FA value on the right side of the splenium and then again on the left side of the splenium. In this process, none of the highest FA values needed to be obtained from a single slice. Instead, if necessary, they could be obtained from three different slices. Finally, the mean FAT, ADCT, Rad DiffT and Ax DiffT values were recorded
Comparison of mean FAF and FAT values
We calculated mean FA value (average of the midline, right-side and left-side recordings) from the fixed ROI positions (designated as mean FAF) and also the mean FA value calculated from targeted ROIs (designated as mean FAT).
Comparison of mean FA values from ROIs of different shape
The observer chose fixed ROIs having the same size (i.e., 64 pixels) but having one of two shapes, one oval and one rectangular (Figures 1A and 1B). All ROIs were placed on the single most caudad slice on which the ROIs could be placed in the splenium, at midline, right-and left-sided positions. We then obtained the mean of the three values for each patient and compared the average of values obtained using the oval ROIs and using rectangular ROIs.
Comparison of ROIs of Different Sizes
The observer chose fixed ROIs of two different sizes, one rectangular and encompassing 64 pixels and one rectangular and encompassing 100 pixels (Figure 1C). All ROIs were placed on the single most caudad slice on which the ROIs could be placed in the splenium, at midline, right- and left-sided positions. We then obtained the mean of the three values for each patient and compared the average of values obtained using each type of ROI.
Comparison of ROI-based Methods and Tractography
Performance of Tractography
For purposes of tractography, we employed fiber assignment by means of continuous tracking (FACT) with a FA threshold of 0.25 and angle transition threshold of 40° during tracking. The corpus callosum was first dissected into regional divisions in the sagittal plane according to a method proposed by previous investigators in order to best isolate the splenium [6]. The observer defined the tract of interest by placing one ROI over the posterior one-fifth of the corpus callosum on the midsagittal FA color map (Figure 2) using a method described by other investigators [7, 8]. Then, the observer placed a second large oval ROI on callosal fibers extending from the splenium of the corpus callosum to the occipito-parietal region as seen on coronal images. Aberrant fibers that were not related to the splenium were deleted using DtiStudio software. In early studies, we found that tractography using this two-ROI method produced results very similar to tractography using solely a single ROI through the splenium of the corpus callosum, increasing our confidence in the procedure. This process allowed measurement of FA values and maps of ADC, Ai, A2, and A3.
Figure 2.
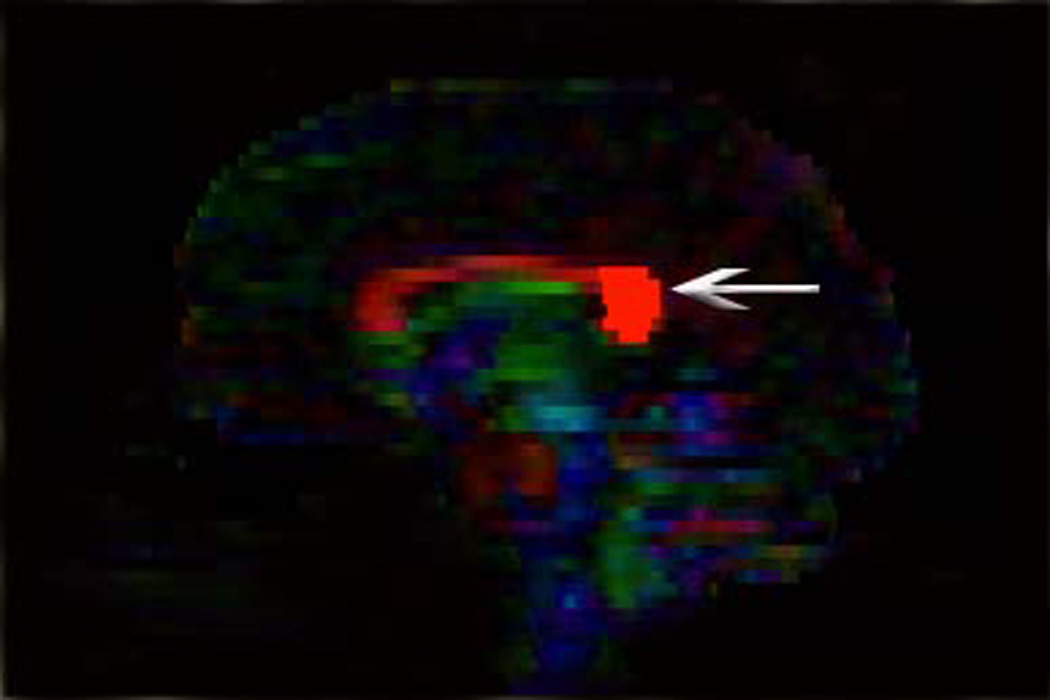
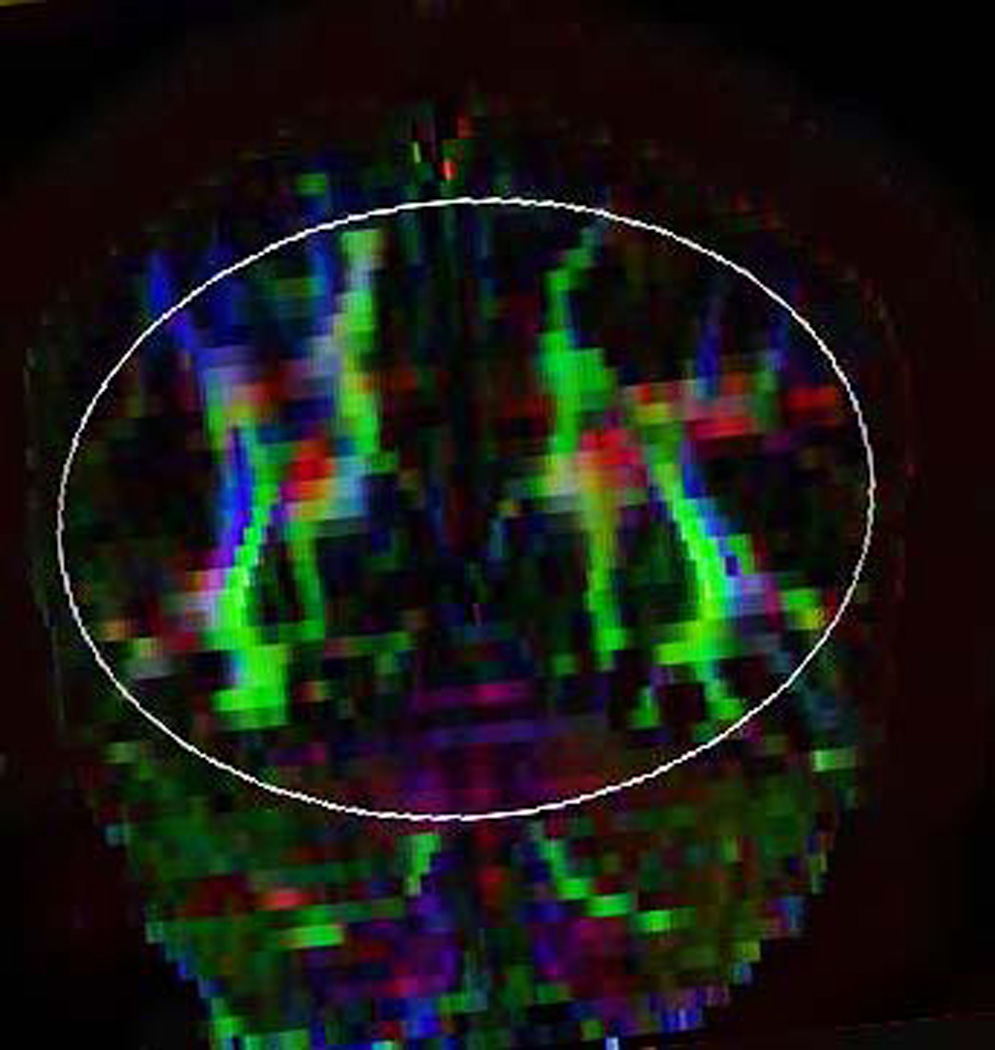
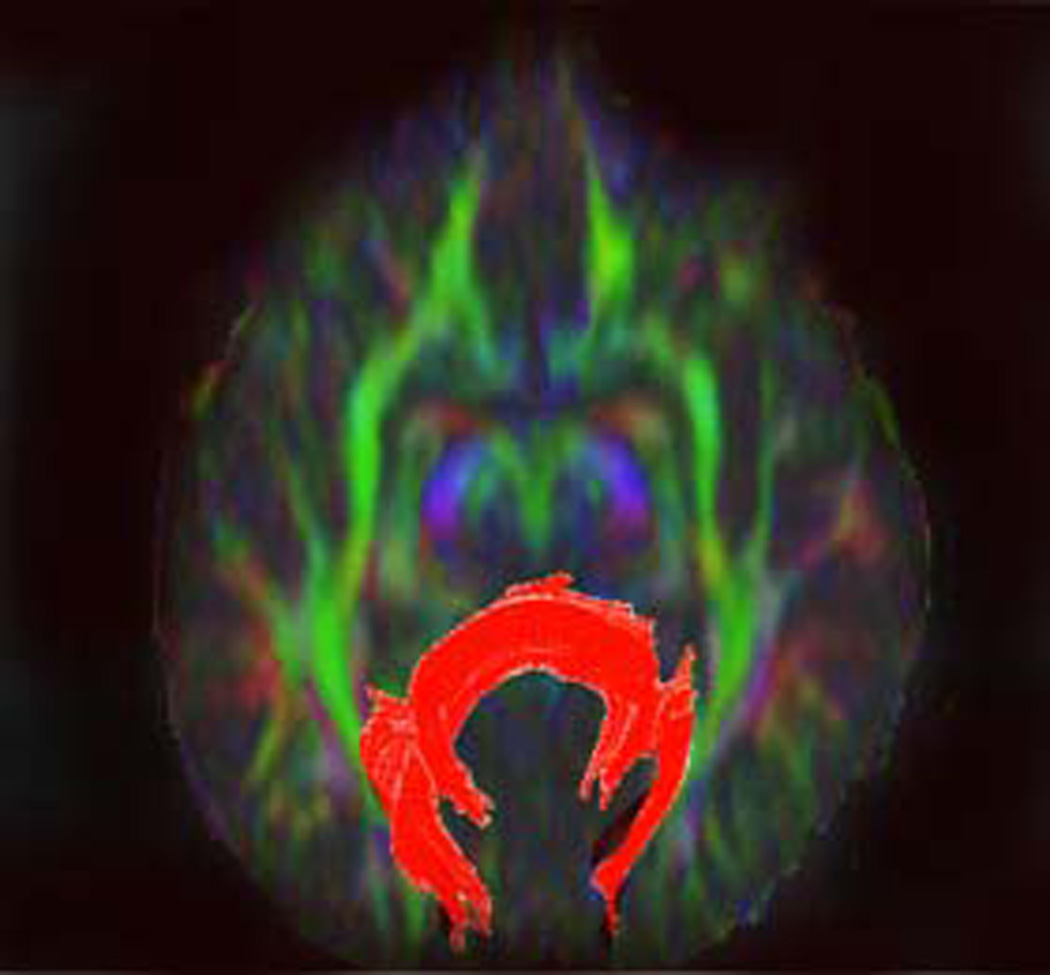
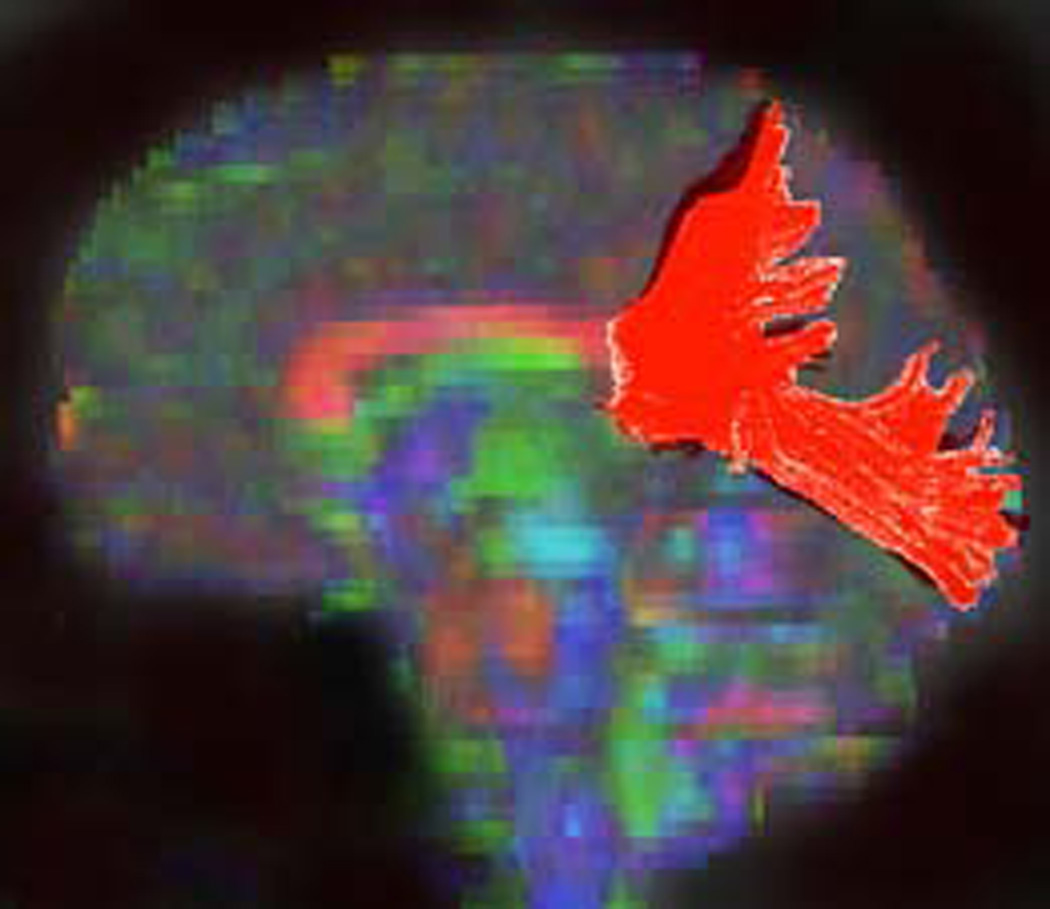
Illustration of method used to generate fiber tracts through splenium of the corpus callosum.
A) A rounded region of interest was placed around the posterior fifth of the corpus callosum (arrow) on a midsagittal color map image (according to the method outlined in ref. 6).
B) Posterior callosal fibers were reconstructed by placing a second large oval-shaped ROI that encompassed all callosal fibers projecting in the anteroposterior plane (color-coded in green) on coronal color map. Although considerable attention was paid to include solely fibers emanating from the posterior one-fifth of the corpus callosum, often fibers that were not related to splenium (e.g., those within the optic radiations) were also depicted but were deleting using DTI Studio.
C) Craniocaudad view of resultant fiber tract generated in A and_B.
D) Lateral view of fiber tract generated in A and B.
Although strictly speaking, we used ROIs to generate tractography maps, we make a distinction between placement of ROIs on FA maps, which we term our ROI-based technique, and our tractography method that also employed an ROI, which we simply term as our tractography technique. We recognize that tractography techniques exist that do not use ROIs as a means to generate tractography information [9, 10]. However, because our use of ROI-based tractography has proven robust and less computationally intensive than those other techniques, we generated tractography using ROIs.
We then compared values obtained using tractography against, individually, the fixed ROI and targeted ROI techniques described earlier.
Measurement of Intra-Observer Variability
For the ROI and Tractography methods, a single rater with 18 months experience in DTI analysis obtained ROI-based measurements and tractography measurements in 10 patients twice, two months apart. Because the measurements are continuous variables, categorical methods of determining inter-rater reliability such as Cohen's Kappa could not be used. Instead, Cronbach's alpha, which is a measure of internal consistency that has often been used to appraise inter-rater reliability [11], was used. Cronbach's alpha coefficient ranges from .0 to 1.0 and scores in the higher ranges (above 0.7) suggests that the items in two ranges are measuring the same entity.
For the ROI-based method for measuring FA values in the splenium, the Cronbach's alpha coefficient was excellent at 0.927. For the FA measurement obtained via tractography, the observer measured both the fiber tract on the right of midline and that on the left of midline. The tractography measurements of the right side show a Cronbach's alpha of 0.787, while the left side has an alpha of 0.973.
Results
A summary of all comparison is shown in Table 1. The results of individual comparisons are reported below.
Table 1.
Summary of results of statistical analyses, showing fixed (FAF) and targeted (FAT) FA values and mean of right-sided, left-sided and midline measurements.
| INTRACLASS CORRELATION | |||
|---|---|---|---|
| Values are statistically correlated | Values are not statistically correlated |
||
| WILCOXON SIGNED RANKS TEST |
Average of means was statistically different |
Not interchangeable | Not interchangeable |
| ROI based measurements: | FAF: Tract vs ROI | ||
| Oval vs Rectangle | FAT: Tract vs ROI | ||
| 8×8 vs 10×10 | ADC: Tract vs ROI | ||
| FAT left vs FAT mean | RD: Tract vs ROI | ||
| FAT right vs FAT mean | ROI based measurements: | ||
| FAT vs FAF | |||
|
Average of means was not statistically different |
Interchangeable | Interchangeable? | |
| ROI based measurements: | λ1: Tract vs ROI | ||
| FAF left vs FAF mean | ROI based measurements: | ||
| FAF right vs FAF mean | FAF mid vs FAF mean | ||
| FAT mid vs FAT mean | RD: mid vs RD mean | ||
| ADC left vs ADC mean | |||
| ADC right vs ADC mean | |||
| ADC mid vs ADC mean | |||
| λ1 left vs λ1 mean | |||
| λ1 right vs λ1 mean | |||
| λ1 mid vs λ1 mean | |||
| RD left vs RD mean | |||
| RD right vs RD mean | |||
Comparison of Means of Individual Values and Average Values
Comparison of Mean of Individual FAF Values and Average FAF values
The mean left, right and midline FAF values were compared against the average of these values (i.e., average of means of left, right, and midline values) (Figure 1 A). The mean right, left and midline values and average of the three are shown in Table 2. No significant difference was found using the Wilcoxon signed ranks test (Table 2).
Table 2.
Comparison of DTI parameters obtained by three individual (right, left and midline) ROI's compared to mean of all three values.
| DTI parameters |
Position within Splenium |
Mean value (Individual ROI) |
Average of three ROI's |
Difference between Mean value and Average |
Comparison of Mean value and Average* |
Correlation between mean value and average** |
|---|---|---|---|---|---|---|
| FAF | Left | 0.57300 | 0.57633 | 0.70% | 0.460 (0.645) | 0.792 (0.002) |
| Right | 0.56000 | 2.92% | 1.485 (0.138) | 0.829 (0.001) | ||
| Midline | 0.59600 | 3.63% | 1.633 (0.102) | 0.137 (0.344) | ||
| FAT | Left | 0.67800 | 0.70233 | 3.58% | 2.397 (0.017) | 0.913 (0.001) |
| Right | 0.72100 | 2.56% | 2.255 (0.024) | 0.946 (0.001) | ||
| Midline | 0.70800 | 1.02% | 0.462 (0.644) | 0.871 (0.001) | ||
| ADC | Left | 0.00096 | 0.00096 | 0.99% | 0.663 (0.508) | 0.884 (0.001) |
| Right | 0.00092 | 3.33% | 1.734 (0.083) | 0.871 (0.001) | ||
| Midline | 0.00098 | 2.34% | 0.918 (0.359) | 0.810 (0.001) | ||
| Radial Diffusivity |
Left | 0.00051 | 0.00051 | 0.98% | 0.255 (0.799) | 0.709 (0.007) |
| Right | 0.00052 | 1.33% | 1.682 (0.093) | 0.566 (0.035) | ||
| Midline | 0.00051 | 0.35% | 0.612 (0.541) | 0.435 (0.090) | ||
| Axial Diffusivity |
Left | 0.00188 | 0.00189 | 0.07% | 1.020 (0.308) | 0.664 (0.013) |
| Right | 0.00180 | 5.20% | 0.663 (0.508) | 0.646 (0.016) | ||
| Midline | 0.00198 | 5.14% | 1.784 (0.074) | 0.658 (0.014) |
Wilcoxon Signed Rank test (Z statistic (p values)) ns/r=10
Intraclass Correlation Test (r (p value)) df=9
Using the intraclass correlation, right side (r=.792, p=.001), and left side (r=.829, p=.002) FAF values were found to be significantly correlated with average FAF values. Midline values were not significantly correlated with average values (r=.137, p=.344).
Comparison of Mean of Individual ADC Values and Average Values
The mean left, right and midline ADC values were compared against the average of these values (i.e., average of means of left, right, and midline values). The mean right, left and midline values and average of the three are shown in Table 2. No significant difference was found using the Wilcoxon signed ranks test (Table 2),
Left side (r=884, p<.001), right side (r=.871, p<.001), and midline (r=.810, p=.001) ADC values were found to be significantly correlated with average ADC values using intraclass correlation.
Comparison of Mean of Individual Radial Diffusivity Values and Average Values
The mean left, right and midline radial diffusivity values were compared against the average of these values (i.e., average of means of left, right, and midline values). These values are shown in Table 2. No significant difference was found between these values.
Using the intraclass correlation, left side (r=.709, p=.007) and right side (r= 566, p=.035) radial diffusivity values were found to be significantly correlated with average radial diffusivity values. However, midline values (r=435, p=.09) were not significantly correlated with average values.
Comparison of Mean of Individual Axial Diffusivity Values and Average Values
The mean left, right and midline axial diffusivity values were compared against the average of these values (i.e., average of means of left, right, and midline values). These values are shown in Table 2. These values were not significantly different from one another, using a Wilcoxon signed ranks test (Table 2).
Right side (r=646, p=.016), left side (r=664, p= 013) and midline (r=658, p=.014) axial diffusivity values were found to be significantly correlated with mean axial diffusivity values, using the intraclass correlation.
Comparison of Mean of Individual FAT Values and Average Values
The average of all mean FAT values was 3.58% higher than the mean left FAT values and 2.56% lower than the average of right FAT values (Table 2). The difference between the average of all mean FAT values and left FAT values (Z=2.397, p=.017) and between the average of all mean FAT values and right FAT values (Z=2.225, p=.024) was found to be significant using the Wilcoxon signed ranks test (Table 2). The difference between the mean FAT values and midline FAT values (Z=.462, p= 644) was not statistically significant.
Comparison of the average of all mean FAT values to individual mean FAT values using the intraclass correlation revealed that the mean right side (r= 946, p<.001), left side (r=.913, p<.001) and midline (r=.871, p<.001) FAT values were significantly correlated with mean FAT values.
Comparison of Average of Mean FAF and mean FAT values
We calculated the average of mean FAF values (average of the midline, right-side and left-side recordings) from the fixed ROI positions (Figure 1A) and also the mean FAt value calculated from targeted ROIs (Figure 1D)(Table 3). The average of the mean FAT values (0.702) was 22% higher than the average of the mean FAF values (0.576). This difference was found to be significant using the Wilcoxon signed ranks test (Z=2.805, p= 005).
Table 3.
Comparison of average of mean FA values obtained by placing fixed (FAF) and targeted (FAT) ROI'S.
| Solely ROI- based measurements |
Average of mean FA values |
Percent difference |
Difference between average of mean values* |
Correlation between average of mean values** |
|---|---|---|---|---|
| FAF | 0.57633 | 22.2% | 2.805 (0.005) | 0.07 (0.582) |
| FAT | 0.70233 |
Intraclass Correlation Test (r (p value)) df=9
Wilcoxon Signed Rank test (Z statistic (p values)) ns/r= 10
Using intraclass correlation, these mean values were found to be not significantly correlated.
Comparison of mean FA values from ROIs of different shape
The mean FA values obtained with oval 8×8 (Figure 1A) was 2.34% greater than that obtained using rectangular 8×8 ROI's (Figure 1B), which was significant (Table 4), using the Wilcoxon signed ranks test (Z= 2.818, p= 005). The intraclass correlation test showed significant correlation between mean FA values obtained using the two sizes (r=986, p<.001).
Table 4.
Comparison of average of mean FA values (i.e., left, midline and right positions) obtained by placing ROI's with different shapes (oval versus rectangular) and different sizes (8x8 versus ×10 pixel size).
| Type of ROI | Average of mean values |
Percentage difference |
Statistical Assessment of difference between mean values* |
Correlation between mean values* |
|---|---|---|---|---|
| Oval-shaped | 0.60033 | 2.34% | 2.818(0.005) | 0.986(0.001) |
| Rectangular- shaped |
0.58633 | |||
| 8×8 pixel regions |
0.57833 | 4.49% | 2.192(0.028) | 0.566 (0.035) |
| 10×10 pixel regions |
0.55200 |
Wilcoxon Signed Rank test Z statistic (p values)) ns/r =10
Intraclass Correlation Test (r (p value)) cf/=9
Comparison of mean FA values from ROIs of different size
The average of mean FA values obtained by placing 8×8 pixel oval ROI's was 4.49% higher than the average of the mean FA values obtained by placing 10×10 pixel oval ROI's (Table 4). This difference was found to be significant, using the Wilcoxon signed ranks test (Z=2.192, p= 028). Using the intraclass correlation, mean FA values obtained by either method were significantly correlated (r= 566, p=.035).
Comparison of Fixed FA values and Tractography Values
The mean FAF values obtained by placing ROI's on FA maps (Figure 1) and mean FA values obtained by tractography (Figure 2) were compared (Table 5). The average of the mean FAF values was 13.94% higher, which was statistically significant using the Wilcoxon signed ranks test (Z=2.803, p=.005). Using intraclass correlation, no significant correlation was seen between the values obtained by the two techniques.
Table 5.
Comparison of mean values obtained by placing solely multiple ROl's and using tractography method.
| DTI parameters | Values from ROI-based measures + |
+ Tractography | Difference between ROI and tractography methods++ |
Difference between mean values** |
Correlation between mean values** |
|---|---|---|---|---|---|
| FAF | 0.57633 | 0.50627 | −13.94% | 2.803 | 0.419 (0.100) |
| FAT | 0.70233 | 0.50627 | −38.66% | 2.803 | 0.423 (0.097) |
| ADC | 0.00096 | 0.00116 | 16.05% | 2.497 | 0.176 (0.302) |
| Radial Diffusivity | 0.00051 | 0.00083 | 37.64% | 2.803 | 0.290 (0.193) |
| Axial Diffusivity | 0.00189 | 0.00183 | −4.82% | 0.153 | 0.022 (0.474) |
Average of mean values
Negative value indicates average of mean ROI-based values was higher than average of mean tractography values
Wilcoxon Signed Rank test (Z statistic (p values)) ns/r = 10
Intraclass Correlation Test (r (p value) o7=9
Comparison of Targeted FA values and Tractography Values
We compared mean FAT values (i.e., obtained using ROIs in Figure 1) and mean FA values obtained by tractography (Figure 2) (Table 5). The average of the mean FAT values was 38.66% higher than that obtained by tractography. Using the Wilcoxon signed ranks test, these differences were significant (Z=2.803, p=.005). Using the intraclass correlation, there was no significant correlation between the mean FAT values and mean FA values obtained by tractography.
Comparison of ADC values from ROI-based Methods and from Tractography
Comparison of the mean ADC values obtained by placing ROI's and those obtained by tractography showed that the mean ADC values obtained using solely ROI's was 16.05% lower than that obtained via tractography (Table 5). Using the Wilcoxon signed ranks test, the difference was significant (Z=2.497, p=013). Using intraclass correlation, no significant correlation was found between the mean ADC values.
Comparison of radial diffusivity values ROI-based Methods and Tractography
The average of mean radial diffusivity values obtained using the ROI-based method was 37.6% lower than that obtained by tractography (Table 5). Using the Wilcoxon signed ranks test, the difference was significant (Z=2.803, p=.005). Using the intraclass correlation, no significant correlation was found between the mean radial diffusivity values obtained by the two methods.
Comparison of axial diffusivity values using ROI-based Methods and Tractography
Mean axial diffusivity values obtained using ROI-based method was 4.82% higher than that obtained using tractography (Table 5). Using the Wilcoxon signed ranks test, no significant difference was found between the two methods. Using intraclass correlation, no significant correlation was seen.
Discussion
In this study, we set out to determine to what extent choice of methodology in measuring various DTI parameters influenced data results. Specifically, we compared results obtained using various types of ROIs on FA maps as well as those obtained from tractography. We found statistically different values depending on ROI size and shape, method of ROI placement as well as whether one chose to place ROIs within tracts as opposed to measuring entire tracts using tractography.
When assessing solely various forms of ROI placement on FA maps, we found a number of differences dependent on technique. For instance, we found statistically significant differences in mean FA values depending on whether one placed ROIs in fixed positions or sought highest FA values in a general region. Similarly, we found statistically significant differences when comparing a single targeted ROI and the mean value of three targeted ROIs. Such details as specific method of placement (and number) of ROIs are often not stated in scientific reports, thereby limiting ability to replicate studies. As our investigation indicates, even when such details are provided, failure to exactly replicate them can lead to results that differ significantly from an initial study.
When we compared differences in results obtained when using ROIs placed on FA maps with those obtained via tractography, the findings were quite notable. Use of fixed ROIs resulted in a mean FA value that was approximately 14% higher than that obtained by tractography. When using targeted ROIs, the differences were even greater, being approximately 39% higher for targeted ROIs compared to tractography. Both differences were statistically significant. This finding can be explained by the fact that the ROI-based method interrogated the splenium and, hence, the most central portion of the WM tract passing through the splenium. As a result, the regions examined using the ROI-based method contained primarily parallel fibers with a smaller percentage of crossing fibers. On the other hand, the tractography method examined the entire WM tract passing through the splenium; it thus included the more diffuse fibers (and, likely, crossing fibers) in the periphery of the tract. The end result would be to produce a decrease in FA values for the entire tract as opposed to the central portion of the tract. If this explanation is true, one would expect the tractography-based method to produce higher mean ADC values and radial diffusivity by virtue of including portions of peripheral WM (and association tracts). In support of this statement, a previous study has shown that association tracts have higher ADC values and radial diffusivity than the corpus callosum [3]. In fact, the mean ADC value obtained by tractography was 16% higher than that obtained by solely ROI-based methods, which was statistically significant. Similarly, the mean radial diffusivity value obtained via tractography was approximately 38% higher than that obtained via solely ROI placement, a statistically significant difference.
The information provided in this study has important ramifications for evaluation of results of previous investigations as well as for designing future studies. For instance, our study indicates that, when comparing two research studies, it is important to know exactly the means by which DTI values have been obtained. In our study, we showed that even a factor as seemingly unimportant as the shape of an ROI (when controlling for size) can result in significant differences between two observers.
Reproducibility of study results is an important aspect of scientific discovery. Our study suggests that, for DTI values to be reproduced by other observers, an investigator must provide specific detail regarding the factors we outlined earlier. Our findings may also indicate why two investigators, studying similar patient populations using nearly identical methods, may report markedly different findings.
To the best of our knowledge, a direct comparison of solely ROI-based and tractography-ROI-based techniques has not been previously performed. However, we did find an article in which the performance characteristics of each DTI technique were compared. In that study, the investigators measured intra-reader and inter-reader reliability using a tractography-based technique and a solely ROI-based technique [12]. They found that for central fiber regions the intra-reader and inter-reader reliability measures for the tractography technique (0.93 and 0.76, respectively) were quite similar to those for the manual ROI technique (0.95 and 0.77, respectively). However, the investigators noted that the manual ROI method was ineffective for measuring DTI parameters in the off-center peripheral regions of the splenium, which are located in a far more lateral position than the off-midline ROIs placed in our study.
As our study indicates, differences in data processing techniques produce conflicting study results. Few published articles have addressed these issues with regard to DTI studies. In one study, the investigators assessed results from two-different DTI analysis programs, i.e., an atlas-based technique to compute FA in specific tracts and the voxel-wise technique of Tract-Based Spatial Statistics (TBSS) [13, 14]. The authors evaluated FA values in 7 portions of the corpus callosum in three groups of subjects: elderly healthy controls, amnestic Mild Cognitive Impairment patients and mild Alzheimer disease patients using both approaches. The atlas-based tractography and TBSS analyses showed the same significant differences between Alzheimer disease patients and the healthy control subjects and no significant difference between amnestic Mild Cognitive Impairment patients and healthy control subjects. However, discordant results between the two techniques were found when comparing the Alzheimer disease patients and the amnestic Mild Cognitive Impairment patients, with solely the atlas-based technique showing significant differences. The investigators attributed the difference to the fact that the TBSS technique, which is skeleton-based, did not assess the whole extent of the callosal tracts (but instead interrogates solely the central line of WM tracts) whereas the atlas-based approach evaluates the entire width of the callosal tracts. In another study, investigators used both tractography-based and ROI-based methods in their study to evaluate the effects of mild to moderate blast-related traumatic brain injury on the microstructure of brain WM and neurobehavioral outcomes [15]. They found correlation between episodic memory and FA values of the splenium, when obtained by ROI-based method. However, there was no correlation between episodic memory and FA values, when obtained by tractography-based method.
Like all studies, our study is subject to limitations. First, we used solely one observer to obtain our measurements. Providing multiple reviewers would be one means to determine the degree to which different results from the two techniques could be due to observer-related issues. However, use of multiple observers could easily have produced even more discrepant results. Furthermore, the observer we employed had substantial skills gained from many months of using our techniques. Furthermore, the assessment of intra-observer variability showed a high rate of reproducibility of measurements, making it unlikely that such variability contributed substantially to the discrepancies reported here. Another potential limitation is that we analyzed DTI data, which suffers from the fact that this technique cannot resolve fiber crossing or bending within individual voxels [16]. One might argue that techniques that could resolve intravoxel fiber crossing, such as q-ball imaging, high angular resolution diffusion imaging or diffusion spectrum imaging [10, 16]. However, these alternative techniques employ analysis schemes that require a great increase in computational demand and, for various reasons, their use is not as widespread as the DTI techniques we examined in our study. Thus, the findings would have been less readily applicable to the general population of investigators analyzing diffusion imaging data for either clinical or research purposes.
In summary, our study has shown that markedly different DTI measures can be obtained in the same data set when using analysis techniques that differ only relatively slightly (e.g., slightly different size, shape and placement of ROIs). The differences in measured values are even more profound when using fundamentally different analysis techniques, such as solely ROI measurements and tractography. These findings indicate that it is paramount that very specific details regarding analysis techniques be elucidated in studies if DTI studies are to be reproduced by other investigators. Furthermore, it is apparent that investigators must take great care in assessing disparities and similarities compared to previous studies by other investigators; perceived differences (and similarities) may easily reflect differences in analysis technique that, on the surface, appear relatively minor.
Acknowledgements
The authors thank the staff the Duke Healthy Childhood Brain Development Developmental Traumatology Research Program and the participants and their families for making this work possible. This work was supported by funding from National Institutes of Health [K24 MH071434, K24-DA028773 and RO1- MH61744, R01-AA12479, RO1-MH63407 to De Bellis].
References
- 1.Jones DK, Cercignani M. Twenty-five pitfalls in the analysis of diffusion MRI data. NMR Biomed. 2010;23:803–820. doi: 10.1002/nbm.1543. [DOI] [PubMed] [Google Scholar]
- 2.O'Donnell LJ, Westin CF. An introduction to diffusion tensor image analysis. Neurosurg Clin N Am. 2011;22:185–196. doi: 10.1016/j.nec.2010.12.004. [DOI] [PMC free article] [PubMed] [Google Scholar]
- 3.Partridge SC, Mukherjee P, Henry RG, et al. Diffusion tensor imaging: serial quantitation of white matter tract maturity in premature newborns. Neuroimage. 2004;22:1302–1314. doi: 10.1016/j.neuroimage.2004.02.038. [DOI] [PubMed] [Google Scholar]
- 4.Moon W-J, Provenzale JM, Sarikaya B, Ihn YK, Morlese J, Chen S, DeBellis MD. Diffusion-tensor imaging assessment of white matter maturation in childhood and adolescence. AJR Am J Roentgenol. 2011;197:704–712. doi: 10.2214/AJR.10.6382. [DOI] [PMC free article] [PubMed] [Google Scholar]
- 5.Pierpaoli C, Basser PJ. Toward a quantitative assessment of diffusion anisotropy. Magn Reson Med. 1996;36:893–906. doi: 10.1002/mrm.1910360612. [DOI] [PubMed] [Google Scholar]
- 6.Witelson SF, Kigar DL. Anatomical development of corpus callosum in humans: a review with reference to sex and cognition. In: Molefese DL, Segalowitz SJ, editors. Brain lateralization in children: development implications. New York, NY: Guilford; 1988. pp. 35–37. [Google Scholar]
- 7.Huang H, Zhang J, Jiang H, et al. DTI tractography based panellation of white matter: application to the mid-sagittal morphology of corpus callosum. Neuroimage. 2005;26:195–205. doi: 10.1016/j.neuroimage.2005.01.019. [DOI] [PubMed] [Google Scholar]
- 8.Saito Y, Nobuhara K, Okugawa G, et al. Corpus callosum in patients with obsessive-compulsive disorder: diffusion-tensor imaging study. Radiology. 2008;246:536–542. doi: 10.1148/radiol.2462061469. [DOI] [PubMed] [Google Scholar]
- 9.Chung HW, Chou MC, Chen CY. Principles and limitations of computational algorithms in clinical diffusion tensor MR tractography. AJNR Am J Neuroradiol. 2011;32:3–13. doi: 10.3174/ajnr.A2041. [DOI] [PMC free article] [PubMed] [Google Scholar]
- 10.Wedeen VJ, Wang RP, Schmahmann JD, et al. Diffusion spectrum magnetic resonance imaging (DSI) tractography of crossing fibers. Neuroimage. 2008;41:1267–1277. doi: 10.1016/j.neuroimage.2008.03.036. [DOI] [PubMed] [Google Scholar]
- 11.Crocker L, Algina J. Introduction to classical and modern test theory. Orlando, FL: Harcourt Brace Jovanovich; 1986. [Google Scholar]
- 12.Gilmore JH, Lin W, Corouge I, et al. Early postnatal development of corpus callosum and corticospinal white matter assessed with quantitative tractography. AJNR Am J Neuroradiol. 2007;28:1789–1795. doi: 10.3174/ajnr.A0751. [DOI] [PMC free article] [PubMed] [Google Scholar]
- 13.Preti M, Lagana M, Baglio F, et al. Comparison between skeleton-based and atlas-based approach in the assessment of corpus callosum damages in mild cognitive impairment and Alzheimer disease. Conf Proc IEEE Eng Med Biol Soc. 2011;2011:7808–7811. doi: 10.1109/IEMBS.2011.6091924. [DOI] [PubMed] [Google Scholar]
- 14.Preti M, Baglio F, Lagana M, et al. Assessing corpus callosum changes in Alzheimer's disease: Comparison between tract-based spatial statistics and atlas-based tractography. PLoS One. 2012;7:e35856. doi: 10.1371/journal.pone.0035856. Epub 2012 Apr 24. [DOI] [PMC free article] [PubMed] [Google Scholar]
- 15.Levin HS, Wilde E, Troyanskaya M, et al. Diffusion tensor imaging of mild to moderate blast-related traumatic brain injury and its sequelae. J Neurotrauma. 2010;27:683–694. doi: 10.1089/neu.2009.1073. [DOI] [PubMed] [Google Scholar]
- 16.Tuch DS. Q-ball imaging. Magn Reson Med. 2004;52:1358–1372. doi: 10.1002/mrm.20279. [DOI] [PubMed] [Google Scholar]


