

Abstract
The mismatch negativity (MMN) is a preattentive component of the auditory event-related potential that is elicited by a change in a repetitive acoustic pattern. While MMN has been extensively used in human electrophysiological studies of auditory processing, the neural mechanisms and brain regions underlying its generation remain unclear. We investigate possible homologs of the MMN in macaque primary auditory cortex (A1) using a frequency oddball paradigm in which rare “deviant” tones are randomly interspersed among frequent “standard” tones. Standards and deviants had frequencies equal to the best frequency (BF) of the recorded neural population or to a frequency that evoked a response half the amplitude of the BF response. Early and later field potentials, current source density components, multiunit activity, and induced high-gamma band responses were larger when elicited by deviants than by standards of the same frequency. Laminar analysis indicated that differences between deviant and standard responses were more prominent in later activity, thus suggesting cortical amplification of initial responses driven by thalamocortical inputs. However, unlike the human MMN, larger deviant responses were characterized by the enhancement of “obligatory” responses rather than the introduction of new components. Furthermore, a control condition wherein deviants were interspersed among many tones of variable frequency replicated the larger responses to deviants under the oddball condition. Results suggest that differential responses under the oddball condition in macaque A1 reflect stimulus-specific adaptation rather than deviance detection per se. We conclude that neural mechanisms of deviance detection likely reside in cortical areas outside of A1.
Introduction
The mismatch negativity (MMN) is a preattentive auditory event-related potential (ERP) component that is elicited by rare “deviant” sounds randomly interspersed among frequent “standard” sounds (Näätänen et al., 2007). It is obtained by subtracting responses elicited by standards from responses elicited by deviants. MMN has been attributed to neural generators within auditory cortex (Alho, 1995; Maess et al., 2007) and is commonly interpreted as reflecting the brain's automatic detection of a violation of the acoustic pattern established by the repetitive standard sounds (Näätänen et al., 2005, 2007).
While the MMN has been studied extensively in humans and used as a clinical research tool (Näätänen and Escera, 2000), the neural mechanisms and specific brain areas contributing to its generation remain unclear. Two general mechanisms underlying the MMN have been proposed. According to the “neural adaptation” hypothesis, repeated presentation of the standards results in adapted (i.e., attenuated) responses of feature-selective neurons in auditory cortex (May and Tiitinen, 2010). Rare deviant sounds activate neurons that are less adapted than those stimulated by the more frequent standard sounds, and thereby elicit a larger response. Thus, the MMN may simply reflect stimulus-specific adaptation (SSA), rather than detection of a violation of an auditory pattern (“genuine” deviance detection). SSA has been demonstrated in auditory cortex of rats and cats using the oddball paradigm (Ulanovsky et al., 2003; Farley et al., 2010). While there are differences between SSA and the MMN, including their timing and pharmacology (Farley et al., 2010), they share many important features, suggesting that SSA may contribute to its generation (Nelken and Ulanovsky, 2007).
In contrast, according to the “sensory memory” hypothesis, the MMN is due to a higher-level comparison process that detects a deviation from a stored neural “memory” of the regular acoustic pattern established by the standards (Näätänen et al., 2005). Whether the MMN primarily reflects SSA or genuine deviance detection continues to be actively debated (May and Tiitinen, 2010). A related question is whether the MMN, which has a latency between 100 and 200 ms, represents a novel ERP component or simply the modulation of an “obligatory” component, such as the auditory N1, which has a latency of ∼100 ms (May and Tiitinen, 2010).
To address these issues, we examine potential neural homologs of the MMN in primary auditory cortex (A1) of awake macaques using a classic frequency oddball paradigm. Macaques share many features of auditory cortical anatomy and physiology with humans, thus making them a potentially ideal animal model for studying neural mechanisms contributing to the human MMN (Galaburda and Pandya, 1983; Kaas and Hackett, 2000; Fishman et al., 2001; Steinschneider et al., 2005; Fishman and Steinschneider, 2010). MMN-like activity has been observed in macaque auditory cortex using an intensity-decrease oddball paradigm (Javitt et al., 1992, 1994), bolstering its value as an animal model. Translational relevance to human ERP studies is further increased by the use of multicontact electrodes that simultaneously record population responses across cortical layers, thereby facilitating characterization of any lamina-specific contributions to the MMN.
Materials and Methods
Two adult male macaque monkeys (Macaca fascicularis) were studied using previously described methods (Steinschneider et al., 1994; Fishman and Steinschneider, 2010). All experimental procedures were reviewed and approved by the Association for Assessment and Accreditation of Laboratory Animal Care International (AAALAC)-accredited Animal Institute of Albert Einstein College of Medicine and were conducted in accordance with institutional and federal guidelines governing the experimental use of primates. Animals were housed in our AAALAC-accredited Animal Institute under daily supervision of laboratory and veterinary staff. To minimize the number of monkeys used, other auditory experiments were conducted in the same animals during each recording session. Animals were acclimated to the recording environment and trained while sitting in custom-fitted primate chairs before surgery.
Surgical procedure.
Under pentobarbital anesthesia and using aseptic techniques, holes were drilled bilaterally into the dorsal skull to accommodate matrices composed of 18 ga stainless steel tubes glued together in parallel. Tubes served to guide electrodes toward A1 for repeated intracortical recordings. Matrices were stereotaxically positioned to target A1. They were oriented at a 30° anterior–posterior angle and with a slight medial–lateral tilt to direct electrode penetrations perpendicular to the superior surface of the superior temporal gyrus, thereby satisfying one of the major technical requirements of one-dimensional current source density analysis (Müller-Preuss and Mitzdorf, 1984; Steinschneider et al., 1992). Matrices and Plexiglas bars, used for painless head fixation during the recordings, were embedded in a pedestal of dental acrylic secured to the skull with inverted bone screws. Perioperative and postoperative antibiotic and anti-inflammatory medications were always administered. Recordings began after at least 2 weeks of postoperative recovery.
Stimuli.
Stimuli were generated and delivered at a sample rate of 48.8 kHz by a PC-based system using an RX8 module (Tucker Davis Technologies). Frequency response functions (FRFs) based on pure tone responses characterized the spectral tuning of the cortical sites. Pure tones used to generate the FRFs ranged from 0.15 to 18.0 kHz, were 200 ms in duration (including 10 ms linear rise/fall ramps), and were pseudorandomly presented with a stimulus onset-to-onset interval of 658 ms. Resolution of FRFs was 0.25 octaves or finer across the 0.15–18.0 kHz frequency range tested. Responses to 20–24 tones of different frequency were used to generate each FRF.
All stimuli were presented at 60 dB sound pressure level (SPL) via a free-field speaker (Microsatellite; Gallo) located 60° off the midline in the field contralateral to the recorded hemisphere and 1 m away from the animal's head (Crist Instruments). Sound intensity was measured with a sound level meter (type 2236; Bruel and Kjaer) positioned at the location of the animal's ear. The frequency response of the speaker was essentially flat (within ±5 dB SPL) over the frequency range tested.
SSA and potential homologs of the MMN were examined via a classic frequency oddball paradigm (Näätänen and Alho, 1995; Ulanovsky et al., 2003; Maess et al., 2007; Farley et al., 2010). Tones of the same frequency (standards) were repeatedly presented and randomly replaced by tones of a different frequency (deviants) (Fig. 1) with 10% probability (Sato et al., 2000; Ulanovsky et al., 2003; Maess et al., 2007; Szymanski et al., 2009). Tones comprising oddball sequences were presented with the same onset-to-onset interval as that of tones used to derive FRFs. For each recording site, two blocks of stimuli were presented in pseudorandom order. In one block, the frequency of the standard tones was set at the best frequency (BF) of the recorded neuronal population (BF tone), and the frequency of the deviant tones was set at a frequency that elicited a response that was approximately half the amplitude of the response to the BF tone (non-BF tone; Fig. 1A). In the other block, the roles of the BF and non-BF tones were reversed (Fig. 1B). Thus, SSA and potential homologs of the MMN would be reflected in the difference between responses to the same tone when it was presented as a deviant and when it was presented as a standard. Many previous studies of SSA in experimental animals used standard and deviant tones set to frequencies flanking the BF of the neuron or neural population (Ulanovsky et al., 2003; Szymanski et al., 2009; Farley et al., 2010). Here we wished to examine the difference between responses to standard and deviant tones with frequencies set equal to the BF. This stimulus configuration more closely approximates the scenario in human MMN studies, where tones comprising the oddball sequences would be expected to optimally activate neural populations in auditory cortex that are tuned to frequencies of the tones comprising the sequences. Furthermore, we wished to examine whether differences between standard and deviant responses differed when elicited by BF tones compared with non-BF tones.
Figure 1.
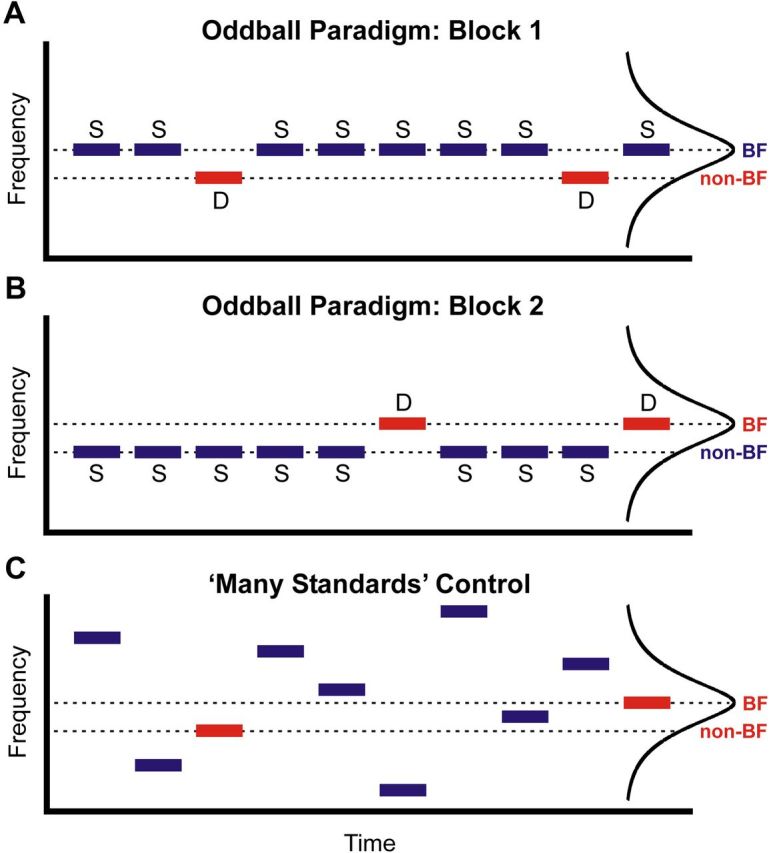
Schematic representation of the oddball and many standards control sequences. Frequency and time are represented on the y-axis and x-axis, respectively. Stimulus sequences are comprised of tones (horizontal bars; duration 200 ms) presented either in an oddball paradigm or in a many standards control paradigm. The FRF of the site is schematically shown on the right of each panel. Oddball sequences were comprised of standard (S; blue bars) and deviant (D; red bars) tones presented with a probability of 10%. A, In Block 1, standard tones had frequencies equal to the BF of the site, and deviant tones had frequencies equal to a frequency that elicited a response that was half the amplitude of the BF response (non-BF). B, In Block 2, the roles of BF and non-BF tones were reversed. C, In the many standards control condition, the same BF and non-BF tones comprising the oddball sequences in A and B were presented in the context of many standards of varying frequency.
Neurophysiological recordings.
Recordings were conducted in an electrically shielded, sound-attenuated chamber, and with the monkeys in a passive awake state, typical of studies examining MMN in humans. Monkeys were monitored via video camera throughout each recording session. Before each stimulus block, the investigator entered the recording chamber and delivered liquid reinforcements and preferred treats to the animals. This helped to maintain an alert state in the animals, though the possibility of intermittent drowsiness cannot be excluded.
Neural population measures comparable to those used in human MMN studies were examined to promote translational relevance: Local field potentials (LFPs), current source density (CSD), and multiunit activity (MUA). Recordings were performed using linear-array multicontact electrodes comprised of 16 contacts, evenly spaced at 150 μm intervals (U-Probe; Plexon). Individual contacts were maintained at an impedance of ∼200 kΩ. An epidural stainless steel screw placed over the occipital cortex served as the reference electrode. Neural signals were bandpass filtered from 3 Hz to 3 kHz (roll-off 48 dB/octave) and digitized at 12.2 kHz using an RA16 PA Medusa 16-channel preamplifier connected via fiber-optic cables to an RX5 data acquisition system (Tucker-Davis Technologies). LFPs time locked to the onset of the sounds were averaged on-line by computer to yield auditory evoked potentials (AEPs). CSD analyses characterized the laminar pattern of net current sources and sinks within A1 generating the AEPs, and were used to identify the laminar location of concurrently recorded AEPs and MUA. CSD was calculated using a three-point algorithm that approximates the second spatial derivative of voltage recorded at each recording contact (Freeman and Nicholson, 1975; Nicholson and Freeman, 1975).
To derive MUA, signals were simultaneously high-pass filtered at 500 Hz (roll-off 48 dB/octave), full-wave rectified, and then low-pass filtered at 520 Hz (roll-off 48 dB/octave) before digitization and averaging (for a methodological review, see Supèr and Roelfsema, 2005). MUA is a measure of the envelope of summed action potential activity of neuronal ensembles within a sphere estimated to be ∼100 μm in diameter (Vaughan and Arezzo, 1988; Brosch et al., 1997; Supèr and Roelfsema, 2005). Using an electrode impedance similar to that in the present study, MUA and single-unit recordings in primary visual cortex were shown to yield similar results with regard to orientation tuning (Supèr and Roelfsema, 2005). While MUA displays greater response stability than single-unit activity (Nelken et al., 1994; Stark and Abeles, 2007), details of activity occurring in single neurons are lost. As we were primarily interested in modeling the MMN, a population-level phenomenon, MUA is a suitable measure for fulfilling study objectives. MUA was also the primary measure of action potential activity used by Taaseh et al. (2011) in their study of SSA in rat auditory cortex.
Positioning of electrodes was guided by on-line examination of click-evoked AEPs. Pure tone stimuli were delivered when the electrode channels bracketed the inversion of early AEP components and when the largest MUA and initial current sink (see below) were situated in the middle channels. Evoked responses to 40 presentations of each pure tone stimulus were averaged with an analysis time of 500 ms (including a 100 ms prestimulus baseline interval). Following determination of the BF, oddball sequences were presented.
At the end of the recording period, monkeys were deeply anesthetized with sodium pentobarbital and transcardially perfused with 10% buffered formalin. Tissue was sectioned in the coronal plane (80 μm thickness) and stained for Nissl substance to reconstruct the electrode tracks and to identify A1 according to previously published physiological and histological criteria (Merzenich and Brugge, 1973; Morel et al., 1993; Kaas and Hackett, 1998). Based upon these criteria, all electrode penetrations considered in this report were localized to A1, though the possibility that some sites situated near the lower-frequency border of A1 were located in field R cannot be excluded.
General data analysis.
AEP analysis focused on three electrode channels located in lower lamina 3 (LL3), mid-upper lamina 3, and lamina 1/lamina 2, as physiologically identified by the location of the initial current sink in LL3 (LL3 sink), the slightly later supragranular sink (SG sink), and the concurrent, more superficial, supragranular source (SG source), respectively, within the CSD profile. These CSD components were routinely observed in the present study and in previous recordings from A1 in awake macaques (Steinschneider et al., 1994; Fishman and Steinschneider, 2006). The AEP in an additional channel located 600 μm below the LL3 sink within infragranular layer 5 (IG) was also examined to evaluate whether difference waveforms (described below) inverted in polarity over the extent of the cortex sampled by the multicontact electrode. The rationale for examining AEPs at these cortical depths was to ascertain the laminar origins of differences in AEPs evoked under the standard and oddball stimulus conditions. The SG source AEP selected for analysis was recorded in the channel immediately above that corresponding to the location of the SG source in the CSD profile. AEPs recorded at this laminar location are likely to dominate volume-conducted activity seen at the cortical surface (Steinschneider et al., 1994; Yvert et al., 2005; Fishman and Steinschneider, 2010) and may therefore contribute to the MMN recorded from the scalp in humans (Giard et al., 1990; Näätänen and Alho, 1995; Jemel et al., 2002). Finally, to obtain an index of the overall net extracellular current flow within a “cortical column” sampled by the multicontact electrode, the CSD in each electrode channel was rectified and then averaged across channels [i.e., the average rectified CSD (AVREC)] (Mehta et al., 2000).
MUA was derived primarily from the spiking activity of neural ensembles recorded within LL3, as identified by the presence of large-amplitude initial current sinks that are balanced by concurrent superficial sources in upper lamina 3 (Steinschneider et al., 1992; Fishman et al., 2001). Previous studies have localized the initial sinks to thalamorecipient zone layers of A1 (Müller-Preuss and Mitzdorf, 1984; Steinschneider et al., 1992; Sukov and Barth, 1998; Metherate and Cruikshank, 1999). MUA recorded from two superficial electrode channels immediately above the channel located in LL3 (a 300 μm extent) was analyzed separately to examine whether SSA or deviance-related neural activity was reflected also within more supragranular portions of lamina 3. These two supragranular channels are referred to as SG1 and SG2, respectively.
The BF of each cortical site was defined as the pure tone frequency eliciting the maximal MUA within a time window of 10–75 ms post-stimulus onset (Fishman and Steinschneider, 2009). MUA occurring in the two adjacent electrode channels located above the initial current sink displayed a BF that was within a quarter-octave of the BF based on MUA recorded in LL3.
Induced gamma band activity.
In addition to auditory evoked responses, induced (non-phase-locked) activity in the gamma frequency range was examined. Gamma band activity (GBA) is thought to contribute to short-term memory processes (Tallon-Baudry et al., 1998) similar to MMN, and increases in GBA elicited by deviant stimuli have been reported in studies using the oddball paradigm (Gurtubay et al., 2001; Kaiser et al., 2002; Lee et al., 2007). Induced GBA was extracted from EEG signals time locked to the onset of tones using previously described methods (Steinschneider et al., 2008). Briefly, single-trial EEG signals were first bandpass filtered within a given frequency range (FIR filters implemented in MATLAB; attenuation 96 dB/octave). The AEP was then subtracted from each filtered single-trial epoch to remove the phase-locked (evoked) components of the EEG (Crone et al., 2001). The resultant waveforms were then squared to yield power and averaged across trials. GBA was examined within three frequency ranges: gamma (30–70 Hz), high-gamma (70–130 Hz), and very-high-gamma (130–210 Hz).
Analysis of responses to oddball sequences.
SSA was evaluated by subtracting the response to a tone when it occurred as a standard from the response to the same tone when it occurred as a deviant. Responses to BF and non-BF tones were analyzed separately. Consistent with SSA, we predicted that responses to deviants would be larger than responses to standards (Ulanovsky et al., 2003). We further hypothesized that if responses contained a homolog of the MMN, activity elicited by deviants would not only be larger than that elicited by standards, but that difference waveforms would display additional, longer-latency response components not present in the response to the standards. These additional response components would potentially represent violations of the presumed sensory memory traces established by the standards, and therefore reflect genuine deviance detection.
Analysis of responses to “many standards” control sequences.
By itself, a larger response to deviants in the frequency oddball paradigm cannot differentiate between SSA and genuine deviance detection. To distinguish between these two interpretations, we compared the difference waveforms obtained in the oddball condition with difference waveforms obtained in a many standards control condition (Ulanovsky et al., 2003; Maess et al., 2007; Farley et al., 2010). The many standards control condition consisted simply of the pseudorandomly presented tones that were used to derive the FRF at each site (Fig. 1C). Each tone is infrequently presented with equal probability against a background of standard tones of varying frequency. Hence, no repeating background pattern is established relative to which a given tone is perceptually distinguishable as a deviant. Difference waveforms under the many standards condition were obtained by subtracting the response to standard tones presented in the oddball condition from the response to the same tone in the many standards condition. Hence, if larger responses to deviant stimuli in the oddball condition reflect genuine deviance detection, then difference waveforms should be significantly different from zero only in the oddball condition, and not when the same tone is presented in the context of many standards of varying frequency. On the other hand, if the comparatively larger responses to deviants in the oddball condition simply reflect SSA rather than genuine deviance detection, then it should be possible to mimic these larger responses in the many standards control condition.
Differences between conditions across sites were evaluated by paired t tests performed at each time point in the AEP, CSD, and MUA waveforms. Differences yielding p values <0.01 were considered statistically significant. No correction for multiple comparisons was made. However, as the results will show, nearly all statistically significant differences are clustered closely together in time and align with the latency of obligatory response components, thus indicating that prominent differences between responses evoked under the various stimulus conditions are genuine and not simply statistical fluctuations.
Results
Results are based on neural responses recorded in 30 electrode penetrations into A1 of two monkeys. All sites displayed sharp frequency tuning characteristic of small neural populations in A1 (Fishman and Steinschneider, 2009). Mean onset latency and mean 6 dB bandwidths of FRFs of MUA recorded in lower lamina 3 evoked by tones presented at 60 dB SPL were ∼14 ms and ∼0.6 octaves, respectively. These values are comparable to those reported for single neurons in A1 of awake monkeys (Recanzone et al., 2000). BFs of recording sites ranged from 175 to 13,000 Hz. The difference in frequency between BF and non-BF tones used in the oddball sequences is plotted as a percentage and function of BF in Figure 2. The frequency of the non-BF tone was chosen such that it produced a response that was ∼50% that of the response to the BF tone. Most of these non-BF tones had frequencies lower than the BF. On average, the non-BF tone differed from the BF tone by 20% (∼0.3 octaves), a value within the range of standard–deviant frequency separations used in previous SSA and MMN studies (Korzyukov et al., 1999; Kropotov et al., 2000; Ulanovsky et al., 2003; Szymanski et al., 2009).
Figure 2.

Distribution of BFs of A1 sites examined in the study and the standard–deviant frequency separations tested at each site. Frequency separation is expressed as a percentage of BF.
Laminar profiles of AEP, CSD, and MUA evoked by standard and deviant BF tones at a representative site are shown in Figure 3 (black: standard response; red: deviant response). The AEP recorded in superficial layers displays a series of positive and negative deflections that invert in polarity across middle laminae. The corresponding CSD profile displays initial current sinks in lamina 4 and LL3, the latter balanced by more superficial sources in middle lamina 3. A slightly later current sink in more supragranular portions of lamina 3 (SG sink) is balanced by more superficial current sources (SG source). These two current dipole configurations are characteristic features of sound-evoked activity in A1 (Steinschneider et al., 1994; Fishman et al., 2001; Lakatos et al., 2007) and are consistent with sequential synaptic activation of pyramidal neuron populations located in thalamorecipient and supragranular layers of A1 (Steinschneider et al., 1992; Metherate and Cruikshank, 1999). Maximal MUA occurs in middle cortical laminae. Differences between responses to deviants and standards are observed for all three response measures, with deviants eliciting greater MUA than standards and larger AEPs and corresponding current sources and sinks.
Figure 3.

Representative example of laminar response profiles elicited in A1 by standard and deviant tones in the oddball paradigm. Responses to the BF tone (950 Hz) when presented as a standard and as a deviant are plotted in black and red, respectively. Frequency of the non-BF tone was 600 Hz (ΔF = 37%). AEPs (left column) and MUA (right column) are recorded by a multicontact electrode, which samples activity at 16 laminar depths simultaneously (left; intercontact spacing: 150 μm). Approximate laminar boundaries are indicated on the right of the figure. One-dimensional CSD profiles (center column) are derived from the AEP profiles. Duration of stimuli (200 ms) is represented by the green horizontal bars above the time axes. CSD response components examined in the study are labeled. AEPs were analyzed at corresponding depths. Analysis of MUA focused on activity within LL3 and at two adjacent supragranular locations (SG1 and SG2).
Similar differential responses to standards and deviants are observed when response waveforms are averaged across electrode penetrations (Fig. 4; black: standard response; red: deviant response; blue: control response; AEP, CSD, and MUA data are represented in the left, center, and right columns, respectively). Major deflections in the AEP recorded at superficial depths are indicated (P1, N1, P2, and N2), and their latencies are marked by the vertical dashed lines superimposed on the waveforms. The mean AEP recorded 600 μm below the LL3 sink in IG demonstrates inversion of components across the laminar extent of A1. Deviants evoke greater overall net extracellular current flow than standards, as quantified by rectifying and averaging CSD waveforms across electrode channels (AVREC). Furthermore, deviants evoke greater MUA than standards, both in LL3 and at more superficial depths (SG1 and SG2). Importantly, responses in the many standards control condition are also larger than responses to standards in the oddball condition for all three population measures and are comparable to responses to deviants in the oddball condition. With the exception of longer-latency differences in AEPs recorded in the most superficial channel within the 125–250 ms range, no MMN-like components are observed in responses to deviants that differ appreciably in latency from obligatory components evoked by standards. The similarity between deviant and control responses within the time range of the obligatory components suggests that the larger responses to deviants in the oddball condition do not reflect genuine deviance detection, but rather SSA, i.e., the diminished responses to the standards.
Figure 4.

Average AEP (left column), CSD (center column), and MUA (right column) elicited in A1 by BF tones in the oddball and many standards control conditions (n = 30 electrode penetrations). Stimulus duration (200 ms) is represented by the horizontal green bars. Responses to the BF tone when it was presented as a standard and as a deviant in the oddball condition are plotted in black and red, respectively. Responses to the BF tone under the control condition are plotted in blue. Mean AEP and CSD waveforms at laminar depths corresponding to the LL3 sink, SG sink, and SG source are plotted in separate rows, as indicated. The mean AEP recorded 600 μm below the LL3 sink in IG is also included. The AVREC, quantifying total net extracellular current flow, is shown in the plot at the bottom of the center column. The MUA recorded in lower lamina 3 and in two adjacent supragranular channels are labeled LL3, SG1, and SG2, respectively. Major deflections in the superficial AEP are labeled (P1, N1, P2, and N2), and their peak latencies marked by dashed vertical lines superimposed on the waveforms. Peak latencies of major CSD components in the corresponding superficial CSD channel are also indicated by dashed vertical lines. Note different amplitudes of responses recorded at different depths, as indicated by the vertical calibration bars.
To statistically test this hypothesis, responses to standards were subtracted from responses to deviants of the same frequency in the oddball and control conditions to yield difference waveforms. Difference waveforms were then averaged across sites, and paired t tests were performed at each time point (null hypothesis of zero difference). Difference waveforms for BF and non-BF responses were analyzed separately. If the larger responses to deviants in the oddball condition reflect genuine deviance detection, rather than simply SSA, then difference waveforms in the oddball condition should differ considerably from difference waveforms in the many standards control condition.
For AEP, CSD, and MUA difference waveforms, BF and non-BF responses to deviants are significantly larger than responses to standards of the same frequency in the oddball condition (Figs. 5, 6, 7, respectively). Time points displaying statistically significant differences (p < 0.01, uncorrected) are indicated by the black vertical lines beneath the waveforms. Significant differences are observed both for early and longer-latency components of the AEP (Fig. 5). Deviants also elicit significantly larger early supragranular current dipoles (supragranular sink/source) than standards (Fig. 6). Significant differences are not reliably observed for initial current flow at the depth of the initial sink in LL3 and generally occur at longer latencies. Total net extracellular current flow elicited by deviants, as quantified by AVREC, is also significantly greater than that elicited by standards throughout the duration of the stimulus. Furthermore, deviants elicit significantly larger initial and sustained MUA than standards at all three depths examined (Fig. 7). While smaller, significant differences between deviant and standard responses elicited by non-BF tones are also observed for all three measures. Thus, responses to BF tones do not engage qualitatively different mechanisms than responses to tones that less optimally drive the neuronal population.
Figure 5.

Average AEP difference waveforms under the oddball and many standards control conditions. Average difference waveforms for AEPs elicited by BF and non-BF tones are shown in A and B, respectively (mean: blue curve; ±SEM: gray shading above and below mean). Difference waveforms under the oddball condition (left column of A and B) are obtained by subtracting AEPs elicited by standards from AEPs elicited by deviants. Difference waveforms under the many standards control condition (right column of A and B) are obtained by subtracting AEPs elicited by standards in the oddball condition from AEPs elicited by the same tones in the many standards control condition. Difference waveforms computed at different laminar depths are plotted in separate rows, as indicated. Time points displaying statistically significant differences (p < 0.01, uncorrected) are indicated by the black vertical lines beneath the waveforms. To indicate the temporal relationship between difference waveform components and obligatory components of the AEP, peak latencies of major deflections in the mean superficial AEP elicited by the same tones under the many standards control condition are indicated by the dashed vertical lines superimposed on the waveforms. Calibration: 5 μV.
Figure 6.

Average CSD difference waveforms under the oddball and many standards control conditions. Difference waveforms for responses elicited by BF and non-BF tones are shown in A and B, respectively. Same conventions as in Figure 5. To indicate the temporal relationship between difference waveform components and obligatory components of the CSD, peak latencies of major deflections in the mean superficial CSD elicited by the same tones under the many standards control condition are indicated by the dashed vertical lines superimposed on the waveforms. Calibration: 0.1 mV/mm2 (except where indicated otherwise).
Figure 7.

Average MUA difference waveforms under the oddball and many standards control conditions. Difference waveforms for responses elicited by BF and non-BF tones are shown in A and B, respectively. Same conventions as in Figure 5.
Importantly, for all response measures, difference waveforms obtained in the many standards control condition resemble those obtained in the oddball condition in both amplitude and morphology and tend to be statistically significant at similar latencies. Thus, responses to infrequent but non-deviant tones in the many standards control condition “mimic” the responses elicited by the same tones when they occur as deviants in the oddball condition.
The absence of significant differences in initial net current flow in LL3 between standard and deviant BF responses is illustrated in Figure 8, which shows mean and corresponding difference waveforms from Figures 4, 6, and 7 plotted on a magnified time scale. Onset of significant differences in MUA and net current flow occurs several milliseconds after the peak latency of the initial sink in LL3, as indicated by the dashed vertical line. Similar results were obtained for non-BF responses (data not shown).
Figure 8.

Expanded view of mean MUA and CSD elicited by BF tones in the oddball and many standards control conditions (left column). Corresponding mean difference waveforms under the oddball condition (deviant minus standard responses) are shown in the right column. Same conventions as in Figures 4, 6, and 7. Tone onset occurs at 0 ms. Note the absence of significant differences at the peak latency of the initial current sink in LL3, indicated by the dashed vertical line.
To examine whether genuine deviance detection might be reflected in induced activity in higher-frequency bands of the EEG, we performed a similar analysis of difference waveforms based on single-trial EEG bandpass filtered in the gamma (30–70 Hz), high-gamma (70–130 Hz), and very-high-gamma (130–210 Hz) band ranges. Difference waveforms for induced gamma power are not significantly different from zero, both in the oddball and many standards control conditions (data not shown). However, deviants induce significantly greater power than standards in the high-gamma (Fig. 9) and very-high-gamma range (data not shown). Similar to results obtained for evoked activity, difference waveforms for induced high- and very-high-gamma band power in the many standards control condition are comparable to those in the oddball condition.
Figure 9.

Average difference waveforms for induced high-gamma band (70–130 Hz) activity under the oddball and many standards control conditions. Difference waveforms for responses elicited by BF and non-BF tones are shown in A and B, respectively. Same conventions as in Figure 5. Calibration: 20 μV2.
Discussion
The present study aimed to identify potential neural homologs of the MMN in A1 of awake macaques using a classic frequency oddball paradigm. Our approach is translationally relevant in its use of neural population measures (AEP, MUA, and CSD) in an Old World primate whose primary auditory cortical anatomy and physiology are comparable to those of humans (Galaburda and Pandya, 1983; Steinschneider et al., 1998, 2005; Kaas and Hackett, 2000; Fishman et al., 2001; Brugge et al., 2009; Fishman and Steinschneider, 2010). While neural correlates of MMN have been previously investigated in awake monkeys using an intensity oddball paradigm and similar methods (Javitt et al., 1994), this is the first study in awake monkeys using a frequency oddball paradigm commonly tested in human studies of MMN.
In agreement with previous results in animal models (Javitt et al., 1994; Ulanovsky et al., 2003; Szymanski et al., 2009; Farley et al., 2010), deviant tones evoked significantly larger responses than standard tones. Furthermore, deviants elicited greater induced high- and very-high gamma band activity than standards. However, the larger deviant responses observed in the oddball paradigm could simply be due to SSA, the attenuated responses to the repeating standards, rather than to deviance or novelty detection processes per se. To examine this possibility, we compared responses obtained in the oddball condition with those obtained in a many standards control condition, wherein the same tones evaluated in the oddball context were presented rarely, but were not perceptually distinguishable as deviants.
We found that responses to tones in the many standards control condition were comparable to responses elicited by the same tones when presented as deviants in the oddball condition. These observations strongly suggest that the enhanced responses to deviants relative to standards observed in the oddball condition reflect SSA rather than genuine deviance detection processes in macaque A1. Our results and interpretation are consistent with those of Farley et al. (2010), who examined SSA and novelty detection in rat auditory cortex using similar oddball and control conditions. Importantly, deflections in AEP difference waveforms elicited in the oddball condition are not “novel” components, but simply represent the modulation of obligatory components, e.g., putative monkey homologs of the human P1, N1, and P2. These findings parallel those of ERP studies in humans, which suggest that larger deviant responses reflect SSA of obligatory components elicited by standards (Jääskeläinen et al., 2004; Elangovan et al., 2005; May and Tiitinen, 2010) rather than sensory memory or novelty detection processes (Näätänen et al., 2005). Finally, induced high- and very-high-GBA elicited in the oddball and many standards control conditions were similar. Thus, non-phase-locked activity potentially related to sensory memory processes likely reflects SSA rather than deviance detection in A1. Taken together, homologs of the MMN, insofar as it is conceived as a distinct response component reflecting novelty detection, are not present in A1 when examined using a basic frequency oddball paradigm.
In addition to auditory cortex, SSA has been observed at subcortical levels of the auditory pathway, including the inferior colliculus (Malmierca et al., 2009) and the medial geniculate nucleus (Anderson et al., 2009; Antunes et al., 2010). Thus, SSA in A1 may be partly inherited from subcortical inputs rather than generated de novo at the cortex. SSA in these subcortical auditory nuclei is observed within the earliest onset responses (Anderson et al., 2009; Malmierca et al., 2009). Accordingly, these synchronized short-latency responses would be expected to produce enhanced initial synaptic activation within thalamocortical input layers of A1. However, prominent differences between deviant and standard responses are primarily observed for later cortical activity rather than for the initial current sink in LL3 (Fig. 8), suggesting that intracortical processing significantly amplifies SSA originating at subcortical levels (Szymanski et al., 2009).
Several differences between the oddball and many standards control conditions should be noted. In particular, the presentation probability of each tone in the many standards control condition (∼5%) was about half that of the deviants in the oddball condition (10%). Furthermore, the average frequency variation was greater in the many standards condition than in the oddball condition. Thus, responses to deviant tones in the control condition may have been less adapted, and therefore larger, than in the oddball condition. However, any tendency for larger responses owing to reduced adaptation would be partly counterbalanced by some of the tones comprising the control sequences being closer to the BF than the non-BF tone in the oddball sequences. This greater proximity to the BF would result in greater adaptation or forward suppression of the response to the BF tone (Brosch and Schreiner, 1997).
In any event, the discrepancies between the oddball and many standards control conditions are inconsequential with respect to distinguishing SSA from genuine deviance detection. Regardless of differences between these conditions, the fact that difference waveforms in the oddball condition can be mimicked using rare tones that are not perceptually distinguishable as deviants indicates that deviant responses in the oddball condition do not uniquely reflect genuine deviance detection. A similar many standards control condition comprised of tones presented with a probability of 5% was also tested by Ulanovsky et al. (2003) in their study of SSA in A1 of anesthetized cats. In contrast with the present results and those of Farley et al. (2010) in awake rats, Ulanovsky et al. (2003) found that responses to deviants in the oddball condition were significantly larger than responses to the same tones in the many standards condition, thus suggesting genuine deviance detection in cat A1. The reasons for the inconsistency in results are unclear, but may include species differences or the effects of anesthesia on intracortical processing.
While the most conservative interpretation of the present results is that the larger responses to frequency deviants simply reflect SSA of responses to the repeating standards, these findings do not rule out the possibility of genuine deviance detection in A1 (as suggested by the results of Ulanovsky et al., 2003). Similar to the present results and those of Farley et al. (2010), Taaseh et al. (2011) showed that responses in auditory cortex of anesthetized rats to deviants in the frequency oddball paradigm were comparable to those elicited by the same tones in a many standards control condition. However, observed responses to deviants in the oddball condition were larger than those predicted by computational models of SSA, which only considered adaptation within narrow frequency channels, thus suggesting on theoretical grounds the presence of genuine deviance detection in rat auditory cortex. There are several reasons to remain cautious in drawing this conclusion. First, long-range spectral interactions in A1, such as forward suppression (Brosch and Schreiner, 1997; Bartlett and Wang, 2005; Scholes et al., 2011), were not considered in these theoretical models, and the potential influence of these interactions in the many standards condition remains unclear. Second, responses to deviants presented within the oddball context were generally smaller than responses to deviants when presented alone at similar interstimulus intervals and were not qualitatively different from those elicited by the same tones in the many standards condition. Hence, similar to findings reported here, responses to deviants in the oddball condition could be mimicked by responses in the many standards condition. Thus, while deviants may be processed differently in oddball versus many standards contexts, responses to deviants lack the unique signature of deviance detection commonly attributed to the MMN.
It is important to emphasize that the present results do not preclude the general existence of genuine sensory memory processes in the brain, as thought to be reflected by the MMN in humans. The modest aim of this study was to search for potential homologs of the MMN in A1 of a non-human primate model. The MMN is a scalp-recorded ERP waveform with potential contributions from generators located in multiple cortical areas. Thus, the present findings are entirely consistent with deviance detection processes operating in other brain regions. Moreover, stimulus paradigms using more complex auditory patterns might reveal novel response components that cannot be easily explained by SSA in A1 and that support a sensory memory or predictive coding interpretation of the MMN (Sussman et al., 1998; Wacongne et al., 2012). Nonetheless, SSA in A1 may provide a substrate for deviance detection processes in non-primary auditory cortical areas or in other brain regions such as frontal cortex (Näätänen and Alho, 1995; Jemel et al., 2002; Opitz et al., 2002; Doeller et al., 2003). Potentially, adaptation of responses to the repeating standards in A1 could enhance the salience of deviant responses, thus allowing deviance detection mechanisms operating in other cortical areas to distinguish between common and rare sounds comprising the auditory input stream (Jääskeläinen et al., 2004; May and Tiitinen, 2010). Accordingly, studies in experimental animals and humans suggest that genuine deviance detection processes contributing to the MMN reside in nonprimary or auditory association cortex (Kropotov et al., 2000; Pincze et al., 2001, 2002; Opitz et al., 2005). Whether responses reflecting such processes are present in nonprimary auditory areas of the monkey remains to be explored.
Footnotes
This work was supported by NIH Grant DC00657. We are grateful to Jeannie Hutagalung and Kyoko Kamishima for invaluable assistance with animal training, surgery, and data collection; and to Dr. Steven Walkley for providing histological facilities. We also thank two anonymous reviewers for helpful comments on a previous version of the paper.
The authors declare no competing financial interests.
References
- Alho K. Cerebral generators of mismatch negativity (MMN) and its magnetic counterpart (MMNm) elicited by sound changes. Ear Hear. 1995;16:38–51. doi: 10.1097/00003446-199502000-00004. [DOI] [PubMed] [Google Scholar]
- Anderson LA, Christianson GB, Linden JF. Stimulus-specific adaptation occurs in the auditory thalamus. J Neurosci. 2009;29:7359–7363. doi: 10.1523/JNEUROSCI.0793-09.2009. [DOI] [PMC free article] [PubMed] [Google Scholar]
- Antunes FM, Nelken I, Covey E, Malmierca MS. Stimulus-specific adaptation in the auditory thalamus of the anesthetized rat. PLoS One. 2010;5:e14071. doi: 10.1371/journal.pone.0014071. [DOI] [PMC free article] [PubMed] [Google Scholar]
- Bartlett EL, Wang X. Long-lasting modulation by stimulus context in primate auditory cortex. J Neurophysiol. 2005;94:83–104. doi: 10.1152/jn.01124.2004. [DOI] [PubMed] [Google Scholar]
- Brosch M, Schreiner CE. Time course of forward masking tuning curves in cat primary auditory cortex. J Neurophysiol. 1997;77:923–943. doi: 10.1152/jn.1997.77.2.923. [DOI] [PubMed] [Google Scholar]
- Brosch M, Bauer R, Eckhorn R. Stimulus-dependent modulations of correlated high-frequency oscillations in cat visual cortex. Cereb Cortex. 1997;7:70–76. doi: 10.1093/cercor/7.1.70. [DOI] [PubMed] [Google Scholar]
- Brugge JF, Nourski KV, Oya H, Reale RA, Kawasaki H, Steinschneider M, Howard MA., 3rd Coding of repetitive transients by auditory cortex on Heschl's gyrus. J Neurophysiol. 2009;102:2358–2374. doi: 10.1152/jn.91346.2008. [DOI] [PMC free article] [PubMed] [Google Scholar]
- Crone NE, Boatman D, Gordon B, Hao L. Induced electrocorticographic gamma activity during auditory perception. Clin Neurophysiol. 2001;112:565–582. doi: 10.1016/s1388-2457(00)00545-9. [DOI] [PubMed] [Google Scholar]
- Doeller CF, Opitz B, Mecklinger A, Krick C, Reith W, Schröger E. Prefrontal cortex involvement in preattentive auditory deviance detection: neuroimaging and electrophysiological evidence. Neuroimage. 2003;20:1270–1282. doi: 10.1016/S1053-8119(03)00389-6. [DOI] [PubMed] [Google Scholar]
- Elangovan S, Cranfordt JL, Walker L, Stuart A. A comparison of the mismatch negativity and a differential waveform response. Int J Audiol. 2005;44:637–646. doi: 10.1080/00222930500271564. [DOI] [PubMed] [Google Scholar]
- Farley BJ, Quirk MC, Doherty JJ, Christian EP. Stimulus-specific adaptation in auditory cortex is an NMDA-independent process distinct from the sensory novelty encoded by the mismatch negativity. J Neurosci. 2010;30:16475–16484. doi: 10.1523/JNEUROSCI.2793-10.2010. [DOI] [PMC free article] [PubMed] [Google Scholar]
- Fishman YI, Steinschneider M. Spectral resolution of monkey primary auditory cortex (A1) revealed with two-noise masking. J Neurophysiol. 2006;96:1105–1115. doi: 10.1152/jn.00124.2006. [DOI] [PubMed] [Google Scholar]
- Fishman YI, Steinschneider M. Temporally dynamic frequency tuning of population responses in monkey primary auditory cortex. Hear Res. 2009;254:64–76. doi: 10.1016/j.heares.2009.04.010. [DOI] [PMC free article] [PubMed] [Google Scholar]
- Fishman YI, Steinschneider M. Neural correlates of auditory scene analysis based on inharmonicity in monkey primary auditory cortex. J Neurosci. 2010;30:12480–12494. doi: 10.1523/JNEUROSCI.1780-10.2010. [DOI] [PMC free article] [PubMed] [Google Scholar]
- Fishman YI, Volkov IO, Noh MD, Garell PC, Bakken H, Arezzo JC, Howard MA, Steinschneider M. Consonance and dissonance of musical chords: neural correlates in auditory cortex of monkeys and humans. J Neurophysiol. 2001;86:2761–2788. doi: 10.1152/jn.2001.86.6.2761. [DOI] [PubMed] [Google Scholar]
- Freeman JA, Nicholson C. Experimental optimization of current source-density technique for anuran cerebellum. J Neurophysiol. 1975;38:369–382. doi: 10.1152/jn.1975.38.2.369. [DOI] [PubMed] [Google Scholar]
- Galaburda AM, Pandya DN. The intrinsic architectonic and connectional organization of the superior temporal region of the rhesus monkey. J Comp Neurol. 1983;221:169–184. doi: 10.1002/cne.902210206. [DOI] [PubMed] [Google Scholar]
- Giard MH, Perrin F, Pernier J, Bouchet P. Brain generators implicated in the processing of auditory stimulus deviance: a topographic event-related potential study. Psychophysiology. 1990;27:627–640. doi: 10.1111/j.1469-8986.1990.tb03184.x. [DOI] [PubMed] [Google Scholar]
- Gurtubay IG, Alegre M, Labarga A, Malanda A, Iriarte J, Artieda J. Gamma band activity in an auditory oddball paradigm studied with the wavelet transform. Clin Neurophysiol. 2001;112:1219–1228. doi: 10.1016/s1388-2457(01)00557-0. [DOI] [PubMed] [Google Scholar]
- Jääskeläinen IP, Ahveninen J, Bonmassar G, Dale AM, Ilmoniemi RJ, Levänen S, Lin FH, May P, Melcher J, Stufflebeam S, Tiitinen H, Belliveau JW. Human posterior auditory cortex gates novel sounds to consciousness. Proc Natl Acad Sci U S A. 2004;101:6809–6814. doi: 10.1073/pnas.0303760101. [DOI] [PMC free article] [PubMed] [Google Scholar]
- Javitt DC, Schroeder CE, Steinschneider M, Arezzo JC, Vaughan HG., Jr Demonstration of mismatch negativity in the monkey. Electroencephalogr Clin Neurophysiol. 1992;83:87–90. doi: 10.1016/0013-4694(92)90137-7. [DOI] [PubMed] [Google Scholar]
- Javitt DC, Steinschneider M, Schroeder CE, Vaughan HG, Jr, Arezzo JC. Detection of stimulus deviance within primate primary auditory cortex: intracortical mechanisms of mismatch negativity (MMN) generation. Brain Res. 1994;667:192–200. doi: 10.1016/0006-8993(94)91496-6. [DOI] [PubMed] [Google Scholar]
- Jemel B, Achenbach C, Müller BW, Röpcke B, Oades RD. Mismatch negativity results from bilateral asymmetric dipole sources in the frontal and temporal lobes. Brain Topogr. 2002;15:13–27. doi: 10.1023/a:1019944805499. [DOI] [PubMed] [Google Scholar]
- Kaas JH, Hackett TA. Subdivisions of auditory cortex and levels of processing in primates. Audiol Neurootol. 1998;3:73–85. doi: 10.1159/000013783. [DOI] [PubMed] [Google Scholar]
- Kaas JH, Hackett TA. Subdivisions of auditory cortex and processing streams in primates. Proc Natl Acad Sci U S A. 2000;97:11793–11799. doi: 10.1073/pnas.97.22.11793. [DOI] [PMC free article] [PubMed] [Google Scholar]
- Kaiser J, Lutzenberger W, Ackermann H, Birbaumer N. Dynamics of gamma-band activity induced by auditory pattern changes in humans. Cereb Cortex. 2002;12:212–221. doi: 10.1093/cercor/12.2.212. [DOI] [PubMed] [Google Scholar]
- Korzyukov O, Alho K, Kujala A, Gumenyuk V, Ilmoniemi RJ, Virtanen J, Kropotov J, Näätänen R. Electromagnetic responses of the human auditory cortex generated by sensory-memory based processing of tone-frequency changes. Neurosci Lett. 1999;276:169–172. doi: 10.1016/s0304-3940(99)00807-1. [DOI] [PubMed] [Google Scholar]
- Kropotov JD, Alho K, Näätänen R, Ponomarev VA, Kropotova OV, Anichkov AD, Nechaev VB. Human auditory-cortex mechanisms of preattentive sound discrimination. Neurosci Lett. 2000;280:87–90. doi: 10.1016/s0304-3940(00)00765-5. [DOI] [PubMed] [Google Scholar]
- Lakatos P, Chen CM, O'Connell MN, Mills A, Schroeder CE. Neuronal oscillations and multisensory interaction in primary auditory cortex. Neuron. 2007;53:279–292. doi: 10.1016/j.neuron.2006.12.011. [DOI] [PMC free article] [PubMed] [Google Scholar]
- Lee B, Park KS, Kang DH, Kang KW, Kim YY, Kwon JS. Generators of the gamma-band activities in response to rare and novel stimuli during the auditory oddball paradigm. Neurosci Lett. 2007;413:210–215. doi: 10.1016/j.neulet.2006.11.066. [DOI] [PubMed] [Google Scholar]
- Maess B, Jacobsen T, Schröger E, Friederici AD. Localizing pre-attentive auditory memory-based comparison: magnetic mismatch negativity to pitch change. Neuroimage. 2007;37:561–571. doi: 10.1016/j.neuroimage.2007.05.040. [DOI] [PubMed] [Google Scholar]
- Malmierca MS, Cristaudo S, Pérez-González D, Covey E. Stimulus-specific adaptation in the inferior colliculus of the anesthetized rat. J Neurosci. 2009;29:5483–5493. doi: 10.1523/JNEUROSCI.4153-08.2009. [DOI] [PMC free article] [PubMed] [Google Scholar]
- May PJ, Tiitinen H. Mismatch negativity (MMN), the deviance-elicited auditory deflection, explained. Psychophysiology. 2010;47:66–122. doi: 10.1111/j.1469-8986.2009.00856.x. [DOI] [PubMed] [Google Scholar]
- Mehta AD, Ulbert I, Schroeder CE. Intermodal selective attention in monkeys. I: distribution and timing of effects across visual areas. Cereb Cortex. 2000;10:343–358. doi: 10.1093/cercor/10.4.343. [DOI] [PubMed] [Google Scholar]
- Merzenich MM, Brugge JF. Representation of the cochlear partition of the superior temporal plane of the macaque monkey. Brain Res. 1973;50:275–296. doi: 10.1016/0006-8993(73)90731-2. [DOI] [PubMed] [Google Scholar]
- Metherate R, Cruikshank SJ. Thalamocortical inputs trigger a propagating envelope of gamma-band activity in auditory cortex in vitro. Exp Brain Res. 1999;126:160–174. doi: 10.1007/s002210050726. [DOI] [PubMed] [Google Scholar]
- Morel A, Garraghty PE, Kaas JH. Tonotopic organization, architectonic fields, and connections of auditory cortex in macaque monkeys. J Comp Neurol. 1993;335:437–459. doi: 10.1002/cne.903350312. [DOI] [PubMed] [Google Scholar]
- Müller-Preuss P, Mitzdorf U. Functional anatomy of the inferior colliculus and the auditory cortex: current source density analyses of click-evoked potentials. Hear Res. 1984;16:133–142. doi: 10.1016/0378-5955(84)90003-0. [DOI] [PubMed] [Google Scholar]
- Näätänen R, Alho K. Generators of electrical and magnetic mismatch responses in humans. Brain Topogr. 1995;7:315–320. doi: 10.1007/BF01195257. [DOI] [PubMed] [Google Scholar]
- Näätänen R, Escera C. Mismatch negativity: clinical and other applications. Audiol Neurootol. 2000;5:105–110. doi: 10.1159/000013874. [DOI] [PubMed] [Google Scholar]
- Näätänen R, Jacobsen T, Winkler I. Memory-based or afferent processes in mismatch negativity (MMN): a review of the evidence. Psychophysiology. 2005;42:25–32. doi: 10.1111/j.1469-8986.2005.00256.x. [DOI] [PubMed] [Google Scholar]
- Näätänen R, Paavilainen P, Rinne T, Alho K. The mismatch negativity (MMN) in basic research of central auditory processing: a review. Clin Neurophysiol. 2007;118:2544–2590. doi: 10.1016/j.clinph.2007.04.026. [DOI] [PubMed] [Google Scholar]
- Nelken I, Ulanovsky N. Mismatch negativity and stimulus-specific adaptation in animal models. J Psychophysiol. 2007;21:214–223. [Google Scholar]
- Nelken I, Prut Y, Vaadia E, Abeles M. Population responses to multifrequency sounds in the cat auditory cortex: one- and two-parameter families of sounds. Hear Res. 1994;72:206–222. doi: 10.1016/0378-5955(94)90220-8. [DOI] [PubMed] [Google Scholar]
- Nicholson C, Freeman JA. Theory of current source-density analysis and determination of conductivity tensor for anuran cerebellum. J Neurophysiol. 1975;38:356–368. doi: 10.1152/jn.1975.38.2.356. [DOI] [PubMed] [Google Scholar]
- Opitz B, Rinne T, Mecklinger A, von Cramon DY, Schröger E. Differential contribution of frontal and temporal cortices to auditory change detection: fMRI and ERP results. Neuroimage. 2002;15:167–174. doi: 10.1006/nimg.2001.0970. [DOI] [PubMed] [Google Scholar]
- Opitz B, Schröger E, von Cramon DY. Sensory and cognitive mechanisms for preattentive change detection in auditory cortex. Eur J Neurosci. 2005;21:531–535. doi: 10.1111/j.1460-9568.2005.03839.x. [DOI] [PubMed] [Google Scholar]
- Pincze Z, Lakatos P, Rajkai C, Ulbert I, Karmos G. Separation of mismatch negativity and the N1 wave in the auditory cortex of the cat: a topographic study. Clin Neurophysiol. 2001;112:778–784. doi: 10.1016/s1388-2457(01)00509-0. [DOI] [PubMed] [Google Scholar]
- Pincze Z, Lakatos P, Rajkai C, Ulbert I, Karmos G. Effect of deviant probability and interstimulus/interdeviant interval on the auditory N1 and mismatch negativity in the cat auditory cortex. Brain Res Cogn Brain Res. 2002;13:249–253. doi: 10.1016/s0926-6410(01)00105-7. [DOI] [PubMed] [Google Scholar]
- Recanzone GH, Guard DC, Phan ML. Frequency and intensity response properties of single neurons in the auditory cortex of the behaving macaque monkey. J Neurophysiol. 2000;83:2315–2331. doi: 10.1152/jn.2000.83.4.2315. [DOI] [PubMed] [Google Scholar]
- Sato Y, Yabe H, Hiruma T, Sutoh T, Shinozaki N, Nashida T, Kaneko S. The effect of deviant stimulus probability on the human mismatch process. Neuroreport. 2000;11:3703–3708. doi: 10.1097/00001756-200011270-00023. [DOI] [PubMed] [Google Scholar]
- Scholes C, Palmer AR, Sumner CJ. Forward suppression in the auditory cortex is frequency-specific. Eur J Neurosci. 2011;33:1240–1251. doi: 10.1111/j.1460-9568.2010.07568.x. [DOI] [PMC free article] [PubMed] [Google Scholar]
- Stark E, Abeles M. Predicting movement from multiunit activity. J Neurosci. 2007;27:8387–8394. doi: 10.1523/JNEUROSCI.1321-07.2007. [DOI] [PMC free article] [PubMed] [Google Scholar]
- Steinschneider M, Tenke CE, Schroeder CE, Javitt DC, Simpson GV, Arezzo JC, Vaughan HG., Jr Cellular generators of the cortical auditory evoked potential initial component. Electroencephalogr Clin Neurophysiol. 1992;84:196–200. doi: 10.1016/0168-5597(92)90026-8. [DOI] [PubMed] [Google Scholar]
- Steinschneider M, Schroeder CE, Arezzo JC, Vaughan HG., Jr Speech-evoked activity in primary auditory cortex: effects of voice onset time. Electroencephalogr Clin Neurophysiol. 1994;92:30–43. doi: 10.1016/0168-5597(94)90005-1. [DOI] [PubMed] [Google Scholar]
- Steinschneider M, Reser DH, Fishman YI, Schroeder CE, Arezzo JC. Click train encoding in primary auditory cortex of the awake monkey: evidence for two mechanisms subserving pitch perception. J Acoust Soc Am. 1998;104:2935–2955. doi: 10.1121/1.423877. [DOI] [PubMed] [Google Scholar]
- Steinschneider M, Volkov IO, Fishman YI, Oya H, Arezzo JC, Howard MA., 3rd Intracortical responses in human and monkey primary auditory cortex support a temporal processing mechanism for encoding of the voice onset time phonetic parameter. Cereb Cortex. 2005;15:170–186. doi: 10.1093/cercor/bhh120. [DOI] [PubMed] [Google Scholar]
- Steinschneider M, Fishman YI, Arezzo JC. Spectrotemporal analysis of evoked and induced electroencephalographic responses in primary auditory cortex (A1) of the awake monkey. Cereb Cortex. 2008;18:610–625. doi: 10.1093/cercor/bhm094. [DOI] [PubMed] [Google Scholar]
- Sukov W, Barth DS. Three-dimensional analysis of spontaneous and thalamically evoked gamma oscillations in auditory cortex. J Neurophysiol. 1998;79:2875–2884. doi: 10.1152/jn.1998.79.6.2875. [DOI] [PubMed] [Google Scholar]
- Supèr H, Roelfsema PR. Chronic multiunit recordings in behaving animals: advantages and limitations. Prog Brain Res. 2005;147:263–282. doi: 10.1016/S0079-6123(04)47020-4. [DOI] [PubMed] [Google Scholar]
- Sussman E, Ritter W, Vaughan HG., Jr Predictability of stimulus deviance and the mismatch negativity. Neuroreport. 1998;9:4167–4170. doi: 10.1097/00001756-199812210-00031. [DOI] [PubMed] [Google Scholar]
- Szymanski FD, Garcia-Lazaro JA, Schnupp JW. Current source density profiles of stimulus-specific adaptation in rat auditory cortex. J Neurophysiol. 2009;102:1483–1490. doi: 10.1152/jn.00240.2009. [DOI] [PubMed] [Google Scholar]
- Taaseh N, Yaron A, Nelken I. Stimulus-specific adaptation and deviance detection in the rat auditory cortex. PLoS One. 2011;6:e23369. doi: 10.1371/journal.pone.0023369. [DOI] [PMC free article] [PubMed] [Google Scholar]
- Tallon-Baudry C, Bertrand O, Peronnet F, Pernier J. Induced gamma-band activity during the delay of a visual short-term memory task in humans. J Neurosci. 1998;18:4244–4254. doi: 10.1523/JNEUROSCI.18-11-04244.1998. [DOI] [PMC free article] [PubMed] [Google Scholar]
- Ulanovsky N, Las L, Nelken I. Processing of low-probability sounds by cortical neurons. Nat Neurosci. 2003;6:391–398. doi: 10.1038/nn1032. [DOI] [PubMed] [Google Scholar]
- Vaughan HG, Jr, Arezzo JC. The neural basis of event-related potentials. In: Picton TW, editor. Human event-related potentials, EEG handbook, revised series. Vol 3. New York: Elsevier; 1988. pp. 45–96. [Google Scholar]
- Wacongne C, Changeux JP, Dehaene S. A neuronal model of predictive coding accounting for the mismatch negativity. J Neurosci. 2012;32:3665–3678. doi: 10.1523/JNEUROSCI.5003-11.2012. [DOI] [PMC free article] [PubMed] [Google Scholar]
- Yvert B, Fischer C, Bertrand O, Pernier J. Localization of human supratemporal auditory areas from intracerebral auditory evoked potentials using distributed source models. Neuroimage. 2005;28:140–153. doi: 10.1016/j.neuroimage.2005.05.056. [DOI] [PubMed] [Google Scholar]