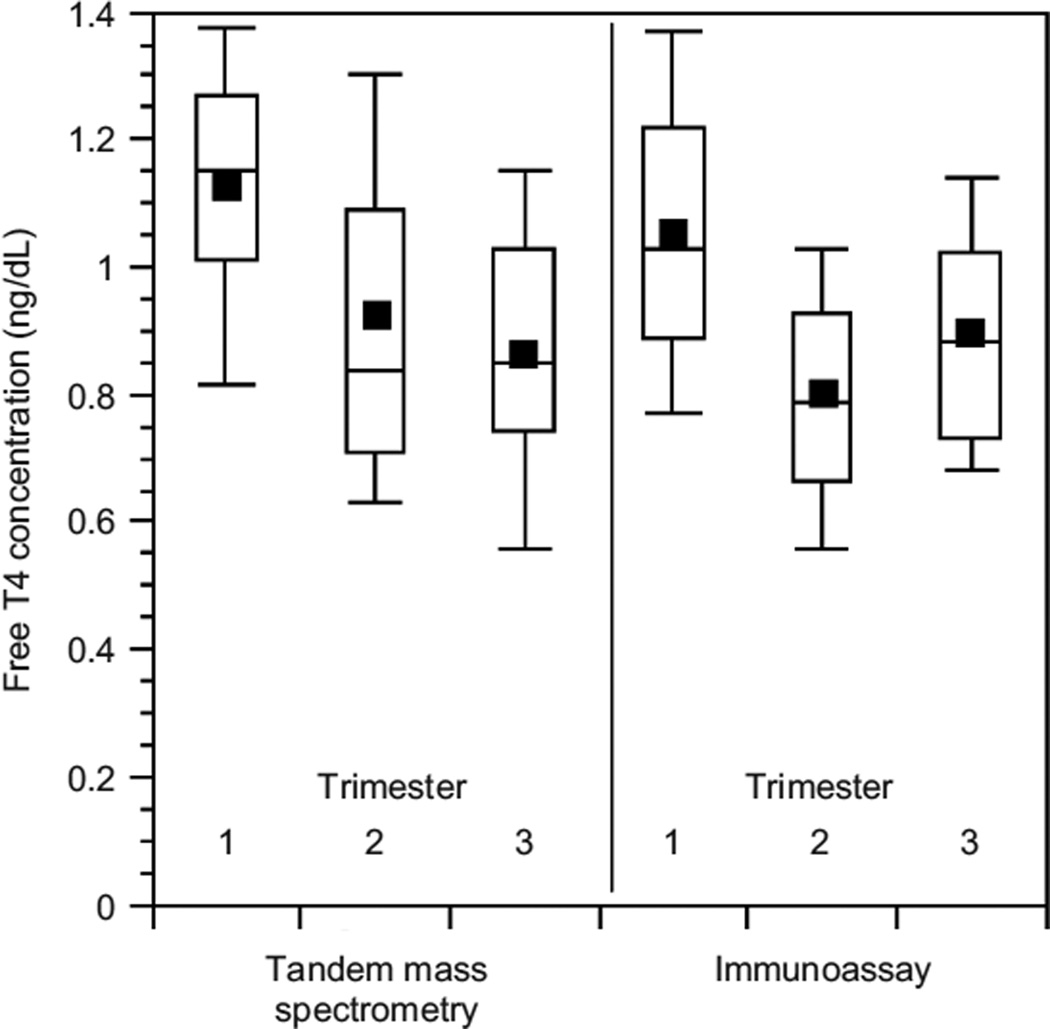
FIG. 1.
Box plot representation of the descriptive statistics for free thyroxine (FT4); measured by isotope dilution liquid chromatography tandem mass spectrometry (LC/MS/MS) (the square depicts the mean, the line shows the median, the top and bottom of the box represent the 75% and 25% percentile respectively, and the whiskers show the 90th and 10th percentile).

