

Abstract
A dimeric neomycin-neomycin conjugate 3 with a flexible linker, 2,2’-(Ethylenedioxy)bis(ethylamine), has been synthesized and characterized. Dimer 3 can selectively bind to AT rich DNA duplexes with high affinity. Biophysical studies have been performed between 3 and different nucleic acids with varying base composition and conformation by using ITC (Isothermal Calorimetry), CD (Circular Dichroism), FID (Fluorescent Intercalator Displacement), and UV (Ultra-Violet) thermal denaturation experiments. A few conclusions can be drawn from this study: (1) FID assay with 3 and polynucleotides demonstrates the preference of 3 towards AT rich sequences over GC-rich sequences. (2) FID assay and UV thermal denaturation experiments show that 3 has a higher affinity for the poly(dA).poly(dT) DNA duplex than the poly(dA).2poly(dT) DNA triplex. Contrary to neomycin, 3 destabilizes poly(dA).2poly(dT) triplex but stabilizes poly(dA).poly(dT) duplex, suggesting major groove as the binding site. (3) UV thermal denaturation studies and ITC experiments show that 3 stabilizes continuous AT-tract DNA better than DNA duplexes with alternating AT bases. (4) CD and FID titration studies show a DNA binding site size of 10~12 base pairs/drug, depending upon the structure/sequence of the duplex for AT rich DNA duplexes. (5) FID and ITC titration between 3 and an intramolecular DNA duplex [d(5’-A12-x -T12-3’), × = hexaethylene glycol linker] result in a binding stoichiometry of 1:1 with a binding constant ~ 108 M-1 at 100 mM KCl. (6) FID assay using 3 and 512 hairpin DNA sequences that vary in their AT base content and placement also show a higher binding selectivity of 3 toward continuous AT rich than towards DNA duplexes with alternate AT base pairs. (7) Salt dependent studies indicate the formation of 3 ion pairs during binding of the DNA duplex d[5’-A12-x -T12-3’] and 3. (8) ITC-derived binding constants between 3 and DNA duplexes follow the order, AT continuous, d[5’-G3A5T5C3-3’] > AT alternate, d[5’-G3(AT)5C3-3’] > GC rich d[5’-A3G5C5T3-3’]. (9) 3 binds to AT tract containing DNA duplex (B* DNA, d[5’-G3A5T5C3-3’]) with an order of magnitude higher affinity than to a DNA duplex with alternating AT base pairs (B DNA, d[5’-G3(AT)5C3-3’]) and with almost three orders of magnitude higher affinity than a GC rich DNA (A form, d[5’-A3G5C5T3-3’]).
Introduction
Targeting nucleic acids by small molecules has been of longstanding interest to scientists due to the challenges inherent in macromolecular recognition and also because of the fundamental therapeutic potential of the exercise. Exploration of small molecules binding to duplex DNA has become an active research area as the complexes formed by small molecules and DNA can alter natural gene expression and consequently regulate cell growth.1, 2 The DNA-small molecule interactions are dictated by both covalent and non-covalent binding modes. A majority of the non-covalent DNA-small molecule binding interactions take place via two modes3: intercalation3, 4 and groove binding.1, 5, 6 The resulting DNA-drug complex is usually stabilized by non-covalent interactions, such as hydrogen bonds, van der Waals and electrostatic interactions. Considerable efforts have been invested to develop sequence-specific DNA binding ligands in the past several decades. Dervan and coworkers have developed polyamides7, 8 derived from natural product distamycin,9 which have expanded the list of sequence selective DNA binding ligands.10 Most DNA binding ligands are planar heterocycles that intercalate between the DNA bases or stack in the minor groove. However, non planar molecules that bind to DNA are virtually non-existent. Recognition of duplex DNA and other nucleic acids by carbohydrate-containing molecules has come to the forefront in recent years.11 A number of DNA binding agents with carbohydrate domains, such as bleomycin,12 rebeccamycin,13 gemtuzumab ozogamicin11, 14 and chromomycin15 have been studied. The role of the carbohydrate moiety in these DNA binders has been investigated and a recent investigation suggests that carbohydrate moieties appear responsible for drug targeting.16 A number of DNA binding natural products have been shown to contain carbohydrate binding domains.11 However, reports on DNA duplex binding ligands based solely on carbohydrate scaffolds are nonexistent. Previous studies reveal that polysaccharides with stereo- and spatial chemical constraints may have the potential to specifically recognize DNA sequences, although these studies also included planar moieties in the DNA binding domains.17-19 A dimeric calicheamicin containing a planar iodophenyl moeity showed a much higher affinity (Kd = 10-9 M) with TCCT tract(s)18 in a DNA duplex than the monomeric calicheamicin (Kd = 10-6 M).18, 19
Aminoglycosides are aminosugars linked through glycosidic linkages that bind to eubacterial RNA and have been effectively used as antibacterial antibiotics for almost 60 years.20, 21 Aminoglycosides have been known to target different structures of RNA such as 5’-untranslated region of thymidylate synthase mRNA,22 rev response element and the transactivating response element RNA motifs of HIV-1,23, 24 group I introns,25 ribonuclease P RNA,26 hairpin ribozyme27 and hammerhead ribozyme.28 We have previously reported that aminosugars can act as major groove binding scaffolds for DNA triplexes.29 These findings supplemented the various RNA binding properties of aminosugars.30-33 Our findings showed that neomycin (and other aminoglycosides) can stabilize DNA34-38 and RNA triplexes,29,35 DNA/RNA hybrid duplexes/triplexes,39, 40 poly (A)41 and even DNA quadruplex.42 The binding properties of aminoglycosides have been further expanded by conjugating them with intercalators,43 minor groove binders,44,45, 46 and with oligonucleotides,47-49 because neomycin also assists in lipid-mediated delivery of oligonucleotides.50 Neomycin fits better in the narrower A-form major groove51 but does not have a good shape and potential complementarity to the wider major groove of B-form DNA. The larger size of the B/B* form major groove prompted us to investigate dimeric aminoglycosides52, 53 that could show a better shape and potential complementarity to the major groove of B/B*-form DNA. B*-form DNA refers to AT rich DNA sequences that contain long A-tracts that lead to unusually narrow minor groove and high base –pair propeller twist.54 Herein, we report that a dimeric aminoglycoside with a flexible thioether linker has been synthesized52, 55 and shows a high binding affinity to duplex DNA. A neomycin-neomycin conjugate 3 has been synthesized by coupling neomycin amine 1 (2 equivalent) with 2,2’-(Ethylenedioxy)bis(ethylisothiocyanate) (Scheme 1). We report that dimer 3 binds long stretches of AT rich DNA double helices with remarkably high affinity. To the best of our knowledge, this report outlines the first example of an all carbohydrate pharmacophore that contains no planar moeities, yet binds to DNA duplexes with high affinities, and with structure and sequence-selectivity.
Scheme 1.
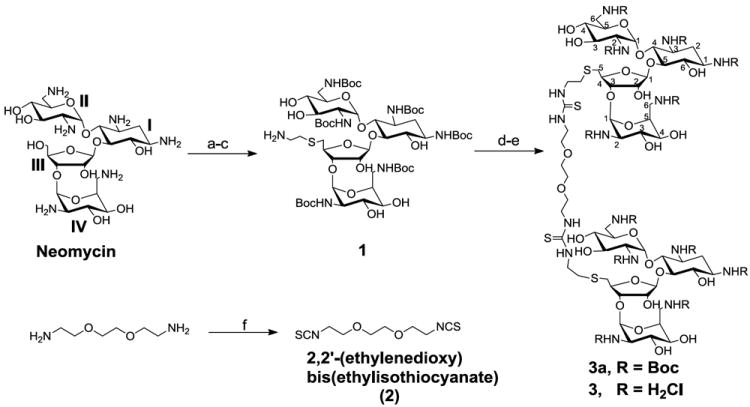
Reagents and conditions: a-e: (a) (Boc)2O, DMF, H2O, Et3N, 60°C, 5 h, 60%. (b) TPS-Cl, pyridine, r.t., 40 h, 50%. (c) HSCH2CH2NH2.HCl, EtOH, EtONa, r.t., 12h, 60%. (d) 2, pyridine, DMAP, r.t., 12 h, 95%. (e) 4 M HCl/dioxane, HSCH2CH2SH, r.t., 5 min, 73%. (f) TCDP, dry DCM, r.t., 4 h, 94%.
Experimental Procedures
Materials
All of the chemicals were purchased from commercial suppliers and used without further purification. Neomycin B tri-sulfate was purchased from MP Biomedicals (Solon, Ohio, USA). Di-tert-butyl dicarbonate (Boc anhydride) was purchased from Advanced ChemTech (Louisville, KY, USA). SC (Sodium Cacodylate), EDTA (Ethylenediamine Tetraacetic Acid), KCl, sodium phosphate (mono- and di-) salts were purchased from Fisher Scintific. 2,2’-(Ethylenedioxy)bis(ethylamine), DMAP (4-dimethyl-aminopyridine) were purchased from Acros organics. TCDP (1,1’-thiocarbonyldi-2(1H)-pyridone), TPS-Cl (2,4,6-triisopropylbenzenesulfonyl chloride), 4M HCl/dioxane were purchased from Sigma Aldrich. Silica gel for flash column chromatography was purchased from Sorbent Technologies (Atlanta, GA, USA) as silica gel standard grade (particle size = 40-63 μm). All solvents were purchased from VWR. Reaction solvents were distilled over calcium hydride [pyridine, DCM (dichloromethane)]. EtOH (ethanol) was first distilled with sodium metal and then redistilled over magnesium turnings. Reactions were carried out under N2 using dry solvent, unless otherwise noted.
Instrumentation
1H NMR spectra were collected on a Bruker 500 MHz FT-NMR spectrometer. MS (MALDI-TOF) spectra were collected using a Bruker Omniflex MALDI-TOF mass spectrometer. All UV spectra were recorded on a Cary 100 Bio UV/Vis spectrophotometer equipped with a thermoelectrically controlled 12-cell holder. Quartz cells with a 1 cm pathlength were used for all the absorbance studies. Spectrophotometer stability and λ alignment were checked prior to initiation of each melting point experiment. Isothermal titration calorimetric measurements were performed on a MicroCal VP-ITC (MicroCal, Inc. Northampton, MA). All CD experiments were conducted at 20 °C on a JASCO J-810 spectropolarimeter equipped with a thermoelectrically controlled cell holder. A quartz cell with a 1 cm pathlength was used in the CD studies. Fluorescence spectra were measured on a Photon Technology International instrument (Lawrenceville, New Jersey, USA). The fluorescence measurements of 96-well plates were carried out on a Genios Multi-Detection Microplate Reader, TECAN with Magellan software.
Nucleic Acids
Homopolynucleotides were purchased from GE Healthcare (New Jersey, USA). Native DNA’s were purchased from Sigma Aldrich. The concentrations of the polymer solutions were determined by UV spectroscopy, using the following molar extinction coefficients: ε265 = 9,000 M-1 cm-1 base-1 for poly(dT), ε260 = 6,000 M-1 cm-1 bp-1 for poly(dA).poly(dT), ε260 = 7,600 M-1 cm-1 bp-1 for poly(dA.dT),2 ε253 = 7,400 for poly(dG).poly(dC), ε260 = 12,824 M-1 cm-1 bp-1 for DNA from Calf thymus (42%, G+C bases), ε260 = 12,476 M-1 cm-1 bp-1 for DNA from Clostridium perfringens (31%, G+C bases), ε260 = 13,846 M-1 cm-1 bp-1 for DNA from Micrococcus lysodeikticus (72%, G+C bases). The 12-mer duplex d[5’-A12-x-T12-3’] oligonucleotide was synthesized on Applied Biosystem 8890 using standard phosphoramidite chemistry and purified by HPLC on a Gen-Pak FAX (4.6 × 100 mm) ion exchange column, eluting with buffer A (25 mM Tris•HCl, 1 mM EDTA, 10 % CH3CN, pH 8.0) from 98% to 50% and buffer B (25 mM Tris•HCl, 1 mM EDTA, 1 M NaClO4, 10 % CH3CN, pH 8.0) from 2% to 50% in 15 min.
The intramolecular triplex d[5’-A12-x-T12-x-T12-3’] was synthesized using an Expedite Nucleic Acid Synthesis System (8909) with standard phosphoramidite chemistry. The oligomer was purified on an anion exchange HPLC column (Water Gen-Pak FAX, 4.6 × 100 mm) with a Tris•HCl buffer system. buffer A: 25 mM Tris•HCl, 1 mM EDTA, and 10% MeCN (v/v%); buffer B: buffer A + 1 M NaCl. Conditions: 2–60% buffer B over buffer A during 0 – 16 min at a flow rate of 0.75 mL/min. Hairpin deoxyoligonucleotides were purchased from Eurofins MWG/Operon (Huntsville, Alabama, USA) as 50 μM/ strand solutions in 200 μL water and stored as stock solutions at -20 °C. All other oligonucleotides were purchased from IDT DNA (Coraville, IA, USA). The concentrations of all the oligonucleotides were determined by UV using the following extinction coefficients (in units of mol of nucleotide/L-1 cm-1): ε260 = 163,500 for d[5’-A8T8-3’], ε260 = 160,700 for d[5’-GA7T7C-3’], ε260 = 157,900 for d[5’-G2A6T6C2-3’], ε260 = 155,100 for d d[5’-G3A5T5C3-3’], ε260 = 152,300 for d [5’-G4A4T4C4-3’], ε260 = 147,300 for d [5’-G5A3T3C5-3’], ε260 = 145,000 for d[5’-G6A2T2C6-3’], ε260 =259,844 for d[5’-A12-x-T12-3’], ε260 =341,100 for d[5’-A12-x-T12-x-T12-3’], ε260 = 159,266 for d[5’-G3(AT)5C3-3’], ε260 = 159,266 for d[5’-GGGAATTAATTATCCC-3’], ε260 = 159,266 for d[5’-GGGATAATTAATTCCC-3’], ε260 = 176,968 for d[5’-GGGATAATAAAAACCC-3’], ε260 = 141,563 for d[5’-GGGTTTTTATTATCCC-3’], ε260 = 165,166 for d[5’-GGGATATATAAATCCC-3’], ε260 = 153,365 for d[5’-GGGATTTATATATCCC-3’], ε260 = 269,990 for d[5’-AAGGG(AT)12GGGAA-3’], ε260 = 178,970 for d[5’-TTCCC(TA)12CCCTT-3’], ε260 = 178,970 for d[5’-AAGAGGAGAGAAGAGAGGAGAA-3’], ε260 = 159,844 for d[3’-TTCTCCTCTCTTCTCTCCTCTT-5’], ε260 = 283,233 for d[5’-AAGGG(A)12GGGAA-3’], ε260 = 157,343 for d[5’-TTCCC(T)12CCCTT-3’]. The term rdb refers to molar ratio of drug to base pair.
UV Spectroscopy
The UV thermal denaturation samples (1 mL) were prepared by mixing DNA (1 μM/duplex for oligonucleotides, 15 μM/bp for polymer duplexes, or 15 μM/triplet for polymer triplexes) in 100 or 150 mM KCl, 10 mM SC, 0.5 mM EDTA, pH 6.8. In case of oligonucleotides, prior to UV thermal denaturation experiments, the samples were heated to 95 °C for 5 min and then slowly cooled down to room temperature and incubated at 4 °C for 16 h. In the polynucleotide experiments, the samples were heated to 95 °C followed by annealing to room temperature at a rate of 0.2 °C/min. The UV thermal denaturation spectra of the samples in 1 cm path length quartz cuvettes was recorded at 260, 280, and 284 nm as a function of temperature (10-95 °C, heating rate: 0.2 °C/min). First derivative plots were used to determine the dentauration temperature.
CD Spectropolarimetry
Small aliquots (0.6-5.0 μL) of a concentrated 3 solution (0.5 mM or 1 mM) were added to a solution (2 mL, 100 mM KCl, 10 mM SC, 0.5 mM EDTA, pH 6.8) of DNA [poly(dA).poly(dT) (50 μM/bp) or poly(dA.dT)2 (50 μM/bp) and 4 μM/duplex for oligonucleotide], inverted twice, and incubated for 5 min at 20 °C. The CD spectra were then recorded as an average of 3 scans from 200 to 350 nm and data recorded in 0.1 nm increments with an averaging time of two seconds.
Isothermal Titration Calorimetry (ITC)
In a typical experiment, an aliquot (9 μL) of 3 (125 μM in 100 mM KCl, 10 mM SC, 0.5 mM EDTA, pH 6.8) was injected at 25 °C into an isothermal sample chamber containing an oligonucleotide duplex solution (1.42 mL, 4 μM/duplex in 100 mM KCl, 10 mM SC, 0.5 mM EDTA, pH 6.8) via a 296 μL rotary syringe (300 rpm). The interval time between each injection was 300 s and the duration time of each injection was 10 s. The initial delay prior to the first injection was 60 s. Injection of 3 at the same concentration into a buffer solution at 25 °C was used as a blank. Each injection generated a heat burst curve (microcalories per second). The area under each heat burst curve was determined by integration using the Origin (version 5.0, MicroCal, Inc. Northampton, MA) software to obtain a measure of the heat associated with that injection. The heat associated with each drug-buffer injection was subtracted from the corresponding heat associated with each drug-DNA injection to yield the heat of drug binding for that injection. The final corrected injection heats were plotted as a function of molar ratio ([drug]/[DNA]) and fitted with one binding site model or with two independent binding site model.
Fluorescence Intercalator Displacement Assay (FID)
FID titrations for oligomeric DNA duplexes were carried out in a quartz cuvette. A thiazole orange (TO) solution (0.5 equivalent/basepair, 2 mL) in sodium cacodylate buffer (100 mM KCl, 10 mM SC, 0.5 mM EDTA, pH 6.8) was prepared and the fluorescence of this solution was measured (Ex: 504 nm and Em: 520-600 nm). An oligomeric duplex solution d[5’-A12-x-T12-3’], or d[5’-A30.T30-3’] was added into the TO solution to make a 1 μM/strand final concentration. The fluorescence of the mixture was measured again and normalized to 100% relative fluorescence. An aliquot of the stock solution of 3 (5 μM to 200 μM) was added into the mixture, and the fluorescence was measured after incubation for 5 min at 20 °C. The addition of 3 was continued until the fluorescence reached saturation. For all titrations, the final concentrations were corrected for dilution (less than 5% of the total volume).
FID assays for polymeric DNA were carried out in a 96-well plate. A solution containing polynucleotide (0.88 μM/bp) and TO was prepared by incubating the two for 30 min in buffer (100 mM KCl, 10 mM SC, 0.5 mM EDTA, pH 6.8) prior to the measurements. Each well of 96-well plate (flat bottom, black) was loaded with polynucleotide solution (200 μL). A small aliquot of the stock solution of 3 (5 μM to 200 μM) or neomycin (50 μM to 25 mM) was added into each well to make a desired concentration of 3 and the fluorescence was measured in triplicate after incubation for 5 min. Fluorescence readings are reported as percentage fluorescence relative to control wells. The reference fluorescence is defined as such: [TO+DNA] gives 100% fluorescence and [TO] only gives 0% fluorescence).
Ethidium bromide displacement titration for determining the apparent DNA binding site size
The binding stoichiometries of poly(dA).poly(dT) and poly(dA.dT)2 with 3 were determined by ethidium bromide displacement titration. A solution (100 mM KCl, 10 mM SC, 0.5 mM EDTA, pH 6.8) of the polymer [poly(dA).poly(dT) or poly(dA.dT)2, 10 μM/bp) saturated with EtBr (5 μM) was prepared. In a fluorescence quartz cuvette, small aliquots of the stock solution of 3 (100 μM to 1 mM) were added into the premixed DNA-EtBr solution (2 mL). The fluorescence was recorded after each addition until no more changes in fluorescence were observed. The percentage change of the fluorescence was then plotted against the ratio of drug to base pair.
Thiazole orange (TO) FID assay for 512-member deoxyoligonucleotide library
Prior to use, each hairpin deoxyoligonucleotides was diluted to 40 μM/strand in buffer (100 mM KCl, 10 mM SC, 0.5 mM EDTA, pH 6.8) and stored at 4 °C. Each well plate was heated to 95 °C for 5 min, slowly cooled down to r.t., and stored at 4 °C for 16 h. Each well of a 96-well plate (flat bottom, black) was loaded with a mixture solution (200 μL) containing DNA (1 μM/strand), and TO (6 μM) in a buffer (100 mM KCl, 10 mM SC, 0.5 mM EDTA, pH 6.8). After incubation at 25 °C for 30 min, the fluorescence of each well was recorded (average of 10 readings, Ex: 495 nm and Em: 535 nm). Afterwords, 2 μL of 3 solution was added in each well from a stock solution (100 μM) and the solution was mixed thoroughly in each well before recording the fluorescence. All experiments were carried out in duplicate. The fluorescence readings with no ligand and with no DNA are defined as 100% and 0% fluorescence, respectively. Fluorescence readings are reported as percentage fluorescence relative to the control wells. Fluorescence plate reader shows a variability of ±10 %.
2,2’-(Ethylenedioxy)bis(ethylisothiocyanate) (2)
In a 25 mL round-bottom flask, 2,2’-(Ethylenedioxy)bis(ethylamine) (13.8 mg, 0.135 mmol) was dissolved in 10 mL anhydrous CH2Cl2 under a N2 atmosphere. 1,1’-Thiocarbonyldi-2(1H)-pyridone (47.6 mg, 2.2 equiv.) was added into the flask and stirred for 4 h at room temperature. The progress of the reaction was monitored by TLC. Flash chromatography of the residue (CH2Cl2) yielded the desired product as colorless oil (20.4 mg, 94 %). Rf = 0.5 (silica gel, CH2Cl2); IR (cm-1): 3350, 2950, 2920, 2100 (NCS), 1520, 1250, 1050; 1H NMR (300 MHz, CDCl3) δ 3.67-3.75 (m, 12H); 13C NMR (125 MHz, CDCl3) δ 132.6, 70.9, 69.4, 45.4; MS (EI) calcd. For C8H12N2O2S2+ (M+) 232.0340, found 232.0345. Anal. Calcd for C8H12N2O2S2: C, 41.36; H, 5.21; N, 12.06. Found: C, 41.71; H, 5.32; N, 11.98.
N-Boc Dimer (3a)
In a 25 mL round-bottom flask, 2,2’-(Ethylenedioxy)bis(ethylisothiocyante) (1.623 mg, 0.007 mmol) was dissolved in 5.0 mL anhydrous pyridine under N2. Neomycin amine 1 (17.8 mg, 0.014 mmol, 2 equiv.) and catalytic amount of 4-dimethylaminopyridine were added into the flask and stirred at room temperature overnight. The reaction mixture was then concentrated. Flash chromatography of the residue (6% v/v CH3OH in CH2Cl2) yielded the desired product as white solid (18.5 mg, 95%): Rf = 0.6 (silica gel, 10% v/v CH3OH in CH2Cl2); IR (cm-1): 3375 (OH), 2930, 2870, 2150 (-C=S), 1691, 1510. 1H-NMR (500 MHz, CD3COCD3): δ 7.52 (s, 2 H, (S=C-NH-CH2-CH2-O-)), 7.30 (s, 2 H, C5III-CH2-CH2-NH-C=S), 6.43 (t, 2H, J= 5 Hz, NH6IV), 6.25-6.28 (m, 2H, NH1I), 6.22 (d, 2H, J = 9 Hz, NH6II), 6.08-6.15 (m, 4H, NH3I and NH2IV), 5.95 (s, 2H, NH2II), 5.21 (s, 2H, H1II), 5.17 (d, 2H, J= 2 Hz, H1III), 5.05 (d, 2H, J= 4.5 Hz, OH4IV), 5.02 (s, 2H, H1IV), 4.78 (s, 2H, OH6I), 4.57 (s, 2H, OH4II), 4.45-4.54 (m, 6H, OH), 4.35 (s, 2H, H4III), 4.25-4.28 (m, 2H, H2III), 4.23-4.24 (m, 4H, H3III and H5IV or H3IV), 4.17-4.21 (m, 2H, H3IV or H5IV), 4.04 (s, 2H, H4IV), 3.90 (t, 2H, J = 7 Hz, H2IV), 3.68-3.80 (m, 4H, H5II and H5I), 3.62-3.66 (m, 12 H, -O-CH2-CH2-O-, linker protons), 3.55-3.61 (m, 12H, H6I, H4I, H3I, H5III, and H2II), 3.40-3.52 (m, 4H, H3II and H1I), 3.15-3.30 (m, 10H, H4II, H6IV and H6II), 2.97-3.05 (m, 4H, C5III-CH2-CH2-S-), 2.23-2.35 (m, 2H, H2Ieq), 1.66-1.75 (m, 2H, H2Iax), 1.26-1.60 (m, 108 H, Boc protons); 13C-NMR (125 MHz, CD3COCD3): δ 167.9 (-C=S), 157.6-156.4 (6 × Boc, C=O), 110.2 (C1III), 100.8 (C1IV), 98.9 (C1II), 86.5 (C4I), 82.1 (C3III), 81.6 (C4III), 81.6 (C6I), 79.3-79.0 (6 × Boc, Cq), 74.3 (C3II), 73.1 (C2III), 72.9 (C4II), 71.6 (C3IV or C5IV), 71.4 (C3IV or C5IV), 70.3 (C5II), 69.9 (OCH2CH2O-, linker), 69.3 (-OCH2CH2O-, linker), 67.7 (C5III-S-CH2-CH2-NH-), 67.4 (C5III-S-CH2-CH2-NH-), 66.2 (C2II), 56.0 (-OCH2CH2NH-, linker), 54.6 (C1I), 52.5 (C3I), 50.9 (C2IV), 43.9 (C6II), 41.9 (C6IV), 40.0 (C5III), 38.8, 32.3 (C2I), 24.5-22.4 (6 × Boc, (CH3)3). MS MALDI-TOF calcd. for C118H210N16O50S4 (M+Na+), 2804.26, obsd: 2804.694. Anal. Calcd for C118H210N16O50S4: C, 50.96; H, 7.61; N, 8.06. Found: C, 51.28; H, 7.75; N, 7.90.
Dimer 3
3a (18.5 mg) was dissolved in dioxane (1.0 mL). 1, 2-ethanedithiol (3.0 μL) and 4 M HCl/dioxane (1.0 mL) were added into the mixture and swirled for 5 min by hand. A white solid precipitated during the reaction. Further precipitation was induced by adding ether and hexane (1 mL each). The precipitate was recovered by centrifugation and washed twice with ether (1.0 mL) and hexane (1.0 mL). The resulting solid was redissolved in DI water and lyophilized to dryness to yield the desired product as white solid (9.79 mg, 73%): IR (cm-1) 3385 (broad), 2100 (-C=S), 1640, 1130; 1H NMR (500 MHz, D2O) δ 6.00-6.04 (m, 2H, H1II), 5.82 (d, 2H, J = 3.5 Hz, OH), 5.36-5.39 (m, 2H, H1III), 5.24 (s, 2H, H1IV), 5.21 (s, 2H, OH), 4.43-4.45 (m, 2H, H4III), 4.36-4.40 (m, 2H, H2III), 4.21-4.29 (m, 4H, H5IV or H3IV, H3III), 4.08-4.17 (m, 4H, H5IV or H3IV and H4I), 3.90-3.98 (m, 4H, H3II and H5II), 3.80-3.87 (6H, H4IV, H5I and H6I), 3.56-3.75 (m, 12H, linker protons), 3.45-3.51 (m, 8H, H2II, H2IV, H4II and H3I), 3.25-3.43 (m, 10H, H5III, H6IV and H1I), 3.10-3.14 (m, 4H, H6II), 2.70-2.95 (m, 8H, C5III-S-CH2-CH2-NH-), 2.36-2.47 (dt, 2H, J1 = 12.1 Hz, J2 = 4.0 Hz, H2Ieq), 1.71-1.95 (p, 2H, J = 12.5 Hz, H2Iax); 13C-NMR (125 MHz, D2O) δ 174.8 (-C=S), 107.9 (C1III), 97.1 (C1IV), 96.4 (C1II), 77.7 (C3III), 75.3 (C4III), 73.9 (C4I), 72.6 (C2III), 72.4 (C6I), 70.8 (C4II), 70.4 (-OCH2CH2, linker), 70.2 (-OCH2CH2, linker), 69.8 (C5IV or C3IV), 69.6 (C5II), 69.3 (C3II), 68.3 (C5IV or C3IV), 68.1 (C4IV), 67.8 (C5I), 67.4 (C5III-S-CH2-CH2-NH-), 65.7 (C5III-S-CH2-CH2-NH-), 62.7 (C2II), 58.5 (-OCH2CH2NH-, linker), 53.6 (C2IV), 51.0 (C1I), 50.9 (C3I), 49.8, 40.8 (C5III), 40.6 (C6IV), 40.2 (C6II), 28.4 (C2I). MS MALDI-TOF calcd. for C58H114N16O26S4 (M+H+), 1579.7, obsd: 1579.6. Anal. Calcd for C58H126N16O26S4Cl12: C, 34.53; H, 6.30; N, 11.11. Found: C, 34.12; H, 6.42; N, 10.93.
Results and Discussion
Synthesis of 3
Modification of aminoglycoside-based conjugates have been primarily performed using two approaches. One approach uses the conjugation of aminoglycosides to various functionalities by linkage through the amines,56 and a preferred second approach uses the primary hydroxyls present in the aminoglycosides,43, 57, 58 such as the primary hydroxyl group (-OH) on ring III of neomycin (Scheme I). The latter derivatives provide a more suitable conjugation approach since the amino groups of aminoglycosides have been shown to participate in the ligand-DNA/RNA interaction.59 The synthesis rests on the selective conversion of primary hydroxyl group (-OH) on ring III of neomycin into a good leaving group (e.g. TPS, 2,4,6-triisopropylbenzenesulfonyl) as previously reported.58 The displacement of the good leaving group (i.e. TPS) by 2-aminoethanethiol gave us neomycin amine 1. The flexible linker, 2,2 -(Ethylenedioxy)bis(ethylisothiocyanate) was then synthesized from the corresponding diamine with high yield (94%). The bis isothiocyanate linker 2 was coupled with neomycin amine 1 in the presence of DMAP catalyst, followed by deprotection with HCl/dioxane to yield the target conjugate 3 in good overall yields (~70% for two steps, Scheme 1). The thiourea-based coupling approach to dimeric aminoglycosides complements the chemistries developed in Tor, Wong and Hergenbrother labs for screening of these conjugates against RNA targets.30, 52, 55, 60-63
Ethidium bromide displacement assay shows the preference of dimer 3 towards AT rich DNA
To investigate the binding of 3 towards different DNA duplex sequences, we first monitored its binding to various DNA polynucleotides (C. Perfringens, C. Thymus, and M. Lysodeiktius) with varying GC and AT content. FID assay was conducted by using ethidium bromide as an intercalator on a 96-well plate reader.64
Figure 1 depicts the typical 96-well plate assay between 3 and DNA polynucleotides and the results are summarized in Table 1 with AC50 values (concentration of 3 required to displace 50% ethidium bromide from DNA). As shown in Table 1 and Figure 1, the AC50 values increase with increase in the GC base pair content of the DNA, suggesting the preference of 3 for AT rich DNA duplexes.
Figure 1.
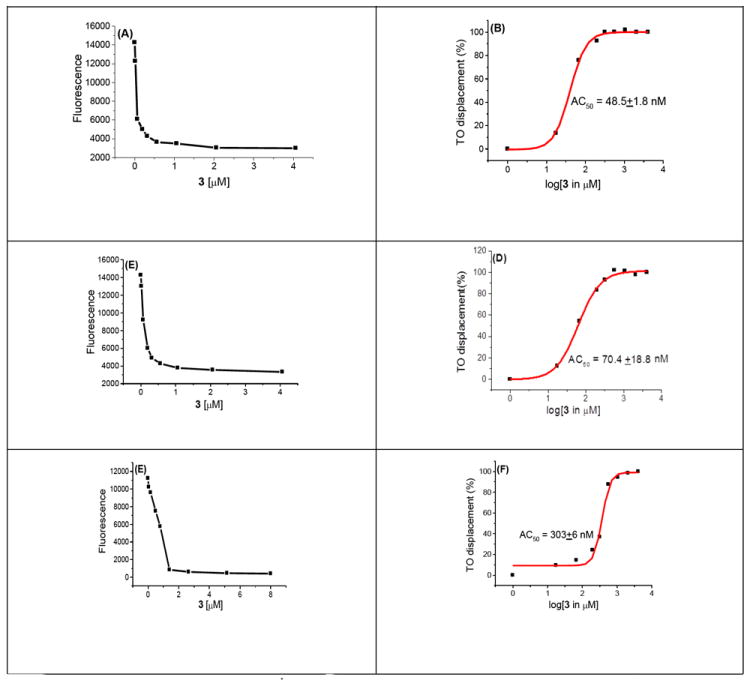
A graphical representation of the FID assay to calculate the AC50 value of 3 with various polynucleotides. (A) Plot showing decrease in the fluorescence intensity of C. Perfringens–TO complex as a function of increasing concentration of 3. (B) A sigmoidal fit between percentage of thiazole orange displaced from C. Perfringens as a function of log [3]. (C) Plot showing decrease in the fluorescence intensity of C. Thymus –TO complex as a function of increasing concentration of 3. (D) A sigmoidal fit between percentage of thiazole orange displaced from C. Thymus as a function log [3]. (E) Plot showing decrease in the fluorescence intensity of M. Lysodeiktius–TO complex as a function of increasing concentration of 3. (F) A sigmoidal fit between percentage of thiazole orange displaced from M. Lysodeiktius as a function of log [3]. Buffer conditions: 100 mM KCl, 10 mM SC, 0.5 mM EDTA, pH 6.8. [polynucleotide] = 0.88 μM/bp, [TO] = 1.25 μM. The reported AC50 value in each case is an average of three separate experiments.
Table 1.
FID-based determination of AC50 values of 3 with different polynucleotides. Buffer conditions: 100 mM KCl, 10 mM SC, 0.5 mM EDTA, pH 6.8. [DNA] = 0.88 μM/bp. [TO] = 1.25 μM. The reported AC50 value in each entry is an average of three separate experiments.
| Polynucleotide | GC content (%) | AC50 (nM) |
|---|---|---|
| C. Perfringens | 32 | 48.5±1.8 |
| Calf Thymus | 42 | 70.4±18.8 |
| M. Lysodeiktius | 75 | 303.0±6.0 |
Ethidium bromide FID assays were then carried out using homopolynucleotide DNA duplexes and a DNA triplex (see Supporting Information Figure S11). Table 2 summarizes the results and reveals some interesting facts. The AC50 value of 3 with poly(dA).poly(dT) is lowest among polynucleotide duplexes indicating that 3 shows the maximum affinity towards an AT rich homopolynucleotide. Dimer 3 shows a higher selectivity for poly(dA).poly(dT) when compared to the GC rich polynucleotide confirming previous results from Table 1. Additionally, 3 shows a significant preference for poly(dA).poly(dT) duplex over the alternating poly(dA.dT)2 duplex. The AC50 values in Table 2 show that 3 binds much poorly to the DNA triplex when compared to the DNA duplex, in contrast to the results obtained with monomer neomycin, which has been shown by us to have a much higher affinity for the DNA triplex,65 when compared a DNA duplex. The selectivity of 3 towards DNA duplex is not limited to polynucleotide structures, but also seen with oligonucleotides (Figure S12, see Supporting Information). The preference of 3 towards DNA duplex vs. DNA triplex will be discussed in more detail in a later section of UV thermal denaturation experiments. FID assays were then conducted using an oligonucleotide DNA hairpin duplex d[5’-A12-x-T12-3’] using the monomer and dimer ligand (neomycin and dimer 3) (Figure S13, Table S1, see Supporting Information). Dimer 3 showed ~100 fold lower AC50 than neomycin towards the intramolecular DNA hairpin duplex d[5’-A12-x-T12-3’] (Table S1, see Supporting Information), suggesting that the AT duplex preference of the dimer over the monomer is not restricted to the polynucleotides, but also seen with deoxyoligonucleotides.
Table 2.
FID-based determination of AC50 values of 3 with polynucleotides. The solutions were equilibrated for 1h before taking the fluorescence scans. Buffer conditions: 100 mM KCl, 10 mM SC, 0.5 mM EDTA, pH 6.8. [polynucleotide] = 0.88 μM/strand. [TO] = 1.25 μM. The reported AC50 value in each entry is an average of three separate experiments.
| polynucleotide | AC50 values (nM) |
|---|---|
| poly(dG).poly(dC) | 140±9 |
| poly(dA).poly(dT) | 23±2 |
| poly(dA).2poly(dT) | 990±60 |
| poly(dA.dT)2 | 61±9 |
Determination of the apparent DNA binding site size of 3 using CD and FID titrations
CD spectroscopy was then used to determine the binding stoichiometry between dimer 3 and the host nucleic acids. The CD-derived binding site size is useful for the thermodynamic characterization of drug DNA binding.43, 65 CD spectroscopy experiments were performed between three AT rich DNA duplexes to determine the binding stoichiometry and to monitor the CD changes induced by DNA-ligand compelxation. The CD spectrum of poly(dA).poly(dT) exhibits two positive bands, 217 and 260 nm, and a negative band around 248 nm. The large positive band (217 nm) is equal in magnitude to the negative band (248 nm). Figure 2B depicts a group of CD spectra that result from the incremental addition of a concentrated solution of 3 to poly(dA).poly(dT). The continuous addition of 3 results in changes in the CD spectrum which is indicative of the formation of a complex between the host DNA polynucleotide and 3 (Figure 2A). A close examination of CD spectra reveals the presence of an isoelliptic point, suggesting the formation of specific ligand-DNA complex. Figure 2B shows a plot between the change in the molar ellipticity vs rbd (ratio of DNA base pairs/drug). The data were fit by linear least square fit leading to an apparent stoichiometry of DNA binding to 3. To further validate the stoichiometries obtained from CD titratons, FID titrations were also performed by using ethidium bromide as an intercalator.64 The DNA duplexes were saturated with ethidium bromide solution and incremental amounts of 3 were added continuously. The fluorescence scans were taken after each addition of 3 (Figure 2C). The additions of 3 were continued until there were no more changes observed in the fluorescence scans. The change in fluorescence was plotted versus rbd, resulting in an inflection point (Figure 2D) which represents another independent estimate of the binding stoichiometry of complex formed between DNA and 3.
Figure 2.
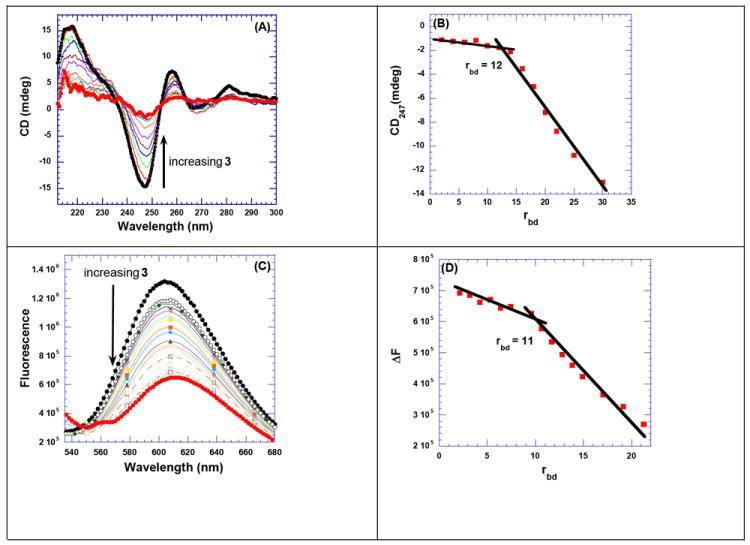
(A) CD titration of poly(dA).poly(dT) with increasing concentration of 3. The figure represents normalized molar ellipticity for CD titration of poly(dA).poly(dT) with 3. The continuous changes in the CD spectra correspond to the incremental amount of 3 ranging from a rbd of 0 to 30. (B) A plot of normalized molar ellipticity versus rdb for CD titration of poly(dA).poly(dT) with 3. The continuous lines in the plot reflect the linear least-squares fits of each apparent linear domain of the experimental data (filled circles) before and after the apparent inflection point. Molar ellipticity is per molar base pairs and rbd = ratio of the base pair/drug. (C) Raw fluorescence emission spectrum of poly(dA).poly(dT)–EtBr complex with increasing concentration of 3. The decrease of fluorescence intensity (at 618 nm) of poly(dA).poly(dT)–EtBr complex with increasing concentration of 3 is observed. (D) The plot of change in the fluorescence as a function of rbd gives the binding site size of 3 with poly(dA).poly(dT). The solution was incubated for 1 h at 20 °C before titrating with 3. The solutions were equilibrated for 5 min. after each ligand addition, and before taking the fluorescence emission scans. Buffer conditions: 100 mM KCl, 10 mM SC, 0.5 mM EDTA, pH 6.8. [DNA] = 10 μM/bp (for fluorescence titration) and 40 μM/bp (for CD titration).
DNA-3 stoichiometries obtained from CD spectroscopies and fluorescence titrations were quite comparable and show a binding size of 10-12 base pair for 3 binding to AT rich DNA duplexes. Similar studies were performed with poly(dA.dT)2 (Figure S14, see Supporting Information), d[5’-A30T30-3’] (Figure S15, see Supporting Information), and poly(dG).poly(dC) DNA duplex to determine the apparent binding site size of dimer 3. The results from the fluorescence titrations are summarized in Table 3. The binding site size of 3 with all of the nucleic acids varies between 9-12 base pairs/ligand.
Table 3.
Binding site sizes calculated by FID titrations between 3 and various nucleic acids. Buffer conditions: 100 mM KCl, 10 mM SC, 0.5 mM EDTA, pH 6.8. T = 20 °C. [polynucleotides] = 10 μM/bp. [EtBr] = 5 μM. d[5’-A30T30-3’] = 0.50 μM/duplex, [TO] = 15 μM.
| Nucleic acid | Binding site size (bp) |
|---|---|
| poly(dA).poly(dT) | 11 |
| poly(dA.dT)2 | 10 |
| poly(dG).poly(dC) | 9 |
| d[5’-A30T30-3’] | 10 |
Nanomolar binding of 3 to a model deoxyoligonucleotide duplex: FID and salt dependence of binding
The results of the FID and CD titrations suggest that the ideal AT rich DNA binding site size for 3 lies between 10-12 base pair/ligand (Table 3). Based on these results, we designed and prepared a 12-mer AT rich DNA hairpin duplex d[5’-A12-x-T12-3’] as well as other DNA duplexes with various lengths and base contents to study their binding with 3. FID (Figure S16 and Figure S17, see Supporting Information) and CD (Figure S18, see Supporting Information) titrations between the hairpin duplex d[5’-A12-x-T12-3’] and 3 result in a binding stoichiometry of 1:1, as expected from a binding site size of ~12 base pairs/ligand. FID titration was performed between 3 and d[5’-A12-x-T12-3’] and Scatchard analysis was conducted to yield a high binding constant (Figure 3, Ka = 2.26×10⁸ M-1 at 50 mM KCl).64
Figure 3.
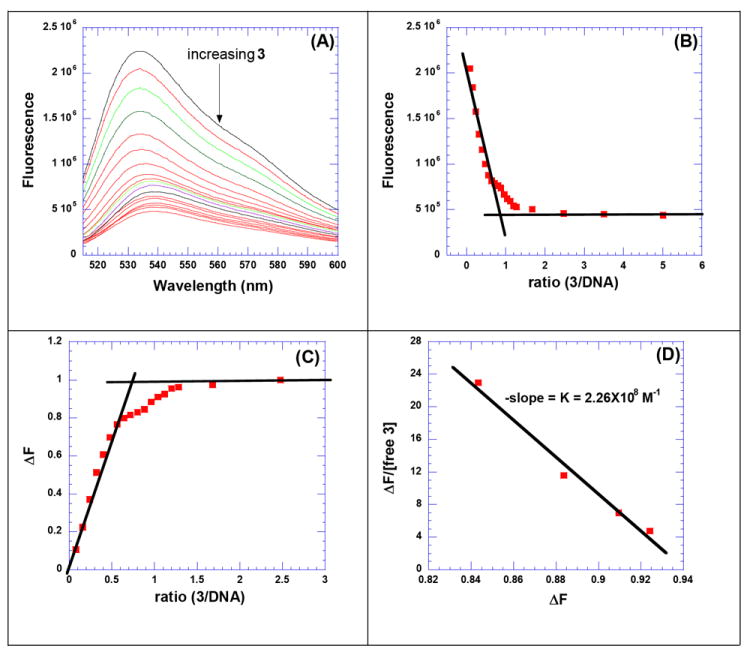
FID titration of 3 with intramolecular duplex d[5’-A12-x-T12-3’]. (A) Raw fluorescence emission spectrum in the presence of increasing concentration of 3. (B) The decrease of fluorescence intensity (at 532 nm) of DNA–TO complex with increasing concentration of 3 results in a saturating binding plot. (C) Plot between change in fluorescence intensity and concentration of 3. (D) Scatchard analysis for determination of Ka between 3 and duplex d[5’-A12-x-T12-3’]. The solution was incubated for 1 h at 15 °C before titrating it with 3. The solutions were equilibrated for 5 min. after each ligand addition, and before taking the fluorescence emission scans. Buffer conditions: 50 mM KCl, 10 mM SC, 0.5 mM EDTA, pH 6.8. d[5’-A12-x-T12-3’] = 1 μM/strand, [TO] = 6 μM. T = 20 °C
Salt dependent binding studies were carried out to assess the electrostatic contribution of binding between 3 and d[5’-A12-x-T12-3’] at 50, 100, and 150 mM KCl (Figure 3, and Figure S16 and Figure S17, see Supporting Information). The results are summarized in Table 4. A plot of log (Ka) as a function of log[K+] shows that the binding constant decreases with increasing salt concentration (Figure 4) and suggests the formation of ~3 ion pairs66 between 3 and DNA. Further pH and salt dependent studies are ongoing for the complete thermodynamic characterization of 3 with AT rich DNA duplexes.
Table 4.
Binding affinity of 3 with intramolecular duplex d[5’-A12-x-T12-3’] at different salt concentrations. Buffer conditions: 10 mM SC, 0.5 mM EDTA, pH 6.8. d[5’-A12-x-T12-3’] = 1 μM/strand. [TO] = 6 μM. T = 20 °C.
| Salt concentration (KCl in mM) | Binding constant(×106)M-1 |
|---|---|
| 50 | 226 |
| 100 | 117 |
| 150 | 7.6 |
Figure 4.
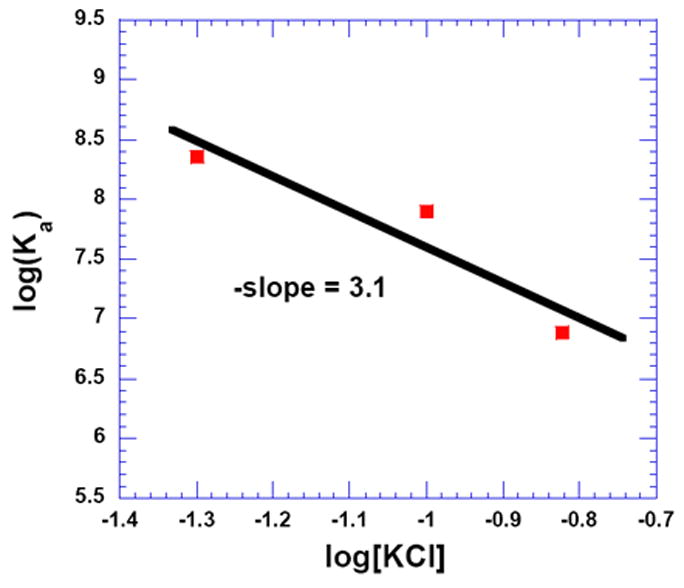
Plot showing the salt dependence of binding between 3 and d[5’-A12-x-T12-3’] in 10 mM SC, 0.5 mM EDTA, pH 6.8. The experimental data were fit with linear regression, and the solid black line reflects the linear fit. T = 20 °C.
Dimer 3, contrary to neomycin, significantly increases the Tm of AT rich DNA duplexes
We have previously reported the effect of antibiotics, specifically neomycin, on the thermal stability of DNA.RNA hybrids and triple helices.29, 65 Herein, we report the interaction of 3 with AT rich DNA duplexes using UV spectroscopy.
UV thermal denaturation experiments were performed between poly(dA).2poly(dT) and ligands neomycin and 3. In the absence of ligand, the UV thermal denaturation profile of poly(dA).2poly(dT) shows two transitions (Figure 5A and 5B, denoted as “control”), the dissociation of triplex into duplex (at 34 °C) followed by the dissociation of duplex into single strands (at 72.5 °C). The UV thermal denaturation profile was monitored at 284 nm where the triplex melting transition is more prominent in comparison to 260 nm. UV thermal denaturation experiment shows that neomycin stabilizes poly(dA).2poly(dT) by ~7 °C and has no effect on the stability of poly(dA).poly(dT) (Figure 5 B) at rbd = 3, an observation consistent with our previous results.65 On the contrary, 3 stabilizes poly(dA).poly(dT) by ~12 °C at a much lower ligand concentration and the triplex denaturation disappears (rbd = 12, Figure 5 A), suggesting the destabilization of DNA triplex in the presence of 3.
Figure 5.
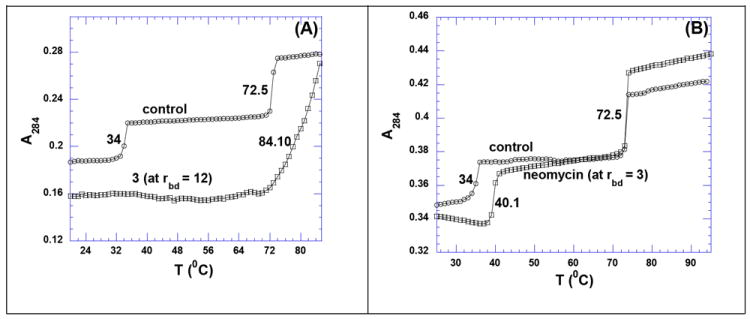
UV thermal denaturation profile of poly(dA).2poly(dT) with ligands. (A) UV thermal denaturation profile of poly(dA).2poly(dT) in the absence (circle) and presence (square) of 3 (at rbd = 12). (B) UV thermal denaturation profile of poly(dA).2poly(dT) in the absence (circle) and presence (square) of neomycin (at rbd = 3). Buffer conditions: 100 mM KCl, 10 mM SC, 0.5 mM EDTA, pH 6.8. [DNA] = 15 μM/triplex.
A UV thermal denaturation experiment was performed between DNA triplex with a gradual increase in the concentration of 3 (0 to 1.25 μM, rbd up to 12 base pairs/drug). The thermal denaturation temperature of duplex (ΔTm2→1) increases while the transition for triplex (ΔTm3→2) gradually disappears with an increase in the concentration of 3. During the formation of DNA triplex from the corresponding duplex and single strand, the third strand, poly(dT), binds into the major groove via Hoogsteen base pairing and divides the Watson-Crick major groove into two asymmetric parts: the minor part of the major groove (Crick-Hoogsteen (C-H) groove) and the major part of the major groove (Watson-Hoogsteen (W-H)). Neomycin fits well into the major groove of the DNA triplex (Watson-Hoogsteen (W-H)) with a good shape and potential complementarity that is observed in its ability to stabilize the DNA triplex.29, 65 However neomycin does not have a suitable binding pocket in the wider groove of B and B*-form DNA duplex and is thus not expected to lead to thermal stabilization of the neomycin-DNA duplex complex. Dimer 3 was designed from two monomeric neomycin units connected through a flexible linker so that the dimer will present a higher potential and shape complementarity to the DNA duplex major groove, when compared to neomycin. The major groove of DNA duplex is the likely binding site of 3 and is substantiated by the observations that a] 3 thermally stabilizes the DNA duplex and destabilizes the DNA triplex (Figure 6), suggesting that 3 competes with the dT triplex-forming strand that binds in the major groove of duplex DNA, b] the larger binding size of the dimer (10-12 base pairs), that would be expected of a ligand traversing the wide B-form DNA major groove, and [c] When the FID studies were conducted using poly(dA)•2poly(dT) triplex and poly(dA)•poly(dT) duplex (Table 2), a much higher AC50 for binding to the triplex over duplex was observed, suggesting that as opposed to neomycin, the dimer 3 clearly favors the duplex. The latter observation is also consistent with the hypothesis that 3 competes with the dT triplex-forming strand that binds in the major groove of duplex DNA.
Figure 6.
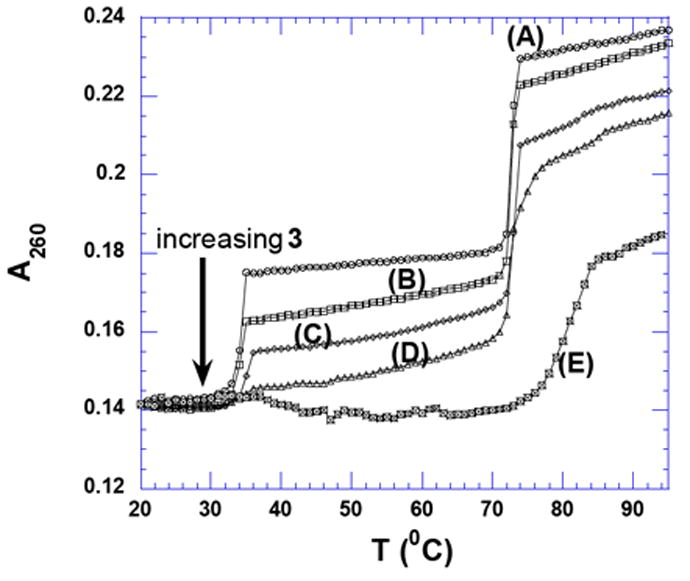
UV thermal denaturation profile of poly(dA).2poly(dT) in the presence of 3 at (A) 0 μM, (B) 0.25 μM (rbd = 60), (C) 0.50 μM (rbd = 30), (D) 1.0 μM (rbd = 15), and (E) 1.25 μM (rbd = 12). Buffer conditions: 150 mM KCl, 10 mM SC, 0.5 mM EDTA, pH 6.8. [DNA] = 15 μM/bt.
Similar results of DNA duplex stabilization were obtained with poly(dA.dT)2 in the presence of neomycin and 3 (Figure S19 and Figure S20, see Supporting Information). 3 thermally stabilizes poly(dA.dT)2 (rbd = 10) with a ΔTm ~11 °C while neomycin has no effect on the thermal stability of poly(dA.dT)2. The thermal stabilization of AT rich duplexes by 3 was not limited to polynucleotides, but also observed with oligonucleotides (as shown in Table 5 and Table 6; Figure S21 and Figure S22, see Supporting Information). Further UV thermal denaturation experiments were carried out between DNA oligonucleotides with varying base composition in the presence of 3 and the results are summarized in Table 5 and Table 6.
Table 5.
Change in Tm2→1 (at rdd = 1.0, where rdd = ratio of the duplex/drug) in the presence of 3. Buffer conditions: 100 mM KCl, 10 mM SC, 0.5 mM EDTA, pH 6.8. The melting rate was 0.2 °C/min. [DNA] = 1 μM/ duplex.
| Oligonucleotide | ΔTm (°C) |
|---|---|
| d[5’-A8T8-3’] | 6.5 |
| d[5’-GA7T7C-3’] | 5.5 |
| d[5’-G2A6T6C2-3’] | 4.9 |
| d[5’-G3A5T5C3-3’] | 5.0 |
Table 6.
Change in Tm2→1 (at rdd = 5.0, 6.0, and 7.0) for denaturation of d[5’-A30T30-3’] in the presence of 3. Buffer conditions: 100 mM KCl, 10 mM SC, 0.5 mM EDTA, pH 6.8. The melting rate was 0.2 °C/min. [DNA] = 1 μM/ duplex.
| Conc. of 3 (μM) | Tm (°C) | ΔTm (°C) |
|---|---|---|
| 0 | 64.9 | 0.0 |
| 5 | 72.7 | 7.8 |
| 6 | 74.1 | 9.2 |
| 7 | 77.9 | 13.0 |
After inspecting the UV thermal denaturation data, following observations can be made: (1) Consistent with the results from the binding of 3 to polynucleotides, all AT rich deoxyoligonucleotides show thermal stabilization in the presence of 3 (Table 5). (2) The UV thermal stability of deoxyoligonucleotides increases with an increase in the concentration of 3 (Figure 7 and Table 6, Figure S22, see Supporting Information). (3) The thermal stability of DNA duplexes in the presence of 3 increases with increase in the length of DNA duplexes. The thermal stability of DNA duplexes in the presence of 3 under saturating ligand concentrations follows the order for AT rich duplexes, d[5’-A8T8-3’] < d[5’-A30T30-3’] < poly(dA).poly(dT) at a saturating concentration of 3. (4) Tm studies with 3 and DNA duplexes with high GC content (Figure S21, see supporting Information) lead to multiphasic denaturation profiles, suggesting a more complex binding phenomenon. (5) Neomycin shows no effect on the thermal stabilization of AT rich deoxyoligonucelotides or polynucleotides.
Figure 7.
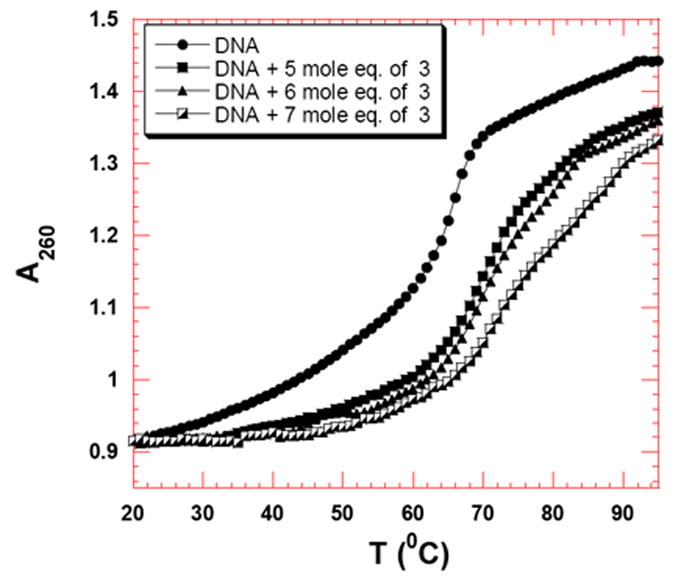
UV thermal denaturation profile of d[5’-A30T30-3’] in the presence of 3 at 5 μM (5 mol. eq.), 6 μM (6 mol. eq.), and 7 μM (7 mol. eq.). Buffer conditions: 100 mM KCl, 10 mM SC, 0.5 mM EDTA, pH 6.8. d[5’-A30T30-3’] = 1 μM/duplex.
ITC-derived thermodynamics of binding of 3 to deoxyoligonucleotides
ITC titrations were performed to characterize the binding of 3 with DNA duplexes with varying base compositions, lengths and conformations. The corrected ITC titrations are shown in Figure 8, 9 (also see Figure S23 and Figure S24, Supporting Information) and the ITC-derived thermodynamic parameters are summarized in Table 7a and Table 7b. Each peak in the upper panel (Figure 8) in every titration is the heat generated by the single injection of 3 to the corresponding DNA duplex solution. The area under each heat burst curve was determined by integration to obtain the heat associated with each injection. The corrected heat for ligand-DNA complexation was calculated by subtracting the heat of dilution of 3 obtained using the ITC titration of 3 in buffer. Following trends are noticeable from the thermodynamic parameters summarized in Table 7a and Table 7b. (1) There are two binding events observed during the complexation of 3 with most AT rich DNA duplexes which were fitted using a two independent sites binding model (Origin 5.0). (2) The first binding site is the high affinity site with a binding constant ~108 M-1, almost 50-100 fold higher than the binding constant of second binding event (Table 7a, 7b). (3) The stoichiometry for the first binding site is ~1 between 3 and DNA duplex for continuous AT rich duplexes (and 12-14 base pair for d[5’-A30.T30-3’]) corroborating the results obtained from CD and fluorescence titrations. The stoichiometry for the second binding site is ~3-4 (drug/DNA duplex) for most deoxyoligonucleotides reflecting a non-specific binding likely resulting from the electrostatic interactions between 3 and DNA duplex.
Figure 8.
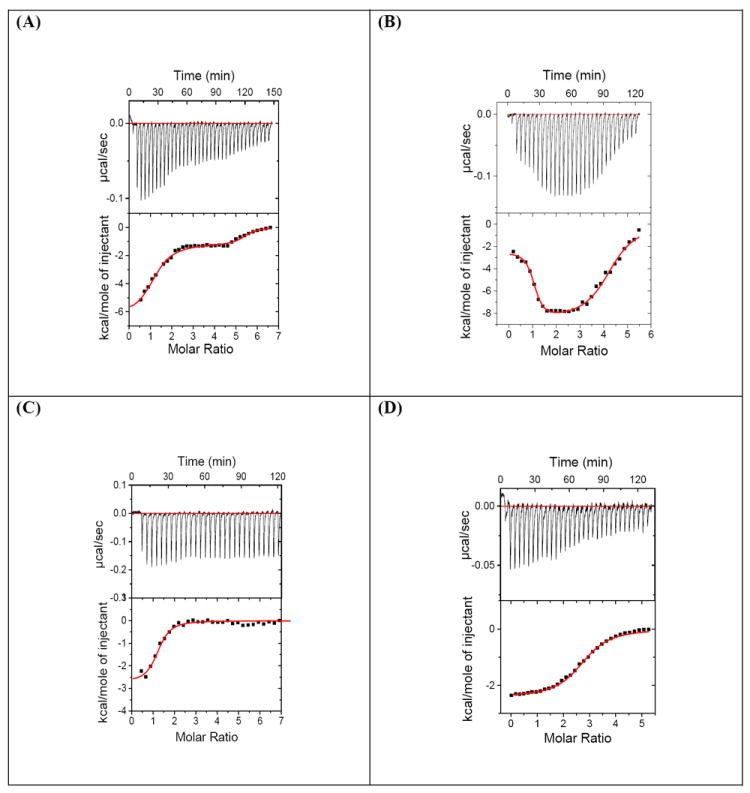
ITC profile of 3 with (A) d[5’-A12-x-T12-3’], (B) d[5’-G3A5T5C3-3’], (C) d[5’- G3(AT)5C3-3’], and (D) d[5’- A3G5C5T3-3’]. Top Panel: ITC titrations represent the heat burst curves and each heat burst curve is result of 9 μL injection of 125 μM of 3 into the DNA duplex. The area under each heat burst curve was calculated by integration and yields the associated injection heats which were then plotted as a function of molar ratio of drug to DNA in the lower panel in each figure. Lower Panel: Corrected injection heats plotted as a function of the [drug]/DNA ratio. Buffer conditions: 100 mM KCl, 10 mM SC, 0.5 mM EDTA, pH 6.8. T = 25 °C. [DNA] = 4 μM/duplex. [3] = 125 μM.
Figure 9.
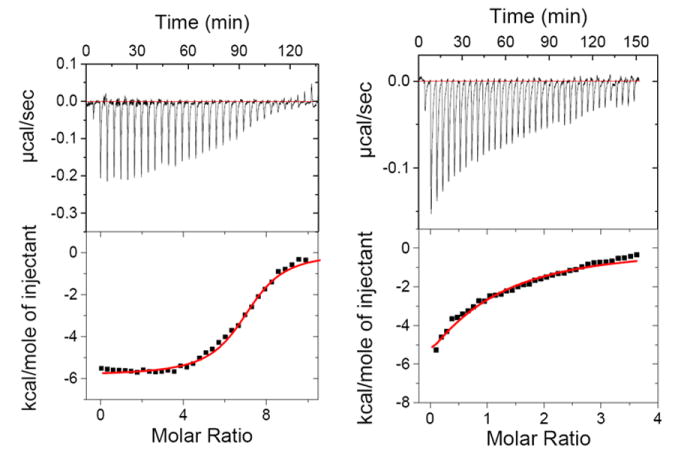
ITC titration profile of d[5’-G3G5C5C3-3’] with 3 (left) and d[5’-A3G5C5T3-3’] with neomycin (right). Top panel: ITC titrations represent the heat burst curves and each heat burst curve is a result of 9 μL injection of ligands into the duplex DNA. The area under each heat burst curve was calculated by integration and yields the associated injection heats which were then plotted as a function of molar ratio of drug to DNA in the lower panel in each figure. Lower Panel: Corrected injection heats plotted as a function of the [drug]/DNA ratio. Buffer conditions: 100 mM KCl, 10 mM SC, 0.5 mM EDTA, pH 6.8. T = 25°C. [3] = 225 μM. [DNA] = 6 μM/duplex, [neomycin] = 250 μM.
Table 7.
a. ITC-derived thermodynamic profiles for the binding of 3 with different oligonucleotides. Buffer conditions: 100 mM KCl, 10 mM SC, 0.5 mM EDTA, pH 6.8 at 25 °C. [DNA] = 4 μM/duplex, [3] = 125 μM.
| DNA seq. no. | DNA Sequence | N1 | K1 (M-1)×107 | ΔH1(kcal/mol) | TΔS1 (kcal/mol.K) |
|---|---|---|---|---|---|
| D1 | d[5’-G3G5C5C3-3’] | 7.04±0.04 | 0.27±0.02 | -5.83±0.04 | 2.95 |
| D2 | d[5’-G2A6T6C2-3’] | 0.82±0.02 | 12.9±3.4 | -5.16±0.03 | 5.90 |
| D3 | d[5’-G3A5T5C3-3’] | 1.01±0.02 | 25.3±10.0 | -2.48±0.02 | 8.96 |
| D4 | d[5’-A3G5C5T3-3’] | 2.64±0.09 | 0.077±0.001 | -3.19±0.01 | 4.82 |
| D5 | d[5’-A12-x-T12-3’] | 1.16±0.06 | 28.2±12.0 | -6.34±0.46 | 5.18 |
| D6 | d[5’-A30T30-3’] | 4.30±0.16 | 129.2±54.1 | -7.49±0.16 | 5.06 |
| D7* | d[5’-A2G3A12G3A2-3’] | 1.95±0.10 | 8±3 | -2.1±1.8 | 7.5 |
| D8* | d[5’-A2GAG2AGAG A2GAGAG2AGA2-3’] | 2.4±0.8 | 1.78±1.00 | -0.85±0.6 | 9.74 |
| D9 | d[5’-G3(AT)5C3-3’] | 1.19±0.05 | 0.54±0.15 | -2.73±0.16 | 6.25 |
| D10* | d[5’-A2G3(AT)6G3A23’] | NA | NA | NA | NA |
| D11 | d[5’-(AT)8-3’] | 0.97±0.04 | 5.88±2.90 | -9.13±0.51 | 1.46 |
| b. ITC-derived thermodynamic profiles for the binding of 3 with different oligonucleotides. Buffer conditions: 100 mM KCl, 10 mM SC, 0.5 mM EDTA, pH 6.8 at 25 °C. [DNA] = 4 μM/duplex, [3] = 125 μM. | |||||
| DNA seq. no. | DNA Sequence | N2 | K2(M-1)×106 | ΔH2(kcal/mol) | TΔS2 (kcal/mol.K) |
| D1 | d[5’-G3G5C5C3-3’] | NA | NA | NA | NA |
| D2 | d[5’-G2A6T6C2-3’] | 3.19±0.03 | 2.15±0.13 | -12.09±0.09 | -2.95 |
| D3 | d[5’-G3A5T5C3-3’] | 3.25±0.05 | 2.69±0.39 | -8.65±0.02 | 0.12 |
| D4 | d[5’-A3G5C5T3-3’] | NA | NA | NA | NA |
| D5 | d[5’-A12-x-T12-3’] | 4.19±0.11 | 12.2±5.7 | -1.17±0.08 | 8.40 |
| D6 | d[5’-A30T30-3’] | 2.01±0.17 | 71.1±14.0 | -11.44±0.54 | 0.53 |
| D7* | d[5’-A2G3A12G3A2-3’] | 7.0±0.1 | 3.80±0.06 | ||
| D8* | d[5’-A2GAG2AGAG A2GAGAG2AGA2-3’] | 9.4±0.8 | 3.3±1.0 | ||
| D9 | d[5’-G3(AT)5C3-3’] | NA | NA | NA | NA |
| D10* | d[5’-A2G3(AT)6G3A2-3’] | NA | NA | NA | NA |
[DNA] = 4 μM/duplex, [3] = 440 μM.
(4) The binding affinity of 3 towards DNA duplexes follows the order; continuous AT rich sequence, d[5’-G3A5T5C3-3’] (D3)> Alternate AT rich sequence, d[5’-G3(AT)5C3-3’](D9) > GC rich sequences, >d[5’- G3G5C5C3-3’](D1) ~d[5’- A3G5C5T3-3’](D4) (Figure 8, 9 and Table 7a). (5) The thermodynamic signatures for the first binding event are significantly different than the second binding event. For continuous AT rich sequences, the first binding event is predominantly entropically driven, while on the other hand, the second binding event is enthalpically driven. For the remainder of the duplexes (alternate AT rich duplex or the GC rich duplex), the first binding event is either enthalpy driven (duplex D1) or shows a much lesser contribution to the free energy of binding from entropy (D9). When we compare the thermodynamics of binding of deoxyoligonucleotides D3 to D9, the enthalpic contributions to the binding are almost equivalent (-2.48 versus -2.73 kcal/mol) but D3 shows a much larger contribution to free energy of binding from entropy (TΔS1 = 8.96 versus 4.82 kcal/mol), leading to a 50 fold higher affinity of dimer 3 with D3 than D9. Additionally, while there are large variations in K1 values for the first binding event, the K2 values for all the deoxyoligonucleotides remain relatively constant (D2, D3, D7, D8, Table 7b), suggesting a non-specific binding event.
(6) The alternating AT duplex D9 shows the weakest affinity among the AT rich DNA duplexes. The DNA oligonucleotide D3 has a 10 base pair AT tract with one A to T switch, whereas the oligonucleotide D9 contains a 10 base pair stretch of alternating AT base pairs (9 switches). The ITC derived binding constant of 3 with D3 is significantly higher (50 fold) than with D9. Attempts were made to make a similar comparison with a longer sequence set, 22-mer oligonucleotide D7 and it’s AT rich alternate version (sequence D10). However, the ITC profile of sequence D10 under similar solution conditions exhibited multiple binding events that could not be fit to derive useful thermodynamic data (Figure S24 E, F, see Supporting Information). (7) The binding of 3 with DNA is clearly base content dependent. In general, dimer 3 binds more tightly to AT rich DNA (D2, D3, D5 and D6) than to GC-rich DNA such as D1 and D4 (Table 7a). Additional evidence for this conclusion comes from the comparison of the binding of 3 with two 22-mer DNA duplexes, D7 and D8 that contain polypurine and polyprimidine single strands. The former contains 12 consecutive AT base pairs and the latter has 12 mixed base pairs in the same region. ITC profiles indicate binding constant of D7 with 3 is (8 ± 3) × 107 M-1 that is 4.5 fold higher than that of D8 with 3. The binding constants have no noticeable difference in the second binding event. Duplexes D7 and D8 both adopt a canonical B-form conformation as they do not contain continuous A tracts or G tracts, as also confirmed by CD spectroscopy. (8) Inclusion of continuous GC base pairs in the middle of the sequence (D3 versus D1 and D4), which can lead to an A-form DNA conformation, significantly alters the ITC profiles such that there is a single low affinity binding site where multiple drugs bind. The duplex affinities of 3 with D1 and D4 are lowered by a factor of 100-1000, when compared to the affinity of 3 with D3.
DNA duplex binding of monomer versus dimer. ITC studies of neomycin and 3 binding to A and B form DNA duplexes
The binding affinities of ligands 3 and neomycin were then compared for AT and GC rich duplexes. ITC titrations were performed between d[5’-A3G5C5T3-3’] and ligands 3 and neomycin under similar conditions and the thermodynamic parameters are summarized in Table 8. Dimer 3 shows only ~3 fold higher binding affinity than neomycin towards the GC rich DNA duplex D4. The shape of the ITC titration reveals that there is one binding event taking place with both the ligands, but 3 shows a binding stoichiometry of ~3:1, whereas neomycin binds with a stoichiometry of 1:1 (Figure 9). The lower binding constant and a higher stoichiometry of 3:D4 complexation (as compared to AT rich duplexes) suggests that 3 binds to the GC rich duplex D4 (as well as D1) through non-specific electrostatic interactions. Our finding that 3 has higher binding affinity towards D3 than D1 and D4 can be rationalized on the basis of conformation of the DNA duplexes used in the study. The CD spectrum of DNA duplex d[5’-A3G5C5T3-3’] and d[5’-G3A5T5C3-3’] are shown under the same solution conditions (Figure 10). The CD spectrum of DNA duplex d[5’-G3A5T5C3-3’] exhibits a positive band at 280 nm and a negative band around 248 nm with almost equal intensities, representative of a B-form DNA conformation.67 On the other hand, the CD spectrum of DNA duplex d[5’-A3G5C5T3-3’] exhibits a positive band at 262 nm and a negative band around 240 nm, which represents an A-form DNA conformation.67, 68 Sequence D1 shows an A-form CD spectrum identical to sequence D4, and ITC shows almost 7 molecules of 3 binding to the duplex (Figure 9) suggesting a non-specific complexation process. Neomycin binding to D1 resembles the binding of neomycin to D4, with a slightly higher affinity being observed for D1 than D4 (Table 8). The A-form DNA conformation represents a structure with narrower and deeper major groove and wider and shallower minor groove, whereas the major groove of B and B*-form DNA is much wider. A combination of ITC and CD data analysis suggests that 3 shows a higher binding affinity towards B-form DNA when compared to A-form DNA. Again, the major groove remains a likely binding site, since the higher affinity of the larger ligand 3 is observed with DNA conformations with wider major groove (B, B*) whereas the smaller monomer ligand neomycin prefers to bind the DNA conformations with narrower major grooves (A form).
Table 8.
Comparison of ITC-derived thermodynamic profiles of 3 and neomycin with d[5’- A3G5C5T3-3’]. Buffer conditions = 100 mM KCl, 10 mM SC, 0.5 mm EDTA, pH 6.8. T = 25 °C. [DNA] = 4 μM/duplex. [3] = 125 μM. [neomycin] = 250 μM.
| Ligand:DNA | N1 | K1 (M-1)×105 | ΔH1(Kcal/mol) | TΔS1 (Kcal/mol.K) |
|---|---|---|---|---|
| 3:D4 | 2.64±0.09 | 7.75±1.70 | -3.19±0.01 | 1.43 |
| Neomycin:D4 | 0.94±0.20 | 2.02±0.20 | -11.88±0.32 | -5.45 |
| Neomycin:D1 | 1.50±0.04 | 3.80±0.18 | -6.89±0.23 | 0.53 |
Figure 10.
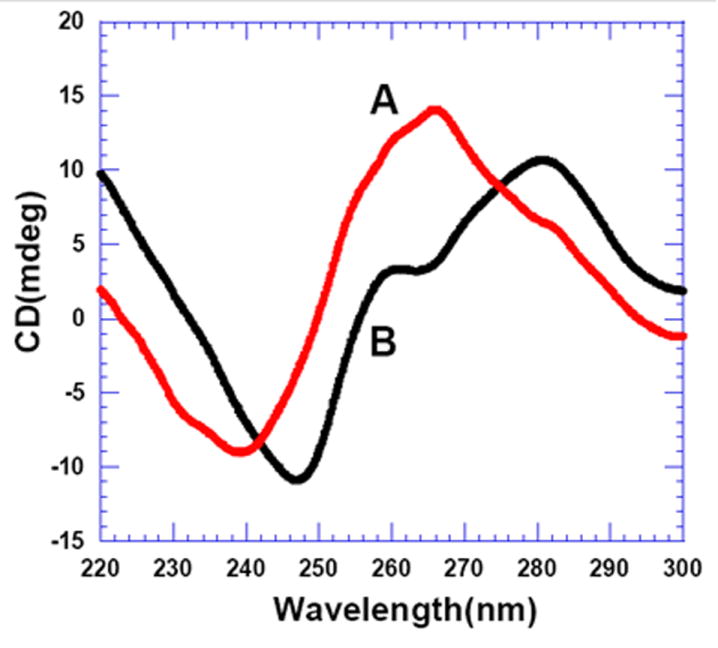
CD spectra of the DNA sequences (A) d[5’-A3G5C5T3-3’] and (B) d[5’-G3A5T5C3-3’] Buffer conditions: 100 mM KCl, 10 mM SC, 0.5 mM EDTA, pH 6.8 at 25 °C. [DNA] = 4 μM/duplex.
Similar studies were conducted between ligands 3 and neomycin and duplex d[5’-G3A5T5C3-3’]. Under identical solution conditions, we were not able to determine the binding constant between d[5’-G3A5T5C3-3’] and neomycin because of the extremely weak signal in ITC titration (Figure S25, See Supporting Information). Neomycin shows very weak binding affinity towards AT rich DNA duplexes. Based on previous results of neomycin binding towards AT rich DNA duplex (Ka<105M-1) and triplex, we estimate that 3 has at least a 1000 fold higher affinity than neomycin for the B* form AT rich DNA duplexes.65
Thiazole orange FID Assay for 512-member deoxyoligonucleotide hairpin library with 3
Thiazole Orange displacement assay was performed between 3 and 512 hairpin duplexes that varied in their A and T content and placements. FID assay is one of the simpler assays used for determining the sequence selectivity of ligands.64, 69 Boger and coworkers64 have developed this assay for DNA duplexes and the assay has been later utilized for studying ligand binding to DNA triplexes,70 and DNA quadruplexes.71 From our previous experiments (ITC, CD, and fluorescence titrations) we have determined the DNA binding site size of 3 (~10-12 base pairs). Data presented from our studies has shown that 3 prefers to bind to continuous AT rich sequences over alternating AT sequences. To further investigate the preference of 3 for non alternating versus alternating AT sequences, we have designed a 12-mer DNA duplex hairpin library (512 hairpins, see Table S2 in Supporting Information) that contains one GC base pair on each end and the ten AT base pairs in the middle of the sequence have been varied. Thiazole orange was utilized as an intercalator for the assay and the assay was performed at 1:1 drug/DNA ratio in duplicate, with the error values at ± 10 %. Results show a DNA sequence preference for 3 that is similar to what we observed with FID and ITC titrations and are discussed below.
Binding of 3 was examined against a library of 512 DNA hairpins oligonucleotides and the results are depicted in Figure 11. Data in Figure 11 shows the percent fluorescence for all the 512 hairpin sequences in the presence of dimer 3 (Figure 11A); the insets show the sequences of the hairpins that show the highest percent fluorescence (Figure 11D, weakest binders) and lowest percent fluorescence (Figure 11C, strongest binders). When dimer 3 binds a hairpin with high affinity, a significant amount of TO is displaced, lowering the % fluorescence. Figure 11 shows that 3 exhibits a clear selectivity towards continuous AT rich sequences as the 20 highest affinity hairpins (as identified by high TO displacement=lowest % fluorescence) contain very few A to T switches. On the other hand, the 20 lowest affinity hairpins (as identified by low TO displacement=highest % fluorescence) show a large number of A to T switches with one of the lowest affinity hairpin being the sequence with the maximum possible number of A to T switches (5’-ATATATATAT-3’, 2nd to worst affinity hairpin). These results are consistent with the ITC derived results that showed a much higher affinity of 3 towards continuous AT rich sequences over alternating AT sequences. As found in our preliminary studies with the polynucleotides and designed deoxyoligonucleotides, alternating AT rich duplexes show the lowest affinities (Figure 11D) whereas continuous stretches of AT tracts show the highest affinities (Figure 11C). We note that the aforementioned strong ten base pair binding site in sequence D3 (d[5’-G3A5T5C3-3’], Table 7a) resides in the top 7% of the 512 sequences (Table S2, see Supporting Information). The weakest ten base pair binding site resides in the sequence D9 (d[5’-G3(AT)5C3-3’], Table 7a), resides in the very bottom of the hairpin DNA library among the 512 sequences.
Figure 11.
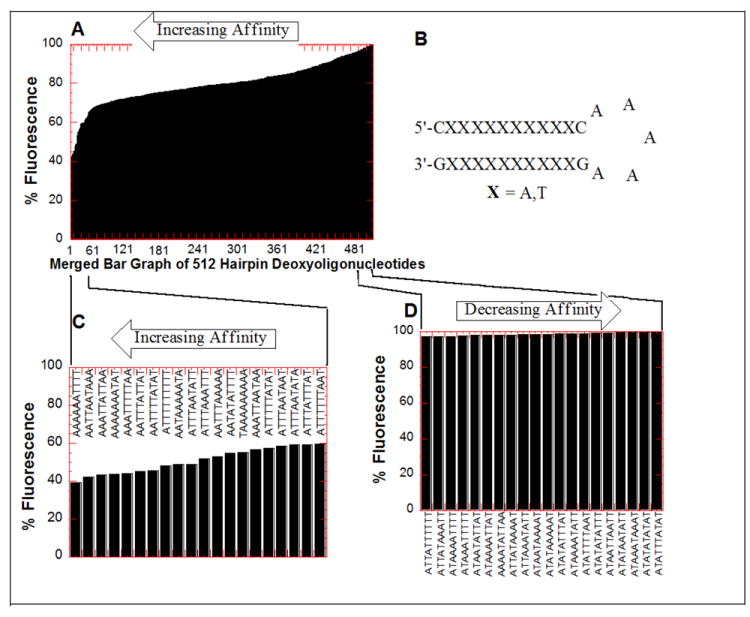
Results of the FID assay of 3 with 512 hairpin deoxyoligonucleotides. (A) Merged bar graph of 512 hairpin DNA oligonucleotides. (B) The common structure of hairpins. (C) Top 20 (highest affinity) hairpin sequences. (D) Bottom 20 (lowest affinity) hairpin sequences. After incubation at 25 °C for 30 min, each well was read (average of 10 readings) on a fluorescent plate reader (Ex. 495 nm, Em. 535 nm) in duplicate with two control wells (no ligand) 100% fluorescence, (no DNA) 0% fluorescence. Fluorescence readings are reported as percentage fluorescence relative to the control wells. Buffer conditions: 100 mM KCl, 10 mM SC, 0.5 mM EDTA, pH 6.8.
We then examined the probabilities of the A to T alternation in a subset of our hairpin library data. The “top 24” highest-affinity sequences have only 86 “switches” from A to T or vice versa (see Supporting Information, Table S2, S3 for the list of sequences). If there were no correlation between sequence and affinity, we would expect 108 switches (24 × 9 × 0.5) in these 24 sequences. Compared to this null hypothesis, the probability that the 24 highest-affinity sequences would have 86 or fewer switches is 0.001%. Similarly, the “worst 24” lowest-affinity sequences have 125 “switches” from A to T or vice versa. If there were no correlation between sequence and affinity, we expect 108 switches (24 × 9 × 0.5) in these 24 sequences. Compared to this null hypothesis, the probability that the 24 lowest-affinity sequences would have 125 or more switches is 0.05%. The p values exceed 99% confidence levels (p < 0.01) for “top/bottom N” with any N value chosen, even N = 1. This analysis supports the claim that fewer A to T (or T to A) switches is correlated with higher affinity of hairpin binding to dimer 3.
Recognition of DNA conformations: B* to B to A
The origin of the differences in binding sequence-specificity at the extremes can be broadly rationalized on the basis of the conformation of DNA duplexes used in the study. AT rich sequences adopt two conformations, canonical B-form and non-canonical B-form, depending upon the placement of AT bases. Previous reports have shown that AT rich DNA homopolymers have more ordered hydration patterns and a non B-form conformation (some of these A-tract containing sequences are referred to as B*),54 when compared to more B-form alternating AT DNA duplexes.72 This difference in hydration/structure is sufficient enough to affect thermodynamics of ligand binding to DNA.72 For example, previous studies where small molecule binders such as ethidium bromide (intercalator) and netropsin (groove binder) were studied as probes of DNA conformation, similar affinities were observed with drug binding to homopolymer poly(dA).poly(dT) duplex as well as the alternating copolymer duplex poly(dA.dT)2.72 However, the enthalpy and entropy contributions to free energy were reversed in the two binding events. Due to the ordered hydration spheres, the A-tract sequences (continuous AT rich sequences) tend to be more rigid structures; and during the complexation of DNA with ligands, there is an expected melting of the hydration sphere of DNA. The melting causes the liberation of water molecules from DNA grooves to the bulk solution resulting in a favorable entropy of binding. We observe a similar entropy driven binding for homopolymeric DNA (D3, table 7a) and a much more enthalpy driven binding towards the alternating DNA duplex (D9, Table 7a). If the terminal G3C3 base pairs in D9 are replaced by alternating AT base pairs (D11, Table 7a) to further disrupt the hydration, the thermodynamic signatures become completely enthalpy driven. However, as opposed to the enthalpy-entropy compensation commonly seen in the binding of minor groove binders and intercalators to duplex DNA,72 DNA structure and hydration patterns lead to different affinities of 3 for these two types of DNA. Thus, while a complete thermodynamic analysis is necessary to use most DNA intercalators and minor groove binders as probes of DNA conformations, the carbohydrate-based ligands (dimer and monomer) identified here may represent a much simpler alternative as probes of B/B* and A form DNA conformations.
Summary
We have used calorimetric and spectroscopic techniques to investigate the binding characterization of a newly synthesized carbohydrate ligand 3 with different nucleic acids. This ligand, in stark contrast to previously studied DNA binding ligands, is completely derived from non-aromatic aminosugar scaffolds. We have previously reported that aminosugars such as neomycin can act as a probe for A-form DNA. We have also explored aminoglycoside specificities by conjugating them with various nucleic acid binders. In this report, we have explored the binding of a dimeric aminoglycoside 3 with DNA duplexes and arrived at the following conclusions: (1) Dimer 3 has a clear preference towards AT rich duplexes over GC rich duplexes. (2) Dimer 3 has a large binding site (10-12 base pairs/ligand) and shows a clear preference for the AT rich DNA duplex over a DNA triplex, as seen with oligonucleotides as well as polynucleotides, suggesting that the major groove is the likely binding site for 3. (3) Binding affinity of 3 decreases with increasing salt concentration and shows that three ion pairs are involved in the binding of 3 with DNA duplex. (4) Dimer 3 shows a preference for B and B*- DNA over A-form DNA, in stark contrast to the monomer neomycin, which prefers A-form DNA over B-form DNA. (5) Binding of 3 towards B*-DNA (non –alternating A-tract DNA duplexes) is favored by almost 50 fold over B-form DNA (alternating AT DNA), and almost 1000 fold over A form DNA (GC rich DNA).
The study outlines the first example of a major groove binding aminoglycoside-based ligand, in addition to being one of the first examples of a carbohydrate-only ligand that binds to A tract DNA duplexes with such high affinity and shows a clear specificity towards non alternating B*-form DNA duplexes. Additionally, few ligands that bind to such long stretches of DNA have ever been reported. Further work in this area with different carbohydrate-based scaffolds will extend the development of novel DNA duplex-specific carbohydrates to recognition of mixed sequences with higher affinities and better specificities than currently available DNA binders.
Supplementary Material
Acknowledgments
This work was supported by NSF (CHE/MCB-0134932) and NIH (R15CA125724). We are thankful to Prof. Steve Stuart, Clemson University, for help with statistical analysis of the hairpin library binding data.
Footnotes
Supporting Information Available: Characterization data for 2, 3a and 3, experimental data for FID, CD, ITC and UV thermal denaturation experiments. This material is available free of charge via the Internet at http://pubs.acs.org.
References
- 1.Dervan PB. Bioorg Med Chem. 2001;9:2215–2235. doi: 10.1016/s0968-0896(01)00262-0. [DOI] [PubMed] [Google Scholar]
- 2.Hecht SM. J Am Chem Soc. 2009;131:3791–3793. doi: 10.1021/ja9012485. [DOI] [PubMed] [Google Scholar]
- 3.Neidle S. In: The Molecular Basis for the Action of Some DNA-Binding Drugs. Ellis GP, West GB, editors. Vol. 16. Progress in Medicinal Chemistry; Elsevier; 1979. pp. 151–221. [DOI] [PubMed] [Google Scholar]
- 4.Long EC, Barton JK. Acc Chem Res. 1990;23:271–273. [Google Scholar]
- 5.Rao KE, Lown JW. Chem Res Toxicol. 1991;4:661–669. doi: 10.1021/tx00024a011. [DOI] [PubMed] [Google Scholar]
- 6.Neidle S. Nat Prod Rep. 2001;18:291–309. doi: 10.1039/a705982e. [DOI] [PubMed] [Google Scholar]
- 7.Wade WS, Mrksich M, Dervan PB. J Am Chem Soc. 1992;114:8783–8794. [Google Scholar]
- 8.White S, Baird EE, Dervan PB. Biochemistry. 1996;35:12532–12537. doi: 10.1021/bi960744i. [DOI] [PubMed] [Google Scholar]
- 9.Dervan PB. Science. 1986;232:464–471. doi: 10.1126/science.2421408. [DOI] [PubMed] [Google Scholar]
- 10.Dervan PB, Burli RW. Curr Opin Chem Biol. 1999;3:688–693. doi: 10.1016/s1367-5931(99)00027-7. [DOI] [PubMed] [Google Scholar]
- 11.Willis B, Arya DP. Curr Org Chem. 2006;10:663–673. [Google Scholar]
- 12.Ma Q, Akiyama Y, Xu Z, Konishi K, Hecht SM. J Am Chem Soc. 2009;131:2013–2022. doi: 10.1021/ja808629s. [DOI] [PubMed] [Google Scholar]
- 13.Animati F, Berettoni M, Bigioni M, Binaschi M, Felicetti P, Gontrani L, Incani O, Madami A, Monteagudo E, Olivieri L, Resta S, Rossi C, Cipollone A. ChemMedChem. 2008;3:266–279. doi: 10.1002/cmdc.200700232. [DOI] [PubMed] [Google Scholar]
- 14.Bross PF, Beitz J, Chen G, Chen XH, Duffy E, Kieffer L, Roy S, Sridhara R, Rahman A, Williams G, Pazdur R. Clin Cancer Res. 2001;7:1490–1496. [PubMed] [Google Scholar]
- 15.Hayasaka T, Inoue Y. Biochemistry. 1969;8:2342–2347. doi: 10.1021/bi00834a014. [DOI] [PubMed] [Google Scholar]
- 16.Chapuis JC, Schmaltz RM, Tsosie KS, Belohlavek M, Hecht SM. J Am Chem Soc. 2009;131:2438–2439. doi: 10.1021/ja8091104. [DOI] [PMC free article] [PubMed] [Google Scholar]
- 17.Nicolaou KC, Tsay SC, Suzuki T, Joyce GF. J Am Chem Soc. 1992;114:7555–7557. [Google Scholar]
- 18.Bifulco G, Galeone A, Gomez-Paloma L, Nicolaou KC, Chazin WJ. J Am Chem Soc. 1996;118:8817–8824. [Google Scholar]
- 19.Bifulco G, Galeone A, Nicolaou KC, Chazin WJ, Gomez-Paloma L. J Am Chem Soc. 1998;120:7183–7191. [Google Scholar]
- 20.Schatz A, Bugie E, Waksman SA. Proc Soc Exp Biol Med. 1944;55:66–69. [Google Scholar]
- 21.Waksman SA, Lechevalier HA. J Antibiot. 1949;109:305–309. doi: 10.1126/science.109.2830.305. [DOI] [PubMed] [Google Scholar]
- 22.Tok JB, Cho J, Rando RR. Biochemistry. 1999;38:199–206. doi: 10.1021/bi9819428. [DOI] [PubMed] [Google Scholar]
- 23.Mei H, Galan AA, Halim NS, Mack DP, Moreland DW, Sanders KB, Truong HN, Czarnik AW. Bioorg Med Chem Lett. 1995;5:2755–2760. doi: 10.1016/s0968-0896(97)00064-3. [DOI] [PubMed] [Google Scholar]
- 24.Zapp ML, Stern S, Green MR. Cell. 1993;74:969–978. doi: 10.1016/0092-8674(93)90720-b. [DOI] [PubMed] [Google Scholar]
- 25.von Ahsen U, Davies J, Schroeder R. J Mol Biol. 1992;226:935–941. doi: 10.1016/0022-2836(92)91043-o. [DOI] [PubMed] [Google Scholar]
- 26.Mikkelsen NE, Brannvall M, Virtanen A, Kirsebom LA. Proc Natl Acad Sci U S A. 1999;96:6155–6160. doi: 10.1073/pnas.96.11.6155. [DOI] [PMC free article] [PubMed] [Google Scholar]
- 27.Earnshaw DJ, Gait MJ. Nucleic Acids Res. 1998;26:5551–5561. doi: 10.1093/nar/26.24.5551. [DOI] [PMC free article] [PubMed] [Google Scholar]
- 28.Tor Y, Hermann T, Westhof E. Chem Biol. 1998;5:R277–83. doi: 10.1016/s1074-5521(98)90286-1. [DOI] [PubMed] [Google Scholar]
- 29.Arya DP. Acc Chem Res. 2011;44:134–146. doi: 10.1021/ar100113q. [DOI] [PMC free article] [PubMed] [Google Scholar]
- 30.Thomas JR, Hergenrother PJ. Chem Rev. 2008;108:1171–1224. doi: 10.1021/cr0681546. [DOI] [PubMed] [Google Scholar]
- 31.Tor Y. Biochimie. 2006;88:1045–1051. doi: 10.1016/j.biochi.2006.03.005. [DOI] [PubMed] [Google Scholar]
- 32.Willis B, Arya DP. Adv Carbohydr Chem Biochem. 2006;60:251–302. doi: 10.1016/S0065-2318(06)60006-1. [DOI] [PubMed] [Google Scholar]
- 33.Arya DP. Top Curr Chem. 2005;253:149–178. [Google Scholar]
- 34.Arya DP, Micovic L, Charles I, Coffee RL, Jr, Willis B, Xue L. J Am Chem Soc. 2003;125:3733–3744. doi: 10.1021/ja027765m. [DOI] [PubMed] [Google Scholar]
- 35.Arya DP, Coffee RL, Jr, Willis B, Abramovitch AI. J Am Chem Soc. 2001;123(23):5385–5395. doi: 10.1021/ja003052x. [DOI] [PubMed] [Google Scholar]
- 36.Arya DP, Coffee RL, Jr, Charles I. J Am Chem Soc. 2001;123:11093–11094. doi: 10.1021/ja016481j. [DOI] [PubMed] [Google Scholar]
- 37.Arya DP, Coffee RL., Jr Bioorg Med Chem Lett. 2000;10:1897–1899. doi: 10.1016/s0960-894x(00)00372-3. [DOI] [PubMed] [Google Scholar]
- 38.Xi H, Arya DP. Curr Med Chem Anticancer Agents. 2005;5:327–338. doi: 10.2174/1568011054222328. [DOI] [PubMed] [Google Scholar]
- 39.Shaw NN, Arya DP. Biochimie. 2008;90:1026–1039. doi: 10.1016/j.biochi.2008.04.011. [DOI] [PubMed] [Google Scholar]
- 40.Shaw NN, Xi H, Arya DP. Bioorg Med Chem Lett. 2008;18:4142–4145. doi: 10.1016/j.bmcl.2008.05.090. [DOI] [PubMed] [Google Scholar]
- 41.Xi H, Gray D, Kumar S, Arya DP. FEBS Lett. 2009;583:2269–2275. doi: 10.1016/j.febslet.2009.06.007. [DOI] [PubMed] [Google Scholar]
- 42.Ranjan N, Andreasen KF, Kumar S, Hyde-Volpe D, Arya DP. Biochemistry. 2010;49:9891–9903. doi: 10.1021/bi101517e. [DOI] [PMC free article] [PubMed] [Google Scholar]
- 43.Xue L, Xi H, Kumar S, Gray D, Davis E, Hamilton P, Skriba M, Arya DP. Biochemistry. 2010;49:5540–5552. doi: 10.1021/bi100071j. [DOI] [PMC free article] [PubMed] [Google Scholar]
- 44.Willis B, Arya DP. Biochemistry. 2006;45:10217–10232. doi: 10.1021/bi0609265. [DOI] [PubMed] [Google Scholar]
- 45.Arya DP, Willis B. J Am Chem Soc. 2003;125:12398–12399. doi: 10.1021/ja036742k. [DOI] [PubMed] [Google Scholar]
- 46.Willis B, Arya DP. Bioorg Med Chem Lett. 2009;19:4974–4979. doi: 10.1016/j.bmcl.2009.07.079. [DOI] [PubMed] [Google Scholar]
- 47.Charles I, Xi H, Arya DP. Bioconjug Chem. 2007;18:160–169. doi: 10.1021/bc060249r. [DOI] [PubMed] [Google Scholar]
- 48.Charles I, Xue L, Arya DP. Bioorg Med Chem Lett. 2002;12:1259–1262. doi: 10.1016/s0960-894x(02)00157-9. [DOI] [PubMed] [Google Scholar]
- 49.Charles I, Arya DP. J Carbohydr Chem. 2005;24:145–160. [Google Scholar]
- 50.Napoli S, Carbone GM, Catapano CV, Shaw N, Arya DP. Bioorg Med Chem Lett. 2005;15:3467–3469. doi: 10.1016/j.bmcl.2005.04.038. [DOI] [PubMed] [Google Scholar]
- 51.Arya DP, Xue L, Willis B. J Am Chem Soc. 2003;125(34):10148–10149. doi: 10.1021/ja035117c. [DOI] [PubMed] [Google Scholar]
- 52.Michael K, Wang H, Tor Y. Bioorg Med Chem. 1999;7:1361–1371. doi: 10.1016/s0968-0896(99)00071-1. [DOI] [PubMed] [Google Scholar]
- 53.Arya DP, Coffee RL, Jr, Xue L. Bioorg Med Chem Lett. 2004;14:4643–4646. doi: 10.1016/j.bmcl.2004.07.002. [DOI] [PubMed] [Google Scholar]
- 54.Hud NV, Plavec J. Biopolymers. 2003;69:144–158. doi: 10.1002/bip.10364. [DOI] [PubMed] [Google Scholar]
- 55.Wang H, Tor Y. Bioorg Med Chem Lett. 1997;7:1951–1956. [Google Scholar]
- 56.Ryu DH, Litovchick A, Rando RR. Biochemistry. 2002;41:10499–10509. doi: 10.1021/bi026086l. [DOI] [PubMed] [Google Scholar]
- 57.Willis B, Arya DP. Biochemistry. 2010;49:452–469. doi: 10.1021/bi9016796. [DOI] [PubMed] [Google Scholar]
- 58.Kirk SR, Luedtke NW, Tor Y. J Am Chem Soc. 2000;122:980–981. [Google Scholar]
- 59.Benveniste R, Davies J. Antimicrob Agents Chemother. 1973;4:402–409. doi: 10.1128/aac.4.4.402. [DOI] [PMC free article] [PubMed] [Google Scholar]
- 60.Liu X, Thomas JR, Hergenrother PJ. J Am Chem Soc. 2004;126:9196–9197. doi: 10.1021/ja048936l. [DOI] [PubMed] [Google Scholar]
- 61.Agnelli F, Sucheck SJ, Marby KA, Rabuka D, Yao S, Sears PS, Liang F, Wong C. Angew Chem Int Ed Engl. 2004;43:1562–1566. doi: 10.1002/anie.200353225. [DOI] [PubMed] [Google Scholar]
- 62.Tok JB, Dunn LJ, Des Jean RC. Bioorg Med Chem Lett. 2001;11:1127–1131. doi: 10.1016/s0960-894x(01)00149-4. [DOI] [PubMed] [Google Scholar]
- 63.Greenberg WA, Priestley ES, Sears PS, Alper PB, Rosenbohm C, Hendrix M, Hung S, Wong C. J Am Chem Soc. 1999;121:6527–6541. [Google Scholar]
- 64.Boger DL, Fink BE, Brunette SR, Tse WC, Hedrick MP. J Am Chem Soc. 2001;123:5878–5891. doi: 10.1021/ja010041a. [DOI] [PubMed] [Google Scholar]
- 65.Xi H, Kumar S, Dosen-Micovic L, Arya DP. Biochimie. 2010;92:514–529. doi: 10.1016/j.biochi.2010.02.004. [DOI] [PMC free article] [PubMed] [Google Scholar]
- 66.Record MT, Jr, Anderson CF, Lohman TM. Q Rev Biophys. 1978;11:103–178. doi: 10.1017/s003358350000202x. [DOI] [PubMed] [Google Scholar]
- 67.Gray DM, Ratliff RL, Vaughan MR. Meth Enzymol. 1992;211:389–406. doi: 10.1016/0076-6879(92)11021-a. [DOI] [PubMed] [Google Scholar]
- 68.Ivanov VI, Minchenkova LE, Schyolkina AK, Poletayev AI. Biopolymers. 1973;12:89–110. doi: 10.1002/bip.1973.360120109. [DOI] [PubMed] [Google Scholar]
- 69.Tse WC, Boger DL. Acc Chem Res. 2004;37:61–69. doi: 10.1021/ar030113y. [DOI] [PubMed] [Google Scholar]
- 70.Yeung BKS, Tse WC, Boger DL. Bioorg Med Chem Lett. 2003;13:3801–3804. doi: 10.1016/j.bmcl.2003.07.005. [DOI] [PubMed] [Google Scholar]
- 71.Monchaud D, Allain C, Teulade-Fichou M. Bioorg Med Chem Lett. 2006;16:4842–4845. doi: 10.1016/j.bmcl.2006.06.067. [DOI] [PubMed] [Google Scholar]
- 72.Breslauer KJ, Remeta DP, Chou WY, Ferrante R, Curry J, Zaunczkowski D, Snyder JG, Marky LA. Proc Natl Acad Sci U S A. 1987;84:8922–8926. doi: 10.1073/pnas.84.24.8922. [DOI] [PMC free article] [PubMed] [Google Scholar]
Associated Data
This section collects any data citations, data availability statements, or supplementary materials included in this article.