

Abstract
The axons of retinal ganglion cells (RGCs) form topographic connections in the optic tectum, recreating a two-dimensional map of the visual field in the midbrain. RGC axons are also targeted to specific positions along the laminar axis of the tectum. Understanding the sensory transformations performed by the tectum requires identification of the rules that control the formation of synaptic laminae by RGC axons. However, there is little information regarding the spatial relationships between multiple axons as they establish laminar and retinotopic arborization fields within the same region of neuropil. Moreover, the contribution of RGC axon lamination to the processing of visual information is unknown. We used Brainbow genetic labeling to visualize groups of individually identifiable axons during the assembly of a precise laminar map in the larval zebrafish tectum. Live imaging of multiple RGCs revealed that axons target specific sublaminar positions during initial innervation and maintain their relative laminar positions throughout early larval development, ruling out a model for lamina selection based on iterative refinements. During this period of laminar stability, RGC arbors undergo structural rearrangements that shift their relative retinotopic positions. Analysis of cell-type-specific lamination patterns revealed that distinct combinations of RGCs converge to form each sublamina, and this input heterogeneity correlates with different functional responses to visual stimuli. These findings suggest that lamina-specific sorting of retinal inputs provides an anatomical blueprint for the integration of visual features in the tectum.
Introduction
Retinal ganglion cells (RGCs) with diverse morphologies and response properties transmit a retinal representation of the sensory world to the brain. In zebrafish, the vast majority of RGCs innervate the optic tectum, which initiates behaviorally relevant motor programs in response to visual cues (Nevin et al., 2010). Within the tectal neuropil, axonal arbors are targeted along the retinotopic axes, as well as the laminar axis. Although there is evidence implicating guidance cues in the establishment of each map (McLaughlin and O'Leary, 2005; Luo and Flanagan, 2007; Xiao et al., 2011), basic organizing principles of the retinotectal projection remain poorly understood. Previous studies in the larval zebrafish demonstrated that RGC axons target specific tectal laminae (Xiao and Baier, 2007). However, several aspects of lamina assembly have not been directly examined because of the fact that previous studies could not monitor the lamination of multiple, individually identifiable axons within the same volume of neuropil.
Recent studies in the mammalian visual system have demonstrated a correlation between cell type and axon lamination pattern (Huberman et al., 2008, 2009; Kim et al., 2010; Hong et al., 2011), suggesting that laminar targeting is one determinant of synaptic specificity. Cell-type-specific synapse formation may provide a mechanism by which diverse retinal inputs are integrated to confer complex visual response properties to collicular neurons (Wang et al., 2010). Early anatomical studies demonstrated that RGC axon lamination in the fish tectum is more precise than that in the mammalian superior colliculus (SC; Ramón y Cajal, 1995), suggesting that lamination plays a more prominent role in determining synapse specificity in the fish tectum. More recently, in vivo imaging in larval zebrafish has revealed that RGCs form planar arbors in the tectum (Xiao and Baier, 2007; Xiao et al., 2011). However, it is unknown whether RGC-type-specific lamination directs the formation of spatially segregated tectal circuits dedicated to processing different types of visual input.
We used multicolor genetic labeling to monitor the precision and dynamics of lamina assembly in the developing zebrafish tectum. We characterized a fine-grained sublaminar map generated by precise costratification of retinal axons. Live imaging of multiple axons in the same tectum confirmed that laminar position is established during initial innervation. Multi-day time-lapse imaging demonstrated that relative laminar positions are fixed throughout early larval development, ruling out a process in which axonal translocation along the laminar axis serves to refine patterns of connectivity. Whereas relative laminar positions are stable, retinal arbors in every lamina invariably shift their relative retinotopic positions. Examining the relationship between RGC type and axon lamination pattern in the tectum revealed that each sublamina is innervated by multiple RGC types and, in most cases, distinct combinations of RGCs. Functional imaging of visually evoked calcium responses in RGC axons confirmed that differences in axon composition of sublaminae correlate with different functional properties. Our findings support a model in which precise laminar organization of retinal afferents creates a structural framework for the integration of visual inputs to the tectum.
Materials and Methods
Fish breeding.
We raised zebrafish at 28°C on a 14/10 h light/dark cycle. The Tg(hsp70l:Cre)zdf13 fish line was generously provided by Leonard Zon (Harvard University, Cambridge, MA). All procedures were approved by the Committee on Animal Research of the University of California, San Francisco.
Plasmid construction and transgenesis.
The UAS:Brb1.0L transgenesis plasmid was constructed by excising a 14xUAS:Brb1.0L DNA fragment from the pFrank:cytoBrainbow plasmid (a gift from A. Pan and A. Schier, Harvard University, Cambridge, MA) and ligating it into the pBH (Bleeding Heart) Tol2 plasmid (a gift from M. Nonet, Washington University, St. Louis, MO). This plasmid contains a transgenesis marker (cmlc2:mCherry) that drives heart-specific expression of mCherry. Transgenesis was performed by injecting the Tol2 UAS:Brb1.0L plasmid along with transposase RNA synthesized from the pCS2TP plasmid (a gift from K. Kawakami, National Institute of Genetics, Mishima, Japan). Tg(UAS:Brb1.0L)s1997t fish were identified by mCherry heart expression at 3 d postfertilization (dpf). Founders with multiple copies were identified by determining the percentage of offspring containing the transgenesis marker. For all Brainbow experiments, only Tg(UAS:Brb1.0L)s1997t fish that produced >90% transgene-containing offspring were used, ensuring that these fish more than likely contained at least three copies of the Brainbow expression cassette. Transient mosaic Brainbow expression in RGCs was achieved by injection of the Isl2b:GAL4VP16 plasmid (Campbell et al., 2007) (a gift from C.-B. Chien, University of Utah, Salt Lake City, UT), along with I-Sce I DNA endonuclease into Tg(UAS:Brb1.0L)s1997t;Tg(hsp70l:cre)zdf13 embryos. All DNA constructs were pressure injected at a concentration of 25–50 ng/μl into one- to four-cell-stage embryos.
Image acquisition.
For all experiments, larvae were treated with 0.003% 1-phenyl-2-thiocarbamide starting at 22 h after fertilization to inhibit formation of pigment in skin cells. Larvae were imaged on a fluorescent stereoscope to identify larvae with the appropriate labeling density and a suitable level of recombination. Selected embryos were anesthetized in 0.016% tricaine dissolved in E3 medium and embedded in 2% low-melting-point agarose dissolved in E3 medium. Larvae used for multiday imaging were released from the agarose after each imaging session and placed in a Petri dish filled with E3 medium. Imaging was performed on Carl Zeiss Pascal and LSM-780 confocal microscopes equipped with a multiline argon laser for excitation of Cerulean (458 nm) and enhanced yellow fluorescent protein (EYFP) (514 nm) and a green helium–neon laser to excite dTomato (543 nm). Optical sections were acquired using 1 μm z-steps.
Image analyses.
Image stacks were visualized and analyzed using ImageJ FIJI software (http://fiji.sc/Fiji). The 3D Viewer plugin written by B. Schmid (Würzburg University, Würzburg, Germany) was used to make volume renderings to remove skin autofluorescence from image volumes. Because of the curvature of the tectum, removal of these regions was necessary to visualize the tectal neuropil from top and side views. Manual tracings and brightness/contrast enhancement were performed in Adobe Photoshop (Adobe Systems). Arbor morphology analysis and tracing of convex polygons used criteria established by Smear et al. (2007) and were performed in FIJI. For measurements of arbor distance from the surface of the tectal neuropil, we used side views in which the skin autofluorescence was not removed so that it could be used as a marker for the skin. All data are presented as mean ± SEM.
Immunohistochemistry.
Anesthetized larvae were fixed overnight in a solution of 4% paraformaldehyde in PBS. Fifty micrometer vibratome sections were cut from larvae embedded in gelatin/albumin and stained with a chick anti-GFP primary antibody (GeneTex) and an Alexa Fluor-488 anti-chick secondary antibody (Invitrogen).
Two-photon Ca2+ imaging and data analyses.
For imaging, we crossed Tg(Atoh7:Gal4-VP16)s1992t to Tg(UAS:GCaMP3)zf350 into the mitfa−/− (nacre) background (Del Bene et al., 2010). Larvae were embedded in 2% low-melting-point agarose at 6 dpf and imaged at 7 dpf with a custom-built two-photon microscope equipped with a mode-locked titanium:sapphire Chameleon UltraII laser (Coherent) tuned to 920 nm and controlled by ScanImage version 3.6 software (Pologruto et al., 2003). Image time series were acquired with a 40× water-immersion objective (numerical aperture 0.8; Olympus) at 3.37 Hz. Visual stimulus (a vertical gray bar on a black background, ∼24° high and 1° wide, moving horizontally back and forth for 2 s for a distance of ∼8°) was generated with VisionEgg software (Straw, 2008) and presented with an 800 × 600 pixel organic light-emitting diode (eMagin) with a green light filter (Rosco) to the left eye of the larvae. Imaging was performed in the right (contralateral) tectal neuropil. If x–y motion was present, image time series were x–y motion corrected with a program written in MATLAB (a gift from D. Tank, Princeton University, Princeton, NJ; modified by C. Niell, University of Oregon, Eugene OR; Dombeck et al., 2007). Data with z motion were discarded. Image analysis was performed with ImageJ FIJI software. First, ΔF image time series were generated, and then regions of interest (ROIs) were detected semiautomatically by thresholding ΔF image series and automatic detection of thresholded elements using the “analyze particles” function in ImageJ FIJI. ΔF/F plots were created with Microsoft Excel software using fluorescence intensity data obtained from the original image time series with NIH ImageJ. These plots were used to classify ROIs as ON, OFF, and ON–OFF events. To assign sublaminar position in two-photon image series, which were acquired at a single z position, the distance between the skin and the lower border of stratum fibrosum et griseum superficiale (SFGS) was divided into eight sublayers. Two-way ANOVA was performed using MATLAB.
Monte Carlo simulation.
Monte Carlo simulation for exact inference was performed using StatXact software developed by Cytel. The data in Figure 7K were treated as a contingency table in which sublaminar position was treated as an ordered variable as a result of the fact that sublaminae are naturally ordered from superficial to deeper positions, whereas RGC type was treated as a nominal variable. The 106 Monte Carlo samples were used to obtain an exact two-sided p value using a Kruskal–Wallis test.
Figure 7.

Individual sublaminae are innervated by multiple RGC types. A, B, Top views of single GFP-labeled arbors in two different 7 dpf larvae. C, D, Side views of the axons in A and B magnified 4×. Proximity to the skin overlying the tectum (autofluorescence in the CFP channel, blue; arrows) was used to identify these as SO1-targeting RGC arbors. E, F, Retrospective GFP immunofluorescence in the retinas of larvae in A and B. Boundaries of the IPL are indicated by white lines. Note that, although the RGC in E has a bistratified dendritic arbor, the RGC in F has a monostratified arbor in an OFF layer of the IPL. G, H, Top and side views of two GFP-labeled arbors in the same tectum that were manually pseudocolored green and purple. Tectal surface is indicated by white line in H. Note that these arbors have adjacent retinotopic positions and target the same tectal sublamina (SFGS1). I, J, Dendritic morphology of RGCs corresponding to axonal arbors in G and H. Note that, although the RGC in I has a bistratified dendritic arbor, the RGC in J has a monostratified arbor in the center of the IPL. Scale bars: A, B, G, H, 25 μm; C, D, 5 μm; E, F, I, J, 20 μm. K, Table summarizing the distribution of RGC axons targeting each retinorecipient sublaminae.
Results
A transgenic Brainbow system for multicolor labeling in larval zebrafish
Brainbow multicolor fluorescent labeling has been used to study neural networks and cell lineages in the mouse nervous system using stable transgenics containing Brainbow expression cassettes under the control of cell-type-specific promoter elements (Livet et al., 2007; Card et al., 2011; Pan et al., 2011). In the Drosophila nervous system, stable transgenic lines containing Brainbow expression cassettes under the control of the upstream activating sequence (UAS) permit labeling of neural subsets when used in conjunction with tissue-specific Gal4 transgenics (Hadjieconomou et al., 2011; Hampel et al., 2011). For multicolor labeling in zebrafish larvae, we used a version of the UAS:Brainbow 1.0 L (UAS:Brb1.0L) cassette that encodes three cytoplasmic fluorescent proteins (dTomato, Cerulean, and EYFP; Fig. 1A) (Pan et al., 2011). To confirm that this Brainbow cassette can generate diverse color combinations, we coinjected UAS:Brb1.0L and RNA encoding Cre recombinase into embryos carrying Gal4s1013t. This transgenic line labels several brain regions, as well as axial muscle (Scott and Baier, 2009). In some embryos, labeled muscle cells exhibited a variety of color labels (Fig. 1A), confirming that random Cre-mediated recombination can generate sufficient color diversity. However, in most injected embryos, there was a low degree of color diversity, likely attributable to early Cre expression inducing recombination in early muscle progenitors. This is consistent with other reports that have found the need to temporally control Cre expression (Weber et al., 2009; Pan et al., 2011).
Figure 1.
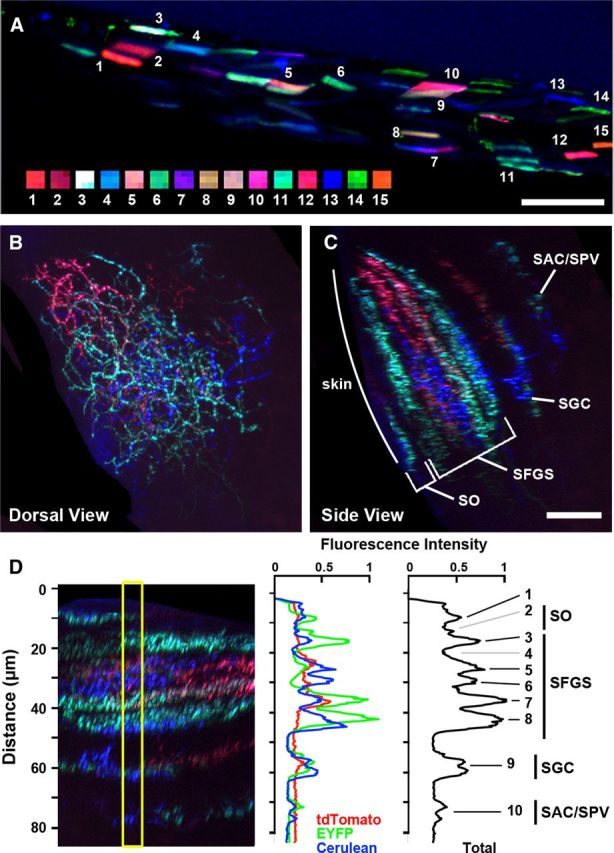
Multicolor Brainbow labeling in transgenic zebrafish. A, Side view of a 3 dpf Gal4s1013t embryo coinjected with DNA encoding UAS:Brainbow and RNA encoding Cre recombinase. Numbered squares are subregions of corresponding muscle cells. Rostral is to the left. B, Top view of the tectum from a 7 dpf UAS:Brainbow, hsp70:Cre larva injected with islet2b:gal4 DNA to drive mosaic Brainbow expression in a subset of RGCs. C, Side view of tectum in B. Image volume was three-dimensionally rendered and rotated to visualize the laminar organization of the retinotectal projection in the tectum. D, Red–green–blue (RGB) single-channel (middle) and grayscale (right) fluorescence intensity plots of region indicated by yellow box in the left. Black numbered lines indicate distinct fluorescence intensity peaks, whereas gray lines indicate regions of similar thickness without fluorescence peaks. Scale bars: A–C, 20 μm.
The retinotectal projection forms multiple sublaminae
To examine the larval retinotectal projection using Brainbow labeling, we developed a system to mosaically label RGCs with sufficient color diversity to distinguish between arbors in close proximity. The generation of diverse color labels in Brainbow transgenics is contingent on multiple insertions into the genome (Livet et al., 2007). We generated a stable transgenic line containing three or more copies of the UAS:Brb1.0L cassette (Pan et al., 2011). These fish were crossed to Tg(hsp70l:Cre)zdf13, a transgenic line expressing Cre recombinase under control of the heat-shock-inducible promoter hsp70l (Le et al., 2007). Embryos generated from this cross were injected with a DNA plasmid driving Gal4 expression under control of the Islet2b promoter, a marker for RGCs (Pittman et al., 2008). Early experiments revealed that Cre-induced recombination of the Brainbow expression cassette occurred in the absence of heat shock treatment, suggesting “leaky” expression from the hsp70 promoter. However, the random nature of Cre expression resulted in subsets of larvae with diverse color labels in retinal axons (Fig. 1B). Injection of Islet2b:gal4 DNA yielded mosaic labeling of RGCs and generated specimens with either dense (>12 RGCs) or sparse (≤12 RGCs) labeling of the retinotectal projection. In larval zebrafish, the tectal neuropil is oriented at an ∼45° angle to the dorsoventral axis, located beneath an autofluorescent layer of skin cells at the tectal surface. To examine the retinotectal projection in confocal image volumes, we used a 3D “clipping” tool to isolate the tectal neuropil (see Material and Methods). Excised volumes were examined in the “top-view” orientation to examine arbors along the retinotopic axes and rotated to examine axons along the laminar axis.
The tectal neuropil of zebrafish contains four retinorecipient zones: the stratum opticum (SO), SFGS, stratum griseum centrale (SGC), and a layer situated at the boundary between the stratum album centrale and the stratum periventriculare (SAC/SPV) (Meek, 1983; Xiao et al., 2005). The majority of retinal inputs innervate the SO and SFGS layers. Non-retinorecipient layers are located on either side of the SGC, separating the SGC from the SAC/SPV and the SFGS, respectively. Rotation of confocal image volumes with dense RGC labeling allowed us to measure the thickness of these retinorecipient layers along the laminar axis (SO, 8.3 ± 0.3 μm; SFGS, 32.1 ± 0.8; SGC, 9.8 ± 0.6; SAC/SPV, 8.4 ± 0.4; n = 9 larvae; Fig. 1C). Detailed examination of Brainbow specimens with densely labeled neuropil suggested that the retinotectal projection is subdivided into multiple sublaminae (Fig. 1B,C). The total fluorescence intensity plot of this tectum (Fig. 1D, right) supports the presence of discrete layers in the SGC, SAC/SPV, and multiple positions within the SO and SFGS (indicated by black lines), as well as known retinorecipient regions devoid of labeling in this particular sample (gray lines). Fluorescence intensity plots in individual red (tdTomato), green (EYFP), and blue (Cerulean) color channels demonstrate the difference in fluorescent protein ratios at different laminar positions.
The sublaminar map is formed by thin, regularly spaced arbors
To directly examine whether the entire tectal neuropil could be divided into thin sublaminae, we analyzed the average thickness of retinal axon arbors throughout all layers of the tectum (5.2 ± 0.2 μm, n = 120). Based on the thickness of SFGS and SO, we subdivided the retinorecipient neuropil layers into 10 sublaminae: the SGC and SAC/SPV, which are discrete layers bordered by non-retinorecipient neuropil, two layers in the SO, and six layers in the SFGS. For statistical comparisons, groups of axons at different laminar depths were correspondingly binned into 1 of 10 sublaminar designations: SO1 and SO2, SFGS1–SFGS6, SGC, or SAC/SPV (see Materials and Methods). The presence of 10 distinct sublaminae is a close approximation, and future studies using more precise methods will be required to determine their exact number in the tectum.
To examine the spacing between axons within these laminar subdivisions, we examined larvae with sparse labeling (≤12 axons), which made it possible to trace the complex morphologies of multiple arbors in a small volume of tissue. A demonstration of this is presented in Figure 2, A and B, in which four axons with overlapping retinotopic arborization fields could easily be distinguished based on their unique color labels: orange, pink, cyan, and teal. These composite color labels were generated by different ratios of the three Brainbow fluorescent proteins, as shown in single-channel fluorescence intensity plots (Fig. 2C). The side-view rotation and fluorescence intensity plots revealed that axons in adjacent positions are oriented in parallel and generally exhibit regular spacing along the laminar axis. Analysis of the interpeak distance between axons assigned to adjacent sublaminae, such as the two pairs of axons in Figure 2A–C, revealed spacing that was similar to the average axon thickness (5.75 ± 0.51, n = 16 axon pairs). Morphological analysis of single axons in each sublamina revealed that the SO1, SO2, and SFGS1–SFGS6 layers contained axon arbors with average thicknesses between 4 and 6 μm, whereas the SGC and SAC/SPV layers contained axons between 6 and 7 μm thick (Fig. 2D). It should be noted that the variability we observe in both arbor thickness and sublaminar spacing suggest that the sublaminar map does exhibit a degree of overlap. However, the predominance of thin, regularly spaced arbors suggests that a large fraction of axons contribute to a precise sublaminar scaffold in the tectum.
Figure 2.
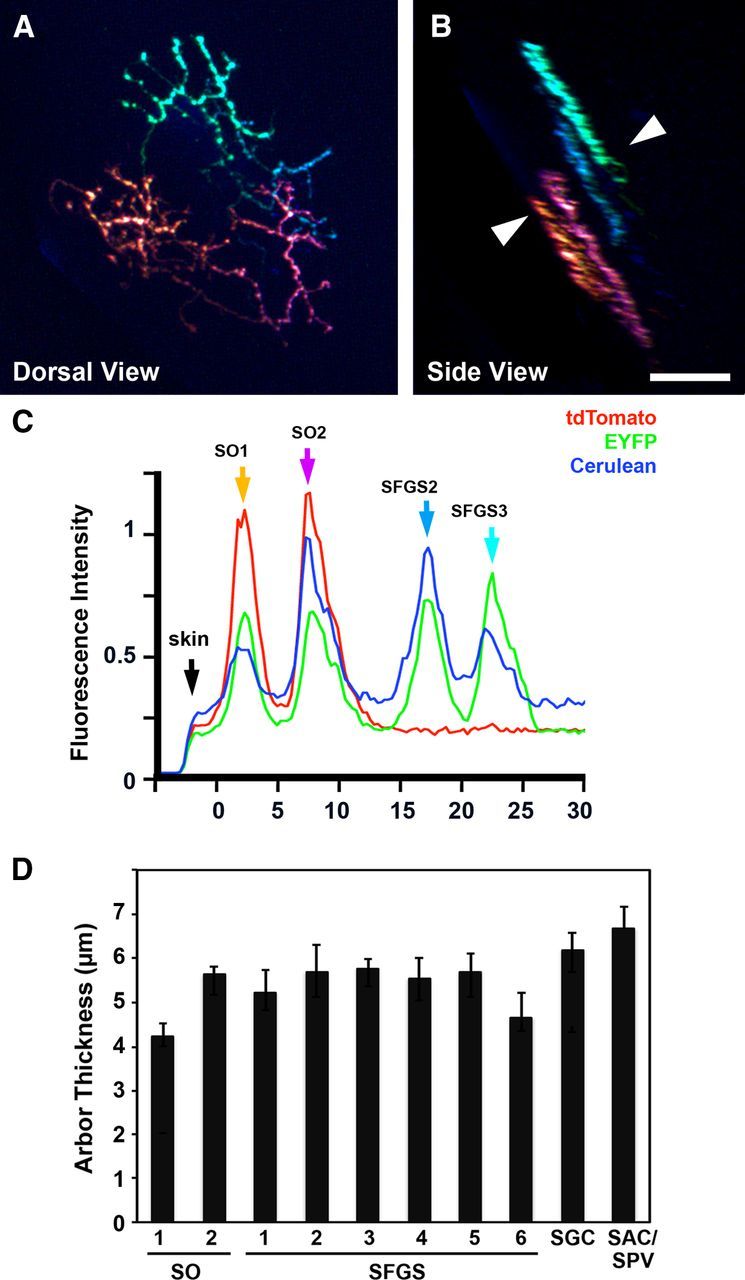
The retinotectal projection is organized into thin sublaminae. A, Top view of a 7 dpf larva with mosaic Brainbow labeling achieved by injection of islet2b:gal4 plasmid into UAS:Brainbow, hsp70:Cre embryos. In this sparsely labeled specimen, four axons with unique color profiles are labeled. B, Side view of image volume in A. Labeled axons were located in two pairs of adjacent sublaminae: SO1, SO2, SFGS2, and SFGS3. Note that the arbors have relatively uniform thicknesses and are aligned in parallel. C, RGB fluorescence intensity plot along line indicated by arrowheads in B. Arrows indicate the peak fluorescence for orange, magenta, cyan, and teal arbors, respectively. D, Average thickness for axons in each layer. Scale bars: A, B, represent 20 μm.
Sublaminae are formed by precise costratification of axons
In specimens with strong color diversity, it was possible to trace the complex morphologies of multiple arbors within a single sublamina. The image volume in Figure 3, A and B, presents an example of sparse labeling in which several sublaminae contain labeled axons and one of these layers, SO1, contains three arbors (yellow, teal, and red). A sublaminar region isolated from this volume by 3D clipping revealed the overlapping retinotopic arborization fields of these axons (Fig. 3C). A second example, shown in Figure 3, D and E, contains an SFGS sublamina in which five different axon regions could be distinguished based on their color profile. The sublaminar volume contains four spectrally distinct axon arbors in orange, cyan, magenta, and blue and a segment of green-labeled axon that arborized in an adjacent sublamina (Fig. 3F). The composite color labels generated by Brainbow were uniform throughout the axon, which allowed us to trace the fine morphology of arbors with the same sublaminar position and overlapping retinotopic arborization fields (Fig. 3G,I). It should be noted that the number or length of branches may be an underestimate because of cases in which every segment of an arbor could not be faithfully traced as a result of dim labeling (Fig. 3F, blue arbor). However, in samples with bright labeling and good color separation, we were able to confidently trace the full morphology of most arbors within a given sublaminar region (Fig. 3G, yellow and teal arbors; I, blue, cyan, and orange arbors). Precisely aligned groups of arbors were observed in every retinorecipient layer of the tectum (data not shown), suggesting that precise layering is formed through axon costratification.
Figure 3.
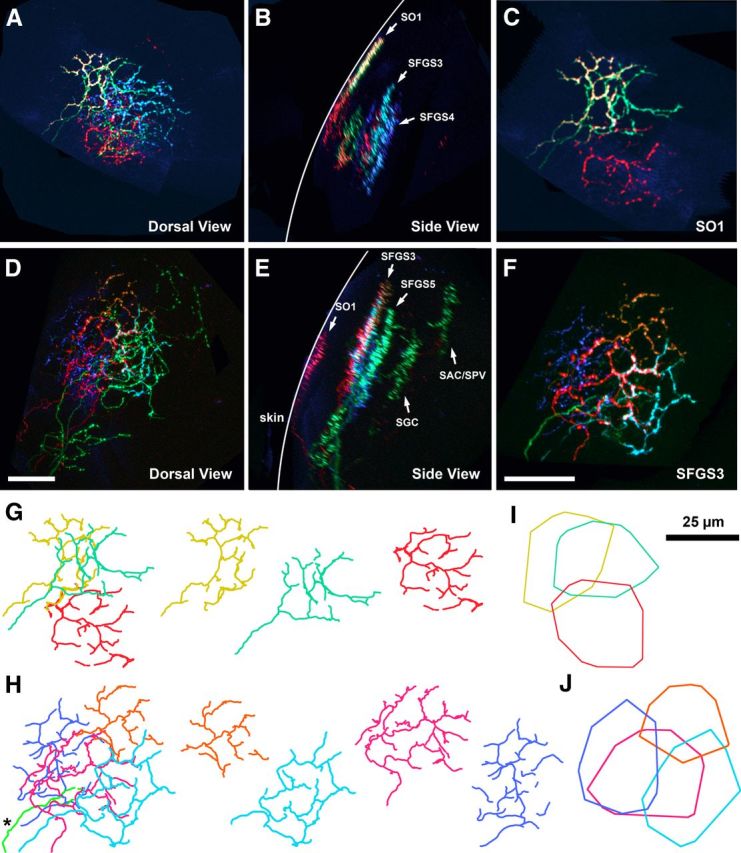
Precise lamination of multiple axons in the same sublamina. A, B, Top and side view of a tectum containing 10 labeled RGC axons. Note several precisely laminated groups of axons (arrows) present in several sublaminar positions. C, Top view of an excised volume containing only the SO1 region of volume in A and B. Note three axons with overlapping arborization fields and distinct composite color labels. Arrows indicate several laminated axons at different sublaminar positions. D, E, Top and side views of a tectum containing 10 labeled RGC axons. F, Top view of an excised volume containing only the SFGS3 region of volume in D and E. The volume contains four spectrally distinct axon arbors labeled in blue, orange, red, and cyan in addition to a segment of a green labeled axon that arborized in an adjacent lamina (asterisk). G, H, Line tracings of arbors in C and F. Individual tracings (right panels) show the fine morphology of each arbor. I, J, Convex polygons bounding the arbors in G and J. These areas were used to determine the retinotopic arborization field of single axons. Scale bars, 25 μm.
Although the development of retinotectal topography has been thoroughly characterized, there is little information on the degree of overlap between axon terminals. The ability to visualize groups of axons within small neuropil volumes allowed us to directly examine retinotopic overlap. Our identification of discrete sublaminae in the tectum suggests that the most informative overlap values are those between RGC axons in the same sublamina, because these are more likely to contact the same tectal neurons and interact with each other. To quantify retinotopic overlap, we measured the area of overlap between two arbors relative to the sum of the total area encompassed by the two arbor areas, in which perfect overlap is 100%. For example, the magenta and cyan axons in Figure 3, I and J, exhibited a degree of retinotopic overlap of 26.7%. The maximum value we observed was 77.1%, and values >40% were observed in several SO and SFGS sublaminae (data not shown and Fig. 6). Although the random nature of this labeling does not allow us to calculate the average overlap area within different layers, the maximum values observed suggest that a high degree of arbor overlap is a general feature of retinal afferents in the tectum.
Figure 6.
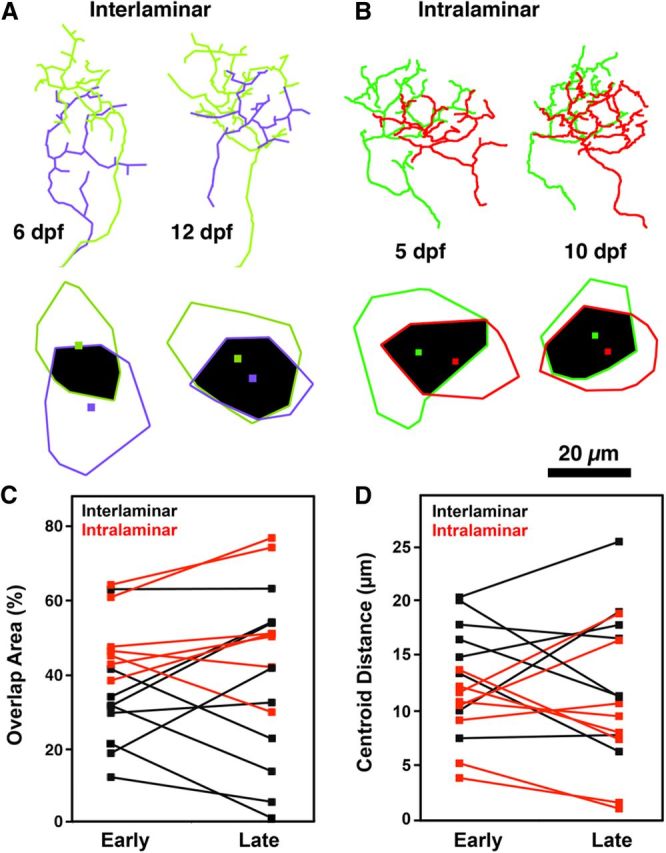
Retinotopic mapping is dynamic during early larval development. A, Line tracings of the yellow and purple arbors in Figure 5, A and B. Note changes in arbor morphology and increase in spatial overlap. Colored polygons correspond to the area occupied by each arbor, and the colored square within indicates the arbor centroid. Regions of arbor overlap are indicated by black. Note marked increase in arbor overlap and decrease in centroid distance. B, Line tracings of the green and red arbors in Figure 5, E and F. C, D, Quantification of developmental changes in overlap area and centroid distance for axon pairs innervating different (interlaminar) or identical (intralaminar) tectal sublaminae. Note that, in each case, both overlap and centroid distance are dynamic during larval development.
RGC axon laminar targeting is precise ab initio
RGC arbor morphology in the larval zebrafish is highly dynamic and arises through iterative extension and retraction of axonal branches (Hua et al., 2005; Meyer and Smith, 2006; Ben Fredj et al., 2010). The laminar precision we observe could arise ab initio (from the beginning) or through gradual refinement of an arbor that is initially only coarsely targeted. To visualize the process of RGC axon lamination, it was first necessary to confirm that unique color labels generated by Brainbow expression are stable enough to allow individual neurons to be monitored over time. For multi-day imaging, sparsely labeled larvae were immobilized, imaged, and subsequently returned to embryo-rearing solution. Repeated imaging at 1–2 d intervals between 5 and 12 dpf revealed only subtle changes in color labels, predominantly as a result of a decrease in fluorescence intensity of the Cerulean protein that is likely attributable to photobleaching (data not shown). However, in every larva with good initial color diversity, the reduction in Cerulean fluorescence did not impede our ability to identify the same neurons at each time point.
To determine whether RGC laminar position is achieved through gradual refinement, we examined RGC laminar profiles at early (4–6 dpf) and late (10–12 dpf) stages of retinal arborization. The majority of RGC arbors exhibited precise laminar targeting at the early time point (37 of 40 larvae examined; Fig. 4A–C, blue and teal arbors indicated by arrows) and did not further refine. Only three arbors imaged at the early time point had coarsely targeted arbors >10 μm thick, which likely spanned two or more sublaminae (Fig. 4G). Two of these arbors underwent a subsequent correction that resulted in a reduced final arbor thickness. In these cases, the refinement arose through a simultaneous increase in arbor density in one sublamina (Fig. 4D–F, arrowhead) and a decrease in the other. Cases such as this may represent a small RGC subpopulation that is delayed in sublaminar targeting or correction of rare targeting errors. We also observed one multi-laminar RGC arbor that did not undergo developmental refinement (data not shown). However, the rarity of these cases precluded additional examination. In summary, multi-day imaging revealed that, for the vast majority of RGCs, sublaminar targeting does not arise through overgrowth and selective pruning but rather through precise laminar targeting ab initio.
Figure 4.

The majority of RGC axons target specific sublaminae ab initio. A, Side view of an RGB image volume containing three RGC arbors labeled in red, blue, and teal. B, C, Grayscale images of green and blue channels in A. Note that both the blue and teal arbors are ∼5 μm thick in the synaptic plane (arrows). D–F, Grayscale images of red channel at 6, 8, and 10 dpf. Note that the initially bushy, diffuse arbor gradually becomes more refined through elaboration of the arbor region in the deeper laminar position (arrowhead) and a near-complete loss of branches in other regions. G, Change in arbor thicknesses for 40 RGC axons between early (4–6 dpf) and late (10–12 dpf) stages. Note that the majority of arbors do not significantly refine their laminar thickness. Red arrow indicates data points for axon shown in D–F. Scale bars, 25 μm.
The laminar map is invariant throughout early larval development
Multi-day imaging of sparse Brainbow labeling in the retinotectal projection revealed the time course by which RGC arbors adopt a thin, sublamina-specific morphology. However, it does not prove that the laminar map is fixed throughout early larval development. Individual axons maintain relatively thin arbors throughout this period but could shift in position relative to one another. To examine this possibility, we observed relative laminar positioning over time in larvae that contained multiple RGC arbors with unique color labels at different sublaminar positions. As shown in Figure 5A–D, the morphology and relative laminar position of arbors with unique color labels could be faithfully monitored between early and late time points. Although axon morphologies were dynamic, in every larvae analyzed, we found that there were only minor changes in the distance between pairs of arbors along the laminar axis (0.88 ± 0.12 μm, n = 26 axon pairs).
Figure 5.
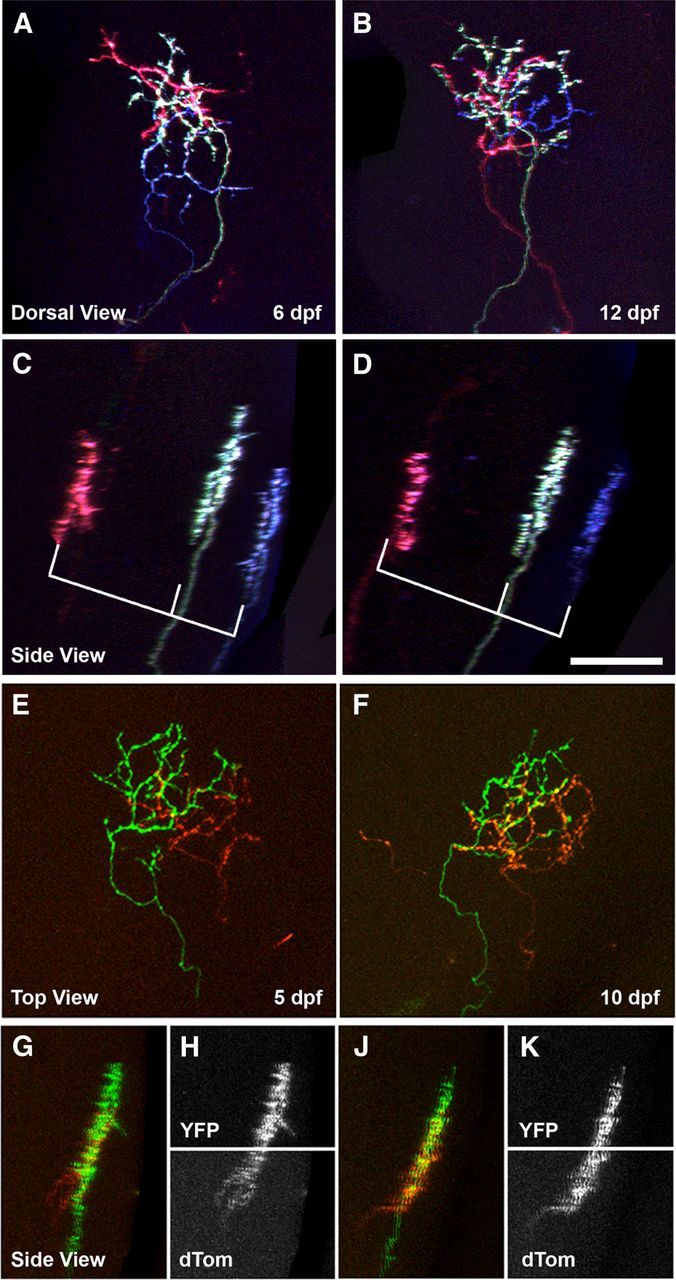
Laminar position is fixed throughout early larval development. A, B, Top views at 6 and 12 dpf of a tectum containing three RGC arbors with overlapping retinotopic positions: a magenta arbor, a yellow arbor, and a purple arbor. C, D, Side views of the image volumes in A and B show laminar position of the three RGC axons. Relative distances between the arbors, as indicated by brackets, do not change between time points. E, F, Top views at 5 and 10 dpf of an RGB image volume containing two RGC arbors innervating the same tectal sublamina with overlapping retinotopic positions: a green arbor and a red arbor. G–K, RGB and single-channel grayscale side views of image volume in E and F show that the identical laminar position of these RGCs is maintained from 5 to 10 dpf. Scale bar, 20 μm.
Although these findings suggest that the laminar map is stable during larval development, it does not exclude the possibility that preexisting sublaminae split to form two or more new layers. If this were true, we would expect to observe instances in which arbors initially innervating the same sublamina subsequently segregated to different laminar positions. We conducted multi-day imaging of larvae in which two RGC arbors with unique color labels innervated the same sublamina and overlapped in the retinotopic plane (Fig. 5E,F). Axons targeted to the same sublamina never segregated during the observation period (Fig. 5G–K; n = 8). Together, these findings indicate that, during early larval development, the positioning and axonal composition of sublaminae is invariant, ruling out a role for laminar translocation in axonal target field selection.
Dynamic changes in arbor morphology are restricted to the retinotopic axes
Previous studies of RGC axons during early larval development have indicated that retinal arbor morphology is highly dynamic. For example, as the zebrafish tectum increases in size, shifting of axon arbors in the posterior direction may function to preserve the visuotopic map (Xiao and Baier, 2007). There is also evidence suggesting that RGC axon arborization is influenced by activity-dependent processes (Hua et al., 2005; Smear et al., 2007; Ben Fredj et al., 2010). Although the evidence for retinotopic structural plasticity is very strong, previous studies did not examine the positions of multiple axons with respect to their sublaminar position. Examination of image volumes containing axons with different laminar positions and overlapping retinotopic arborization fields revealed that relative retinotopic position is highly dynamic (Fig. 6A). We used axonal tracings to determine changes in arbor overlap and in the distance between the centroids of the area of each arbor. This analysis revealed that alignment along the retinotopic axes could increase or decrease with similar likelihood (Fig. 6C,D). To exclude a model in which these changes reflect shifting of entire sublaminae relative to each other, we examined arbors occupying the same sublaminar position (Fig. 6B). Both area of overlap and centroid distance between such arbor pairs were highly dynamic and could increase or decrease (Fig. 6C,D). The fact that the degree of retinotopic overlap between neighboring axons in the same sublamina often increased argues against a simple model in which competition between retinal axons reduces arborization field overlap.
Multiple RGC types innervate each sublamina
The sublaminar map we identified could serve to sort axons based on the type of visual information they convey. Each tectal sublamina could serve a unique function by receiving visual information from a single RGC type. An extreme alternative is one in which each RGC type indiscriminately innervates sublaminae and functionally diverse circuits are established through selective synapse formation. Studies in the mouse retinocollicular projection have demonstrated that different types of RGCs have morphologically distinguishable axon terminals (Huberman et al., 2008, 2009; Kim et al., 2010; Hong et al., 2011). To further assess axonal morphology, we analyzed retinotopic arborization area and branch density of axons within each sublamina (Table 1). Morphometric analysis revealed that arbors in both SGC and SAC/SPV sublaminae contained arbors with significantly lower branch densities than those in SO1, SO2, and SFGS1–SFGS6 [one-way ANOVA (F(9,120) = 8.598, p = 0), followed by Tukey–Kramer post hoc test, p < 0.05]. However, there were no significant differences in laminar thickness [one-way ANOVA (F(9,161) = 2.108, p = 0.032), followed by Tukey–Kramer post hoc test, p > 0.05] or arbor area [one-way ANOVA (F(9,124) = 1.435, p = 0.18), followed by Tukey–Kramer post hoc test, p > 0.05]. We did observe a considerable degree of morphological variability within individual sublaminae, which could reflect innervation by multiple axon types with distinct morphologies.
Table 1.
Sublamina-specific morphological analysis of retinal arbors
| Tectal sublamina | Arbor thickness (μm) | Arbor area (μm2) | Branch density (per 1000 μm2) |
|---|---|---|---|
| SO1 (n = 18) | 4.24 ± 0.23 | 935.09 ± 85.14 | 16.81 ± 1.39 |
| SO2 (n = 21) | 5.76 ± 0.49 | 1255.9 ± 88.07 | 14.55 ± 0.82 |
| SFGS1 (n = 18) | 5.31 ± 0.41 | 1241.84 ± 92.75 | 16.64 ± 1.18 |
| SFGS2 (n = 15) | 5.77 ± 0.56 | 1200.29 ± 107.75 | 17.63 ± 1.05 |
| SFGS3 (n = 17) | 5.84 ± 0.39 | 1281.92 ± 154.72 | 14.94 ± 1.30 |
| SFGS4 (n = 21) | 5.62 ± 0.49 | 1456.6 ± 174.25 | 13.72 ± 0.78 |
| SFGS5 (n = 20) | 5.57 ± 0.43 | 1335.18 ± 111.51 | 14.59 ± 0.86 |
| SFGS6 (n = 21) | 4.73 ± 0.31 | 1251.2 ± 130.72 | 15.36 ± 0.96 |
| SGC (n = 18) | 6.34 ± 0.62 | 1336.96 ± 107.13 | 7.37 ± 0.54* |
| SGC (n = 13) | 6.68 ± 0.61 | 1038.49 ± 126.36 | 8.03 ± 0.56* |
Note differences in arbor area and branch density. All data are presented as mean ± SEM. One-way ANOVA (F(9,120) = 8.598, p = 0), followed by Tukey–Kramer post hoc test.
*p < 0.05.
To directly determine the RGC types that innervate specific sublaminae, we examined the stratification pattern of RGC dendrites in the retinal inner plexiform layer (IPL), which is a hallmark feature of RGC type identity. This analysis required aldehyde fixation and vibratome sectioning of the larval eyes. Brainbow labeling was not compatible with this treatment because of diminished fluorescence intensity after fixation and the inability to distinguish the different fluorescent proteins by immunofluorescent staining. Therefore, we genetically labeled single RGCs via coinjection of Isl2b:Gal4 and UAS:EGFP DNA constructs into wild-type embryos. Larvae containing a single labeled RGC were fixed, sectioned, and immunostained to correlate axon laminar position with RGC dendrite morphology in the IPL. In the adult zebrafish retina, dendritic morphology has been used to classify 11 RGC types based on dendritic morphology in the IPL (Mangrum et al., 2002; Ott et al., 2007). Based on these published nomenclatures, we grouped larval RGC cell types into six major classes: types 1/5/6, 2/3, 4, 7/8, 10, and 11. These major classes exhibit unique dendrite stratification patterns in the IPL, which most likely reflect distinct functional properties attributable to synaptic input from different subsets of bipolar and amacrine cells. The example presented in Figure 7, A and B, shows the tecta of two larvae, each with a single SO1 arbor positioned ∼2 μm from the tectal surface (Fig. 7C,D, arrows). Retrospective immunofluorescent labeling in the retina revealed that these axons originated from RGCs with different dendritic stratification patterns, one bistratified type 10 RGC (Fig. 7E) and one monostratified type 2/3 RGC with a dendrite targeting an OFF layer of the IPL (Fig. 7F). The example presented in Figure 7, G and H, is an image volume of a single tectum containing two distinct arbors that both innervate SFGS1. One of these axons originated from a monostratified type 4 RGC and the other from a bistratified type 10 RGC (Fig. 7I,J). These findings confirm that more than one type of RGC can innervate the same sublamina.
In total, retrospective cell type analysis was performed on 74 RGCs with axons innervating a single tectal sublamina. Overall, we found that 9 of the 10 tectal sublaminae are innervated by multiple RGC types (Fig. 7K), although it should be noted that sample sizes for SGC and SAC/SPV sublaminae were limited because of their sparse innervation. Furthermore, although our data indicate that each RGC class innervates multiple sublaminae, current estimates suggest that the number of RGC types in the vertebrate retina is >20 (Badea et al., 2009; Völgyi et al., 2009). Therefore, each class we defined most likely comprises multiple types, and we cannot rule out that single RGC types do, in fact, innervate single sublaminae. Our data also identify several sublaminae innervated by unique yet overlapping combinations of RGC types. For example, the SO1, SO2, and SFGS1 sublaminae were each innervated by two RGC types: type 10 bistratified RGCs and one additional RGC type, 1/5/6, 2/3, and 4, respectively. The data presented in Figure 7K suggest that differential innervation of sublaminae by each RGC types follows a stereotyped pattern. Alternatively, based on a merely qualitative inspection of the data, we could not rule out that the RGCs destined to project to the tectum make stochastic choices among individual sublaminae. Therefore, to exclude this possibility, we used Monte Carlo simulation to perform exact inference on this categorical dataset (Kruskal–Wallis test; for details, see Materials and Methods). This statistic yielded a significant two-sided p value of 0.013, which supports the existence of a stereotyped code for sublaminar innervation by RGC axons.
Sublamina-specific responses to visual stimulation
Our finding that unique combinations of RGC axons innervate each tectal sublamina suggests that these layers transmit different visual information to retinorecipient neurons in the tectum. To test this hypothesis, we conducted functional imaging of the retinotectal projection in larvae doubly transgenic for Atoh7:Gal4 and UAS:GCaMP3, which express the calcium indicator GCaMP3 in a majority of RGCs (Fig. 8A) but not in tectal neurons (Del Bene et al., 2010). Preliminary experiments established that a small moving bar near the center of the visual field evoked calcium responses in the neuropil more reliably than stationary flashing spots. A previous study demonstrated that a large percentage of tectal neurons are responsive to moving stimuli (Niell and Smith, 2005). The stimulus used in our study was a vertical gray bar ∼24° high and 1° wide moving horizontally back and forth across a black background at a speed of 16°/s. Stimulus presentation typically resulted in transient calcium elevations in multiple regions throughout the tectal neuropil (Fig. 8B–D). GCaMP3 fluorescence was not detectable in SGC or SAC/SPV, possibly because of the sparse innervation of these layers. Therefore, our analysis was restricted to the SO and SFGS layers, which contain the majority of retinal inputs (Meek, 1983). To compare between axonal ensembles at different laminar positions, we subdivided the GCaMP3-labeled neuropil into eight regions of equal thickness, which approximate the SO1, SO2, and SFGS1–SFGS6 designations used above.
Figure 8.

Functional characterization of sublaminar targeting by RGC types. A–C, Image showing the fluorescence of GCaMP3 in the tectal neuropil of an Atoh7:Gal4, UAS:GCaMP3 zebrafish larva. The surface of the tectum is to the top. B–D, Two-photon pseudocolored images acquired from a subregion of the tectal neuropil of a 7 dpf during baseline (B), at stimulus onset (“ON,” C), and after disappearance (“OFF,” D). E, Distribution of ON, OFF, and ON–OFF RGC axons in the neuropil detected in the experiment shown in B–D. F, Sample traces of ON, OFF, and ON–OFF ROIs taken from the tectum shown in A–D. G, Quantification of percentage ON, OFF, and ON–OFF RGC inputs along the laminar axis. Error bars represent SEM. Numbers in A, E, and G represent approximate sublaminar divisions of the tectal neuropil from most superficial (1) to the deepest (8) layer of the SFGS. Scale bar: A–E, 10 μm.
GCaMP3 fluorescence intensity changes were often detected at stimulus onset and/or stimulus offset, and these temporally separated responses were used to categorize subregions of the neuropil as ON, OFF, or ON–OFF (Fig. 8E,F). Because of the nature of the visual stimulus used (moving bar with a leading and a trailing edge), these classifications do not necessarily fit the classical categorization of ON, OFF, and ON–OFF RGCs but rather are meant to reflect the general responses of RGC axons to the appearance or disappearance of the stimulus. Our analysis revealed that ON, OFF, and ON–OFF responsive regions were present in every retinorecipient layer. However, these classes of inputs were not equally distributed among tectal sublaminae (Fig. 8G). Notably, there were opposing gradients of ON and OFF inputs, with ON responses predominant in superficial sublaminae, whereas OFF responses were predominant in deep sublaminae. ON–OFF inputs were predominant in intermediate sublaminae. The combination of these three gradients resulted in each layer having a distinct functional identity as a result of its particular ratio of ON, OFF, and ON–OFF responsive subregions (F(14,336) = 12.57, p = 0, two-way ANOVA, class × layer interaction). For example, the two most superficial layers contained predominantly ON inputs, whereas the two deepest layers contained primarily OFF inputs. In multiple instances, directly adjacent layers differed in their relative ratios of ON, OFF, and ON–OFF inputs received. Together, these findings confirm that anatomically defined sublaminae exhibit different responses to visual stimuli.
Discussion
This study has revealed that the retinotectal projection of larval zebrafish is anatomically and functionally divided into fine sublaminae. Previous studies demonstrated that a subpopulation of RGCs labeled by a pou4f3 transgene form thin, planar arbors during tectal innervation (Xiao and Baier, 2007; Gosse et al., 2008). We substantially extended these findings by demonstrating that lamination serves to spatially segregate inputs from RGC afferents based on the type of information they convey. Groups of axons precisely costratify to form individual sublaminae, each a two-dimensional representation of the visual field. Furthermore, these parallel retinotopic maps are formed by axons originating from multiple different combinations of RGC types. However, our cell-type classification is an underestimate of RGC diversity. Vertebrate retinas contain >20 distinct RGC types (Masland, 2001; Mangrum et al., 2002; Rockhill et al., 2002; Badea et al., 2009; Völgyi et al., 2009; Hong et al., 2011). It is possible that specific RGC subtypes within these major RGC classes do target a single sublamina. However, we can exclude that individual sublaminae receive input from a single RGC type. Future studies will enable us to further differentiate RGC classes based on additional criteria, such as differential expression of molecular markers and distinct visual response properties.
Lamina-restricted axon terminals have been described in the tectum/SC of several mammalian and avian species (Sachs et al., 1986; Inoue and Sanes, 1997; May, 2006; Huberman et al., 2008, 2009; Kim et al., 2010). In the mouse, RGC axons can adopt lamina-restricted projections through either accurate targeting or gradual refinement of an initially broad arbor (Huberman et al., 2008; Kim et al., 2010). Multi-day imaging of individual larvae allowed us to accurately monitor relative laminar positions in vivo during a stage of development characterized by dynamic changes in the morphology of RGC arbors (5–12 dpf; Hua et al., 2005; Meyer and Smith, 2006; Ben Fredj et al., 2010). Our data reveal that the vast majority of axon arbors do not translocate along the laminar axis, thereby maintaining the relative laminar positions established during initial innervation (Fig. 9). It is surprising that the tectal sublaminar map is not further refined during early larval development given that, during this period, the retinal IPL is expanding and RGC dendrites are increasing in complexity to target newly formed laminae (Mumm et al., 2006). Given the strong evidence that some types of RGC axons in the mouse SC concurrently undergo laminar and retinotopic refinement (Simon and O'Leary, 1992; Huberman et al., 2008; Kim et al., 2010), this may represent a fundamental difference in the lamination process of RGC axons in the zebrafish tectum compared with the mouse SC. However, in both systems, RGC axon lamination does not require visually evoked or spontaneous activity (Huberman et al., 2008; Nevin et al., 2008). Furthermore, our analysis of laminar innervation patterns of different RGC classes is generally consistent with RGC-type-specific lamination in the mammalian SC described by Hong et al. (2011), although additional work will be required to determine the precise number of RGC types in the zebrafish and make functional correlations with identified RGC types in mouse.
Figure 9.

RGC axonal arborization field selection during larval development. Schematic depicting the process of RGC axon arborization along both the retinotopic and laminar axes. A, Lamina selection occurs during initial growth into the tectum. The axons of RGC types with different dendritic morphologies in the IPL (labeled red, green, and blue) select specific retinotopic and sublaminar positions within the retinorecipient layers of the tectum (SO, SFGS, SGC, SAC/SPV). Note that the red and green axons costratify in the most superficial sublamina of SFGS. B, Subsequently, the relative laminar positions between these axons is maintained as axons form branched, planar arbors. Concurrently, some tectal neurons extend dendrites that target specific sublaminae (cell in black) also form arbors in specific sublaminae. C, This initial arborization is followed by a period during which relative laminar positions remain unchanged, whereas iterative retinotopic refinements occur in parallel.
Numerous studies have reported that retinal axon arbors are highly dynamic during development and that their branching and growth is influenced by neuronal activity (Hua et al., 2005; Smear et al., 2007; Ben Fredj et al., 2010). In the mammalian retinocollicular projection, axons initially overshoot their appropriate retinotopic position and subsequently prune excessive branches in a process that requires spontaneous retinal waves (McLaughlin et al., 2003). Our findings demonstrate that retinal arbors invariably shift their relative retinotopic positions while maintaining a fixed laminar position. One mechanism that has been postulated to underlie retinotopic map refinement is competition between RGC axons for postsynaptic targets. Although there is evidence that competition between neighboring axon arbors influences retinal arbor size and complexity (Hua et al., 2005; Ben Fredj et al., 2010), previous studies did not examine the relative laminar position of imaged axons. Our data suggest that these competitive interactions are most likely to occur among axons in the same sublamina. The fact that degree of overlap between axon pairs in the same sublamina can be large, and often increase during development, rules out simple models in which retinal arbors contract to effectively tile the retinorecipient neuropil. However, individual sublaminae are innervated by multiple RGC types; therefore, we cannot exclude the possibility that axons of the same type form non-overlapping mosaics.
Our data indicate that the precise layering of the zebrafish retinotectal projection is generated by the costratification of axons from multiple RGC types. This precision is matched by the dendritic morphologies of several identified neuron types in the tectum (Scott and Baier, 2009; Del Bene et al., 2010; Robles et al., 2011; Gabriel et al., 2012). This is in contrast to observations in the SC of nocturnal rodents, in which both retinal arbors (Hong et al., 2011) and collicular neuron dendrites (Mooney et al., 1984; Lee et al., 1997; Endo and Isa, 2001) are more diffusely targeted. In each system, appropriate connections between retinal axons and retinorecipient neurons are likely formed through targeted lamination in conjunction with selective synapse formation (Huberman et al., 2010). Our data support a model in which accurate circuit formation in the visual system of zebrafish relies more heavily on laminar precision than that of rodents. This suggests that, in fish, the morphology of tectal neuron dendrites may directly reflect the complement of retinal inputs it receives. For example, we previously characterized a class of bistratified periventricular interneuron (bsPVIN) that forms a precisely stratified dendritic arbor within the most superficial layer of the SFGS (Robles et al., 2011). Based on our present findings, we predict that inputs from RGCs of classes 4 and 10 specifically converge onto bsPVIN dendrites (Fig. 9). However, the tectum also contains neurons with dendrites spanning multiple sublaminae (Scott and Baier, 2009; Robles et al., 2011), suggesting that tectal dendrite lamination may reflect the diversity of inputs a neuron receives.
It is well established in various vertebrate species that RGC types classified by dendritic morphology have distinct physiological properties (for review, see Masland, 2001). Calcium imaging of retinal arbors in the tectum confirmed that tectal sublaminae exhibit divergent responses to a small moving stimulus, which provides a functional correlate to their distinct innervation patterns. Our findings are consistent with recent studies examining the organization of direction- and orientation-selective retinal inputs along the laminar axis of the tectum (Gabriel et al., 2012; Nikolaou et al., 2012). Specifically, these experiments revealed that the SO and superficial SFGS preferentially receive direction-selective inputs. Our data provide an anatomical basis for these spatially segregated functional responses, because these layers receive input from bistratified type 10 RGCs, which are morphologically similar to direction-selective ganglion cells in mammals (for review, see Wei and Feller, 2011; Vaney et al., 2012). Together, these findings reveal parallel functional maps in the tectum that are generated by stereotyped patterns of RGC axon lamination. The early formation of these functionally divergent layers suggests an essential role in the development of tectal neuron response properties (Niell and Smith, 2005). Furthermore, the stability of these sublaminae in the presence of tectal neurons with lamina-restricted dendrites (Robles et al., 2011) suggests a model in which the type of inputs onto tectal neurons is constant, whereas the retinotopic precision of these inputs is improving. Such refinements can reduce the size of tectal neuron receptive fields and thereby increase visual acuity (Smear et al., 2007). This is consonant with the finding that, between 4 and 9 dpf, tectal neurons exhibit a robust increase in responsiveness to small spots (Niell and Smith, 2005). Our findings predict that, during this developmental window, subpopulations of neurons become tuned to smaller objects without changes in responsiveness to other stimulus features.
The identification of rules governing the spatial organization of retinal afferents is a necessary step toward understanding how visual information is processed. Neural maps of sensory input to the brain can be either continuous or discrete (Luo and Flanagan, 2007). The visual pathway harbors both types of maps. The retinotopic map preserves the spatial order of inputs in the tectum and is therefore continuous, whereas the discrete laminar map we identified is generated by cell-type-specific lamination.
Footnotes
This work was supported by the Max Planck Society, the National Science Foundation, and Ford Foundation postdoctoral fellowships (E.R.), an EMBO long-term fellowship (A.F.), and National Institutes of Health Grants EY12406 and EY13855 (H.B.). Experiments were initiated at the University of California, San Francisco and concluded at the Max Planck Institute of Neurobiology. We are grateful to members of the Baier laboratory for critical reading of this manuscript and Joe Donovan for assistance with Monte Carlo simulation.
References
- Badea TC, Cahill H, Ecker J, Hattar S, Nathans J. Distinct roles of transcription factors brn3a and brn3b in controlling the development, morphology, and function of retinal ganglion cells. Neuron. 2009;61:852–864. doi: 10.1016/j.neuron.2009.01.020. [DOI] [PMC free article] [PubMed] [Google Scholar]
- Ben Fredj N, Hammond S, Otsuna H, Chien CB, Burrone J, Meyer MP. Synaptic activity and activity-dependent competition regulates axon arbor maturation, growth arrest, and territory in the retinotectal projection. J Neurosci. 2010;30:10939–10951. doi: 10.1523/JNEUROSCI.1556-10.2010. [DOI] [PMC free article] [PubMed] [Google Scholar]
- Campbell DS, Stringham SA, Timm A, Xiao T, Law MY, Baier H, Nonet ML, Chien CB. Slit1a inhibits retinal ganglion cell arborization and synaptogenesis via Robo2-dependent and -independent pathways. Neuron. 2007;55:231–245. doi: 10.1016/j.neuron.2007.06.034. [DOI] [PubMed] [Google Scholar]
- Card JP, Kobiler O, McCambridge J, Ebdlahad S, Shan Z, Raizada MK, Sved AF, Enquist LW. Microdissection of neural networks by conditional reporter expression from a Brainbow herpesvirus. Proc Natl Acad Sci U S A. 2011;108:3377–3382. doi: 10.1073/pnas.1015033108. [DOI] [PMC free article] [PubMed] [Google Scholar]
- Del Bene F, Wyart C, Robles E, Tran A, Looger L, Scott EK, Isacoff EY, Baier H. Filtering of visual information in the tectum by an identified neural circuit. Science. 2010;330:669–673. doi: 10.1126/science.1192949. [DOI] [PMC free article] [PubMed] [Google Scholar]
- Dombeck DA, Khabbaz AN, Collman F, Adelman TL, Tank DW. Imaging large-scale neural activity with cellular resolution in awake, mobile mice. Neuron. 2007;56:43–57. doi: 10.1016/j.neuron.2007.08.003. [DOI] [PMC free article] [PubMed] [Google Scholar]
- Endo T, Isa T. Functionally different AMPA-type glutamate receptors in morphologically identified neurons in rat superficial superior colliculus. Neuroscience. 2001;108:129–141. doi: 10.1016/s0306-4522(01)00407-9. [DOI] [PubMed] [Google Scholar]
- Gabriel JP, Trivedi CA, Maurer CM, Ryu S, Bollmann JH. Layer-specific targeting of direction-selective neurons in the zebrafish optic tectum. Neuron. 2012;76:1147–1160. doi: 10.1016/j.neuron.2012.12.003. [DOI] [PubMed] [Google Scholar]
- Gosse NJ, Nevin LM, Baier H. Retinotopic order in the absence of axon competition. Nature. 2008;452:892–895. doi: 10.1038/nature06816. [DOI] [PMC free article] [PubMed] [Google Scholar]
- Hadjieconomou D, Rotkopf S, Alexandre C, Bell DM, Dickson BJ, Salecker I. Flybow: genetic multicolor cell labeling for neural circuit analysis in Drosophila melanogaster. Nat Methods. 2011;8:260–266. doi: 10.1038/nmeth.1567. [DOI] [PubMed] [Google Scholar]
- Hampel S, Chung P, McKellar CE, Hall D, Looger LL, Simpson JH. Drosophila Brainbow: a recombinase-based fluorescence labeling technique to subdivide neural expression patterns. Nat Methods. 2011;8:253–259. doi: 10.1038/nmeth.1566. [DOI] [PMC free article] [PubMed] [Google Scholar]
- Hong YK, Kim IJ, Sanes JR. Stereotyped axonal arbors of retinal ganglion cell subsets in the mouse superior colliculus. J Comp Neurol. 2011;519:1691–1711. doi: 10.1002/cne.22595. [DOI] [PMC free article] [PubMed] [Google Scholar]
- Hua JY, Smear MC, Baier H, Smith SJ. Regulation of axon growth in vivo by activity-based competition. Nature. 2005;434:1022–1026. doi: 10.1038/nature03409. [DOI] [PubMed] [Google Scholar]
- Huberman AD, Manu M, Koch SM, Susman MW, Lutz AB, Ullian EM, Baccus SA, Barres BA. Architecture and activity-mediated refinement of axonal projections from a mosaic of genetically identified retinal ganglion cells. Neuron. 2008;59:425–438. doi: 10.1016/j.neuron.2008.07.018. [DOI] [PMC free article] [PubMed] [Google Scholar]
- Huberman AD, Wei W, Elstrott J, Stafford BK, Feller MB, Barres BA. Genetic identification of an On-Off direction-selective retinal ganglion cell subtype reveals a layer-specific subcortical map of posterior motion. Neuron. 2009;62:327–334. doi: 10.1016/j.neuron.2009.04.014. [DOI] [PMC free article] [PubMed] [Google Scholar]
- Huberman AD, Clandinin TR, Baier H. Molecular and cellular mechanisms of lamina-specific axon targeting. Cold Spring Harb Perspect Biol. 2010;2:a001743. doi: 10.1101/cshperspect.a001743. [DOI] [PMC free article] [PubMed] [Google Scholar]
- Inoue A, Sanes JR. Lamina-specific connectivity in the brain: regulation by N-cadherin, neurotrophins, and glycoconjugates. Science. 1997;276:1428–1431. doi: 10.1126/science.276.5317.1428. [DOI] [PubMed] [Google Scholar]
- Kim IJ, Zhang Y, Meister M, Sanes JR. Laminar restriction of retinal ganglion cell dendrites and axons: subtype-specific developmental patterns revealed with transgenic markers. J Neurosci. 2010;30:1452–1462. doi: 10.1523/JNEUROSCI.4779-09.2010. [DOI] [PMC free article] [PubMed] [Google Scholar]
- Le X, Langenau DM, Keefe MD, Kutok JL, Neuberg DS, Zon LI. Heat shock-inducible Cre/Lox approaches to induce diverse types of tumors and hyperplasia in transgenic zebrafish. Proc Natl Acad Sci U S A. 2007;104:9410–9415. doi: 10.1073/pnas.0611302104. [DOI] [PMC free article] [PubMed] [Google Scholar]
- Lee PH, Helms MC, Augustine GJ, Hall WC. Role of intrinsic synaptic circuitry in collicular sensorimotor integration. Proc Natl Acad Sci U S A. 1997;94:13299–13304. doi: 10.1073/pnas.94.24.13299. [DOI] [PMC free article] [PubMed] [Google Scholar]
- Livet J, Weissman TA, Kang H, Draft RW, Lu J, Bennis RA, Sanes JR, Lichtman JW. Transgenic strategies for combinatorial expression of fluorescent proteins in the nervous system. Nature. 2007;450:56–62. doi: 10.1038/nature06293. [DOI] [PubMed] [Google Scholar]
- Luo L, Flanagan JG. Development of continuous and discrete neural maps. Neuron. 2007;56:284–300. doi: 10.1016/j.neuron.2007.10.014. [DOI] [PubMed] [Google Scholar]
- Mangrum WI, Dowling JE, Cohen ED. A morphological classification of ganglion cells in the zebrafish retina. Vis Neurosci. 2002;19:767–779. doi: 10.1017/s0952523802196076. [DOI] [PubMed] [Google Scholar]
- Masland RH. The fundamental plan of the retina. Nat Neurosci. 2001;4:877–886. doi: 10.1038/nn0901-877. [DOI] [PubMed] [Google Scholar]
- May PJ. The mammalian superior colliculus: laminar structure and connections. Prog Brain Res. 2006;151:321–378. doi: 10.1016/S0079-6123(05)51011-2. [DOI] [PubMed] [Google Scholar]
- McLaughlin T, O'Leary DD. Molecular gradients and development of retinotopic maps. Annu Rev Neurosci. 2005;28:327–355. doi: 10.1146/annurev.neuro.28.061604.135714. [DOI] [PubMed] [Google Scholar]
- McLaughlin T, Torborg CL, Feller MB, O'Leary DD. Retinotopic map refinement requires spontaneous retinal waves during a brief critical period of development. Neuron. 2003;40:1147–1160. doi: 10.1016/s0896-6273(03)00790-6. [DOI] [PubMed] [Google Scholar]
- Meek J. Functional anatomy of the tectum mesencephali of the goldfish. An explorative analysis of the functional implications of the laminar structural organization of the tectum. Brain Res. 1983;287:247–297. doi: 10.1016/0165-0173(83)90008-5. [DOI] [PubMed] [Google Scholar]
- Meyer MP, Smith SJ. Evidence from in vivo imaging that synaptogenesis guides the growth and branching of axonal arbors by two distinct mechanisms. J Neurosci. 2006;26:3604–3614. doi: 10.1523/JNEUROSCI.0223-06.2006. [DOI] [PMC free article] [PubMed] [Google Scholar]
- Mooney RD, Klein BG, Jacquin MF, Rhoades RW. Dendrites of deep layer, somatosensory superior collicular neurons extend into the superficial laminae. Brain Res. 1984;324:361–365. doi: 10.1016/0006-8993(84)90050-7. [DOI] [PubMed] [Google Scholar]
- Mumm JS, Williams PR, Godinho L, Koerber A, Pittman AJ, Roeser T, Chien CB, Baier H, Wong RO. In vivo imaging reveals dendritic targeting of laminated afferents by zebrafish retinal ganglion cells. Neuron. 2006;52:609–621. doi: 10.1016/j.neuron.2006.10.004. [DOI] [PMC free article] [PubMed] [Google Scholar]
- Nevin LM, Taylor MR, Baier H. Hardwiring of fine synaptic layers in the zebrafish visual pathway. Neural Dev. 2008;3:36. doi: 10.1186/1749-8104-3-36. [DOI] [PMC free article] [PubMed] [Google Scholar]
- Nevin LM, Robles E, Baier H, Scott EK. Focusing on optic tectum circuitry through the lens of genetics. BMC Biol. 2010;8:126. doi: 10.1186/1741-7007-8-126. [DOI] [PMC free article] [PubMed] [Google Scholar]
- Niell CM, Smith SJ. Functional imaging reveals rapid development of visual response properties in the zebrafish tectum. Neuron. 2005;45:941–951. doi: 10.1016/j.neuron.2005.01.047. [DOI] [PubMed] [Google Scholar]
- Nikolaou N, Lowe AS, Walker AS, Abbas F, Hunter PR, Thompson ID, Meyer MP. Parametric functional maps of visual inputs to the tectum. Neuron. 2012;76:317–324. doi: 10.1016/j.neuron.2012.08.040. [DOI] [PMC free article] [PubMed] [Google Scholar]
- Ott M, Walz BC, Paulsen UJ, Mack AF, Wagner HJ. Retinotectal ganglion cells in the zebrafish, Danio rerio. J Comp Neurol. 2007;501:647–658. doi: 10.1002/cne.21269. [DOI] [PubMed] [Google Scholar]
- Pan YA, Livet J, Sanes JR, Lichtman JW, Schier AF. Multicolor Brainbow imaging in zebrafish. Cold Spring Harb Protoc. 2011;2011 doi: 10.1101/pdb.prot5546. pdb.prot5546. [DOI] [PMC free article] [PubMed] [Google Scholar]
- Pittman AJ, Law MY, Chien CB. Pathfinding in a large vertebrate axon tract: isotypic interactions guide retinotectal axons at multiple choice points. Development. 2008;135:2865–2871. doi: 10.1242/dev.025049. [DOI] [PMC free article] [PubMed] [Google Scholar]
- Pologruto TA, Sabatini BL, Svoboda K. ScanImage: flexible software for operating laser scanning microscopes. Biomed Eng Online. 2003;2:13. doi: 10.1186/1475-925X-2-13. [DOI] [PMC free article] [PubMed] [Google Scholar]
- Ramón y Cajal S. Histology of the nervous system of man and vertebrates. New York: Oxford UP; 1995. [Google Scholar]
- Robles E, Smith SJ, Baier H. Characterization of genetically targeted neuron types in the zebrafish optic tectum. Front Neural Circuits. 2011;5:1. doi: 10.3389/fncir.2011.00001. [DOI] [PMC free article] [PubMed] [Google Scholar]
- Rockhill RL, Daly FJ, MacNeil MA, Brown SP, Masland RH. The diversity of ganglion cells in a mammalian retina. J Neurosci. 2002;22:3831–3843. doi: 10.1523/JNEUROSCI.22-09-03831.2002. [DOI] [PMC free article] [PubMed] [Google Scholar]
- Sachs GM, Jacobson M, Caviness VS., Jr Postnatal changes in arborization patterns of murine retinocollicular axons. J Comp Neurol. 1986;246:395–408. doi: 10.1002/cne.902460308. [DOI] [PubMed] [Google Scholar]
- Scott EK, Baier H. The cellular architecture of the larval zebrafish tectum, as revealed by gal4 enhancer trap lines. Front Neural Circuits. 2009;3:13. doi: 10.3389/neuro.04.013.2009. [DOI] [PMC free article] [PubMed] [Google Scholar]
- Simon DK, O'Leary DD. Development of topographic order in the mammalian retinocollicular projection. J Neurosci. 1992;12:1212–1232. doi: 10.1523/JNEUROSCI.12-04-01212.1992. [DOI] [PMC free article] [PubMed] [Google Scholar]
- Smear MC, Tao HW, Staub W, Orger MB, Gosse NJ, Liu Y, Takahashi K, Poo MM, Baier H. Vesicular glutamate transport at a central synapse limits the acuity of visual perception in zebrafish. Neuron. 2007;53:65–77. doi: 10.1016/j.neuron.2006.12.013. [DOI] [PMC free article] [PubMed] [Google Scholar]
- Straw AD. Vision egg: an open-source library for realtime visual stimulus generation. Front Neuroinform. 2008;2:4. doi: 10.3389/neuro.11.004.2008. [DOI] [PMC free article] [PubMed] [Google Scholar]
- Vaney DI, Sivyer B, Taylor WR. Direction selectivity in the retina: symmetry and asymmetry in structure and function. Nat Rev Neurosci. 2012;13:194–208. doi: 10.1038/nrn3165. [DOI] [PubMed] [Google Scholar]
- Völgyi B, Chheda S, Bloomfield SA. Tracer coupling patterns of the ganglion cell subtypes in the mouse retina. J Comp Neurol. 2009;512:664–687. doi: 10.1002/cne.21912. [DOI] [PMC free article] [PubMed] [Google Scholar]
- Wang L, Sarnaik R, Rangarajan K, Liu X, Cang J. Visual receptive field properties of neurons in the superficial superior colliculus of the mouse. J Neurosci. 2010;30:16573–16584. doi: 10.1523/JNEUROSCI.3305-10.2010. [DOI] [PMC free article] [PubMed] [Google Scholar]
- Weber T, Böhm G, Hermann E, Schütz G, Schönig K, Bartsch D. Inducible gene manipulations in serotonergic neurons. Front Mol Neurosci. 2009;2:24. doi: 10.3389/neuro.02.024.2009. [DOI] [PMC free article] [PubMed] [Google Scholar]
- Wei W, Feller MB. Organization and development of direction-selective circuits in the retina. Trends Neurosci. 2011;34:638–645. doi: 10.1016/j.tins.2011.08.002. [DOI] [PMC free article] [PubMed] [Google Scholar]
- Xiao T, Baier H. Lamina-specific axonal projections in the zebrafish tectum require the type IV collagen Dragnet. Nat Neurosci. 2007;10:1529–1537. doi: 10.1038/nn2002. [DOI] [PubMed] [Google Scholar]
- Xiao T, Roeser T, Staub W, Baier H. A GFP-based genetic screen reveals mutations that disrupt the architecture of the zebrafish retinotectal projection. Development. 2005;132:2955–2967. doi: 10.1242/dev.01861. [DOI] [PubMed] [Google Scholar]
- Xiao T, Staub W, Robles E, Gosse NJ, Cole GJ, Baier H. Assembly of lamina-specific neuronal connections by slit bound to type IV collagen. Cell. 2011;146:164–176. doi: 10.1016/j.cell.2011.06.016. [DOI] [PMC free article] [PubMed] [Google Scholar]