

Abstract
Despite a known optimal treatment protocol for the management of glioblastoma multiforme (GBM), many patients fail to receive complete surgical resection or postoperative radiation therapy (PORT). The underlying reasons behind this disparity are unclear. Our study investigates the influence of regional health system resources on the surgical management and PORT receipt in patients with GBM. Surgical intervention, PORT receipt and patient data for patients diagnosed with GBM were obtained from the years 2004 to 2008 from the NCI Surveillance, Epidemiology, and End Results database and combined with the health system data from the Area Resource File. Four logistic models were constructed to test the effect of health system characteristics on surgical treatment choice and PORT receipt among health service areas (HSAs). We found that younger, married patients in HSAs with higher median incomes were significantly more likely to receive both gross total resection (p < 0.001, p < 0.001, p = 0.002) and PORT (p < 0.001, p < 0.001, p = 0.008). The density of radiation oncology equipped hospitals was also a significant predictor of PORT receipt (p = 0.002). Our findings suggest regional variations in of neuro-oncology services and income may have impact on GBM management. Policies aimed at narrowing disparities in treatment may need to focus on addressing regional variations in oncology resources.
Keywords: Glioblastoma multiforme, SEER, Radiation therapy, Health system
Introduction
Glioblastoma multiforme (GBM) is the most common primary brain tumor in adults and continues to carry a very poor prognosis with a median survival of approximately 1 year [1]. The current standard of treatment for GBM includes maximal surgical resection followed by postoperative radiation therapy (PORT) in combination with chemotherapy [2]. Despite an established optimal treatment protocol, some patients with GBM fail to receive complete surgical resection or PORT, highlighting a concerning gap in treatment. The underlying reasons behind the disparity in treatment are poorly understood, but are particularly troubling given the high mortality rate associated with GBM.
The influence of regional healthcare systems on cancer care is becoming increasingly recognized. Specifically, physician density has been shown to influence health outcomes in a variety of diseases, [3-6] and evidence suggests that the density of primary care physicians may be particularly important for reducing cardiovascular and cancer mortality rates [7]. Moreover, recently proposed healthcare reform legislation has placed a new focus on assessing the adequacy of the supply and geographic distribution of the physician workforce [8]. Significant and persistent geographical maldistribution of oncologic specialists and health resources have been associated with variations in treatment patterns as well as clinical outcomes, and highlight a potential driver of cancer related disparities [9-11]. At a time when the US health care system is in flux, a deeper understanding of how the distribution of specialists and oncology centers influence cancer treatment may be helpful for developing policies that promote better patient outcomes. Our study investigates the influence of regional health system resources on the surgical management of GBM and receipt of PORT following surgery.
Methods
Data sources and study sample
There were two primary data sources utilized in this study. Clinical data was derived from the National Cancer Institute’s Surveillance, Epidemiology, and End Results (SEER) public-use database. The SEER dataset covers approximately 26 % of the United States from 17 cancer registries [9]. The dataset provides clinical information including, patient age, gender, race, marital status, histology, initial treatment and overall survival. The study sample included patients within the SEER dataset aged 18 years of older with GBM (International Classification of Diseases for Oncology, Version 3 histology codes 9440–9442) diagnosed between the years 2004 and 2008. Patient data of interest included patient age, race and marital status. Clinical data studied included type of surgical intervention and whether the patient received post-operative external-beam radiation therapy.
Health system data was obtained from the 2007 edition of the Area Resource File (ARF). Published by the Health Resources and Services Administration of the US Department of Health and Human Services, the ARF is a collection of data from over 50 sources, including the American Medical Association, American Hospitalization Association, US Census, and National Center for US Health Statistics [12]. The ARF aggregates information concerning the healthcare professionals, healthcare facilities, and population for each county in the United States. Health system characteristics studied included number of population, radiation oncologists, neurosurgeons, primary care physicians, radiation therapy equipped hospitals, general oncology equipped hospitals, and median household income within a county for the years 2004–2008.
Construction of variables
The geographic units of analysis were the 154 Health Service Areas (HSAs) within the SEER dataset as defined by the National Center for Health Statistics and National Cancer Institute. HSAs are defined as a single county or group of contiguous counties that remain self-contained with respect to hospital care. HSAs were chosen as the unit of analysis because they best represent geographic access to healthcare within a region. County level data from the ARF was aggregated to HSAs using simple summation for physician and population variables and population weighted sums descriptive variables. Physician and hospital densities were calculated at 5-year population averages per 100,000 residents. To prevent ‘immortal time bias’ from patients who did not survive long enough to receive radiation treatment or whose comorbidities made them high-risk surgical candidates, we limited our cohort to patients who received surgical intervention and survived at least 6 months after time of diagnosis. [13] Additionally, patients who received radiation other than external-beam radiation therapy were excluded from the analysis.
Statistical analysis
To visually evaluate the relative distribution of neuro-oncologic resources across the United States, physician densities and hospital densities were mapped using to corresponding HSAs using the geographical information system ArcGIS Version 9.2 (Environmental Systems Research Institute, Inc., Redlands, CA).
A total of four logistic models were constructed to test the effect of health system characteristics on surgical treatment choice and receipt of PORT. Three logistic models were built to test the influence of regional healthcare systems on whether patients underwent gross total resection, partial resection, or only biopsy. Because we assumed that radiation therapy services were unlikely to be related to initial surgical treatment choice, density of radiation oncologists and radiation therapy equipped hospitals were excluded from the surgery logistic models. To test the factors associated with the receipt of PORT a fourth logistic model was build, which included radiation oncologist and radiation therapy equipped hospital density. Statistical significance was determined at p < 0.05. Statistical analysis was conducted using Stata Version 9.2 (Stata, College Station, TX).
Results
In total of 8,337 patients within the SEER dataset were diagnosed with GBM from 2004 to 2008. Of these 2,346 (28.2 %) were excluded because they received only radiation therapy (1,207 patients) or no attempted treatment (1,139 patients). Our final study cohort included 5,991 patients with a mean age of 61 years ranging from ages 18 to 95.1 years. 68.1 % of the study sample was married and 90.6 % was white.
Patients were more likely to receive gross total resection and PORT (38.6 %) than any other treatment regimen. However, a substantial proportion of patients received partial resection and PORT (29.8 %) or only biopsy and PORT (15.5 %). A smaller number of patients received gross resection (7.7 %), partial resection (8.2 %), or biopsy only (4.8 %) without PORT.
We found that the density of neurosurgical, radiation therapy and general oncology services varied geographically among different HSAs within the SEER registry. Moreover as seen in our previously published work [9], there appears to be a geographic maldistribution of both specialists and hospitals across all HSAs within the United States (Figs. 1, 2). Among the HSAs studied we found significant variability in the density of radiation oncology hospitals (median = 2.52 per 100,000 residents, range = 0–4.09), general oncology hospitals (median = 0.537, range = 0–14.3), neurosurgeons (median = 1.7, range = 0–5.13), and radiation oncology specialists (median = 1.42, range = 0–3.55). The median household income of HSAs analyzed was found to be $56,800 with a range of $24,770 to $90,800.
Fig. 1.
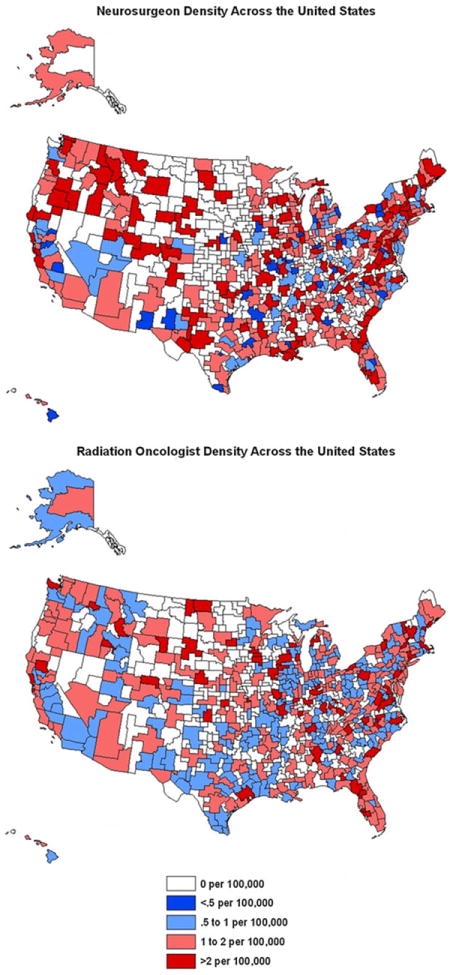
Distribution of neurosurgeons and radiation oncologist across the United States. **Note figure depicts all HSAs, regression analysis only includes those in SEER registry
Fig. 2.
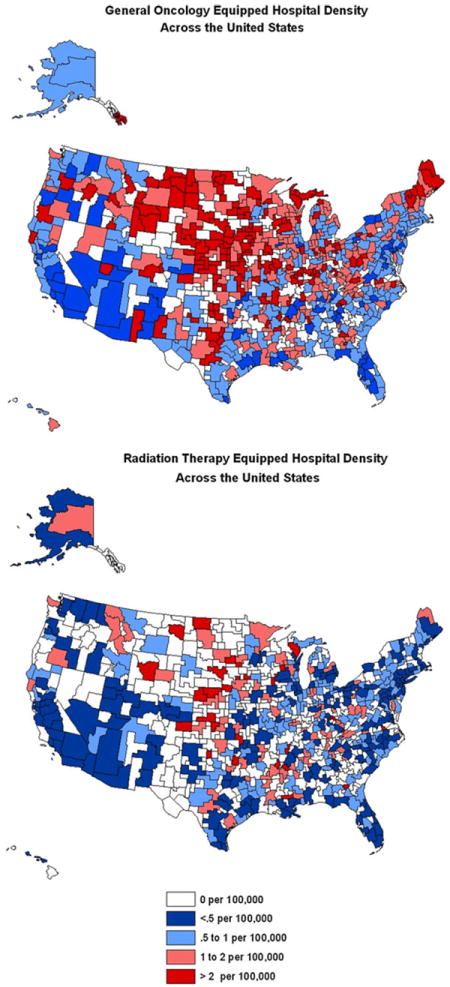
Distribution of General Oncology and Radiation Therapy Equipped Hospitals across the United States **Note figure depicts all HSAs, regression analysis only includes those in SEER registry
Predictors of gross resection are listed in Table 1. Younger, married patients who lived in HSAs with higher median incomes were significantly more likely to receive gross total resection (p < 0.001, p < 0.001, p = 0.002). For every $10,000 increase in the median income of a HSA, a patient’s likelihood of receiving gross resection increased by 7 %. Importantly, patient race, density of neurosurgeons, and density of oncology departments were not associated with complete resection.
Table 1.
Multivariate logistic regression analysis of total gross resection
| Predictors of total gross resection | Odds ratio | Error | P | 95 % confidence interval | |
|---|---|---|---|---|---|
| Neurosurgeon density | 1.00 | 0.04 | 0.911 | 0.91 | 1.08 |
| White race | 1.08 | 0.10 | 0.430 | 0.90 | 1.30 |
| Married | 1.91 | 0.11 | <0.001 | 1.71 | 2.13 |
| Age | 0.95 | 0.01 | <0.001 | 0.94 | 0.95 |
| Median household income of HSA | 1.06 | 0.01 | 0.028 | 1.01 | 1.12 |
| Medical oncology equipped hospital density | 1.07 | 0.04 | 0.580 | 1.00 | 1.16 |
Unmarried patients from HSAs with lower median incomes were associated with receiving biopsy only (p = 0.004, p < 0.001). As the median income of a patient’s HSA decreases by $10,000, a patient becomes 15 % more likely to receive biopsy only for treatment of GBM. Unmarried patients were 18 % more likely to receive biopsy only. Patient age, race, density of neurosurgeons, and density of oncology departments were not associated with likelihood of biopsy. These results are presented in Table 2. Partial tumor resection was not associated with any patient, population, or health system characteristics analyzed in our model (Table 3).
Table 2.
Multivariate logistic regression analysis of biopsy only management
| Predictors of biopsy only | Odds ratio | Error | P | 95 % confidence interval | |
|---|---|---|---|---|---|
| Neurosurgeon density | 1.03 | 0.04 | 0.352 | 0.96 | 1.11 |
| White race | 0.94 | 0.10 | 0.607 | 0.76 | 1.17 |
| Married | 0.82 | 0.06 | 0.004 | 0.72 | 0.94 |
| Age | 1.00 | 0.01 | 0.147 | 0.99 | 1.01 |
| Median household income of HSA | 0.85 | 0.01 | <0.001 | 0.80 | 0.89 |
| Medical oncology equipped hospital density | 0.94 | 0.04 | 0.148 | 0.86 | 1.02 |
Table 3.
Multivariate logistic regression analysis of partial resection
| Predictors of partial resection | Odds ratio | Error | P | 95 % confidence interval | |
|---|---|---|---|---|---|
| Neurosurgeon density | 1.00 | 0.03 | 0.991 | 0.94 | 1.06 |
| White race | 0.87 | 0.08 | 0.141 | 0.73 | 1.05 |
| Married | 1.01 | 0.06 | 0.921 | 0.89 | 1.13 |
| Age | 1.00 | 0.01 | 0.257 | 0.99 | 1.01 |
| Median household income of HSA | 1.04 | 0.01 | 0.113 | 0.99 | 1.09 |
| Medical oncology equipped hospital density | 1.02 | 0.04 | 0.562 | 0.95 | 1.09 |
Overall, of the 8,337 patients diagnosed with GBM analyzed in our initial sample, 71.45 % received PORT. The predictors of PORT receipt are listed in Table 4. As with extent of surgical resection, patient race was not associated with PORT receipt, but patient age and marital status were predictors of PORT receipt. Younger, married patients were more likely to receive PORT after surgery (p < 0.001, p < 0.001). Once again, the relative affluence of an HSA was significantly associated with a patient’s likelihood of receiving treatment (p = 0.008). Every $10,000 increase in HSA median income increases the likelihood of PORT receipt by 6.3 %.
Table 4.
Multivariate logistic regression analysis of postoperative radiation therapy receipt
| Predictors of PORT receipt | Odds ratio | Error | P | 95 % confidence interval | |
|---|---|---|---|---|---|
| Radiation oncologist density | 1.07 | 0.07 | 0.258 | 0.95 | 1.22 |
| Primary care physician density | 1.01 | 0.01 | 0.024 | 1.00 | 1.01 |
| Neurosurgeon density | 1.00 | 0.04 | 0.911 | 0.91 | 1.08 |
| White race | 1.08 | 0.10 | 0.426 | 0.90 | 1.30 |
| Married | 1.91 | 0.11 | <.001 | 1.71 | 2.13 |
| Radiation oncology equipped hospital density | 1.43 | 0.14 | 0.002 | 1.18 | 1.74 |
| Age | 0.95 | 0.01 | <.001 | 0.94 | 0.95 |
| Median household income of HSA | 1.06 | 0.01 | 0.028 | 1.00 | 1.12 |
| Medical oncology equipped hospital density | 1.07 | 0.04 | 0.058 | 1.00 | 1.16 |
There was also a number of health system factors associated with PORT receipt. The density of primary care providers (PCPs) and density of radiation oncology equipped hospitals were significant predictors of PORT receipt (p = 0.024, p = 0.002). Importantly, while the density of oncology equipped hospitals predicts PORT receipt, the density of individual radiation oncologists and neurosurgeons were not associated with likelihood of receiving PORT. Overall, marital status and density of radiation oncology equipped hospital were the strongest predictors of PORT receipt (OR = 1.91, OR = 1.43).
Discussion
Recent evidence has shown improvement in the outcomes of patients diagnosed with GBM. However, this improvement is seen only in patients who receive the recommended multidisciplinary treatment [14]. Our findings confirm a geographic maldistribution of radiation therapy and general oncology services that leaves significant portions of the population without ready access to radiation therapy [9]. We found that patient age, marital status, and median income of HSA are significant predictors of surgical resection and PORT receipt. The density of radiation oncology departments was also a predictor of PORT receipt. Our findings suggest that hospital infrastructure may be more closely associated with variations in GBM management than is physician supply. Regional variations in socioeconomic status are also associated with discrepancies in GBM treatment.
Some authors have found the extent of surgical resection to be the most important prognostic factor of GBM mortality [15]. A number of tumor characteristics including size, location, stage, and histology influence a surgeon’s ability to achieve complete tumor resection [16, 17]. Given that the extent of tumor removal is a strong predictor of survival, maximal resection should be attempted whenever possible, and tumor biopsy or partial resection should be considered only when total resection is determined to be unsafe or unfeasible [15, 17]. Our study corroborates previous findings that patient age and marital status predict likelihood of gross resection [18]. Furthermore, we found that every $10,000 increase in HSA median household income increases a patient’s chances of achieving gross resection by 7 %.
One possible reason for the socioeconomic disparity of patients undergoing gross total resection may be that those living in HSAs with higher median incomes have better access to hospital resources and improved coordination of care. Another potential explanation is that individuals living in HSAs with higher median incomes present earlier in the disease course, and thus have smaller, more respectable tumors. Interestingly, neither the density of neurosurgeons, nor the density of general oncology equipped hospitals was associated with likelihood of total resection. This suggests other factors associated with socioeconomic status may play a larger role in extent of surgical resection than number of physicians and hospitals. For example, it is possible that surgeons in higher socioeconomic areas are more determined to obtain full resection, or patients from those areas are more ardent about pursuing one. It is also possible that patients from lower SES areas have more comorbidities, and thus are less likely to pursue or be eligible for aggressive treatment [19].
Interestingly, as compared to biopsy only, partial resection seems to improve outcomes, suggesting a survival benefit of tumor debulking [15]. We found that partial tumor resection was not associated with any predictors in our model, suggesting that other factors such as tumor characteristics play a more important role in limited resection than do social and health system factors. As compared with complete resections, limited resections may be relatively unplanned occurrences influenced largely by intraoperative events or findings.
Surgical resection should ideally be followed by PORT administration, as some randomized controlled trials have found a doubling of survival in patients who receive PORT, [20, 21] with survival further improved with the administration of concurrent temozolomide [21]. Our study corroborates previous findings that PORT administration does not take place in a significant proportion of GBM patients, [22, 23] with increasing patient age and unmarried status being associated with a lower likelihood of PORT. As such, increased attention to and counseling for older, unmarried individuals may be warranted. Unique to our study is the finding that the median household income of a patient’s HSA significantly influences the likelihood of PORT receipt. We found that the administration of PORT follows a similar trend to surgical resection in that every $10,000 increase in HSA median income increases a patient’s likelihood of receiving PORT by approximately 6 %. The association of higher income and better patient outcomes is well documented in a number of oncologic and non-oncologic diseases, [24-28] but this is a new finding with respect to management of patients with GBM.
Interestingly, our findings indicate that it may not be the density of individual radiation oncologists, but rather the prevalence of radiation oncology centers that influences PORT receipt, suggesting a dominant role of hospital-level infrastructure over individual providers for addressing disparities in GBM management. It is possible that the large variations in treatment of GBM maybe related less to access to neurooncology services, but a larger apprehension of physicians to attempt aggressive surgery and radiation therapy for patients with less favorable prognosis.
While the prevalence of specialists such radiation oncologists and neurosurgeons was not associated with PORT receipt, the density of PCPs was. The reason for this effect is unclear. It may be that PCP density is a proxy for a robust health system and effective coordination of care. Regardless, this finding further substantiates the importance of a region’s health infrastructure as a significant predictor of PORT receipt in patients with GBM. As we continue to search for ways to improve treatment of patients with GBM and other cancers, we would do well to keep in mind the influence of PCPs on early detection and comprehensive management.
Unlike in a variety of other cancers, [29-33] patient race was not associated with variations in surgical management or receipt of radiation therapy for patients with GBM. In this sense, the management of GBM is a model for other cancers, particularly those where race based disparity in treatment has been shown. However, this encouraging finding may be related to the relatively grave nature of GBM, and it is important to recognize the significant historical and pathophysiological differences between GBM and other malignancies. For example, while many breast and prostate cancer patients receive treatment in smaller free-standing centers, GBM patients more often receive care in large academic centers with access to coordinated neurosurgical, radiation therapy, and oncology departments. Furthermore, there is less controversy with regards to optimal screening and management of GBM patients as compared to other cancers. Lastly, the natural history of GBM predicts uniformly poor survival, while greater prognostic variation exists in other types of cancer.
Similar to other cancer types older patients were less likely to received PORT for GBM. This is perhaps in part due to the reticence of elderly patients to agree to begin a prolonged course of radiation therapy which may be physically taxing. With respect to GBM specifically, the negative age association seen perhaps is evidence of a clinical trend to treat high-grade gliomas with temozolomide alone. There is some evidence to suggest in patients over age 70 temozolomide without radiation therapy is associated with equivalent overall and event free survival for high-grade gliomas. [34] The omission of radiation therapy for GBM among the elderly is an area of ongoing research that remains controversial.
Limitations
Our study has several limitations. Because the SEER dataset comprises only 28 % of the US population, we must be cautious about generalizing findings to the country as a whole. That being said, the SEER dataset has a relatively diverse geographic representation of health systems across the United States and includes registries from both rural and urban regions in many states. Another limitation of the SEER dataset is that it does not provide specific information regarding radiation therapy technique, dosage, and volume. However, this likely has a greater effect on survival analysis than on receipt of radiation therapy, the main variable assessed in this study. Finally, recent evidence has found the SEER dataset to underestimate the receipt of radiation therapy following breast-conserving surgery [35]. There however has been no similar evidence to suggest under ascertainment for PORT in the setting of GBM.
The ARF also has several limitations to be noted. First, the physician location data from the ARF is aggregated from the American Medical Association (AMA) Physician Masterfile. Because the AMA Masterfile does not account for physicians with multiple practices in different regions, it is possible that we overestimate the geographic clustering of radiation oncologists and neurosurgeons. However, while these specialists may practice in multiple locations, it is likely that their practices fall within the same HSA. Second, the ARF does not contain information regarding freestanding radiation therapy centers within different health systems. For future studies it maybe useful to obtain more comprehensive radiation therapy center data from the American Society for Radiation Oncology (ASTRO). Unfortunately at the time of this study this data was unavailable. Nonetheless, our analysis suggests a relative maldistribution of radiation therapy services across the United States.
Finally, our study does not examine other barriers to care such as lack of health insurance and whether radiation oncology centers accept Medicaid payment for their services. These unexamined factors may also contribute to the disparities highlighted in this paper.
Conclusion
In conclusion, there exist meaningful discrepancies in the receipt of two important predictors of survival (i.e., gross resection and PORT) persist. Specifically, our findings confirm that patient factors such as age and marital status influence a patient’s likelihood of receiving full surgical resection and PORT. Furthermore, our findings suggest that a geographic maldistribution of oncology services and SES discrepancies in HSAs may have serious clinical implications for patients with GBM. Thus, policies aimed at narrowing disparities in treatment may need to focus on improving coordination of care and addressing gaps in oncology department density. Further studies are warranted to better understand the influence of health system resources on the extent of surgical resection and PORT receipt for GBM.
Footnotes
Conflict of interest The authors have no conflicts of interest, financial or otherwise, to report.
Contributor Information
Sanjay Aneja, Yale School of Medicine, New Haven, CT, USA.
Dhruv Khullar, Yale School of Medicine, New Haven, CT, USA.
James B. Yu, Email: james.b.yu@yale.edu, Department of Therapeutic Radiology, Yale School of Medicine, HRT 138, 333 Cedar Street, New Haven, CT 06520, USA; Cancer Outcomes, Public Policy, and Effectiveness Research (COPPER) Center at Yale, New Haven, CT, USA.
References
- 1.Laws ER, Parney IF, Huang W, Anderson F, Morris AM, Asher A, Lillehei KO, Bernstein M, Brem H, Sloan A, Berger MS, Chang S. Survival following surgery and prognostic factors for recently diagnosed malignant glioma: data from the Glioma Outcomes Project. J Neurosurg. 2003;99(3):467–473. doi: 10.3171/jns.2003.99.3.0467. [DOI] [PubMed] [Google Scholar]
- 2.Becker KP, Yu J. Status quo–standard-of-care medical and radiation therapy for glioblastoma. Cancer J. 2012;18(1):12–19. doi: 10.1097/PPO.0b013e318244d7eb. [DOI] [PubMed] [Google Scholar]
- 3.Gorey KM. Breast cancer survival in Canada and the USA: meta-analytic evidence of a Canadian advantage in low-income areas. Int J Epidemiol. 2009;38(6):1543–1551. doi: 10.1093/ije/dyp193. [DOI] [PMC free article] [PubMed] [Google Scholar]
- 4.Ricketts TC, H G. Mortality and physician supply: does region hold the key to the paradox? Health Serv Res. 2007;42(6):2233–2251. doi: 10.1111/j.1475-6773.2007.00728.x. [DOI] [PMC free article] [PubMed] [Google Scholar]
- 5.Ananthakrishnan AN, McGinley EL, Binion DG, Saeian K. Physician density and hospitalization for inflammatory bowel disease. Inflamm Bowel Dis. 2011;17(2):633–638. doi: 10.1002/ibd.21357. [DOI] [PubMed] [Google Scholar]
- 6.Kociol RD, Greiner MA, Fonarow GC, Hammill BG, Heidenreich PA, Yancy CW, Peterson ED, Curtis LH, Hernandez AF. Associations of patient demographic characteristics and regional physician density with early physician follow-up among medicare beneficiaries hospitalized with heart failure. Am J Cardiol. 2011;108(7):985–991. doi: 10.1016/j.amjcard.2011.05.032. [DOI] [PubMed] [Google Scholar]
- 7.Starfield B, Shi L, Grover A, Macinko J. The effects of specialist supply on populations’ health: assessing the evidence. Health Aff (Millwood) Suppl Web Exclusives. 2005:W5-97–W5-107. doi: 10.1377/hlthaff.w5.97. [DOI] [PubMed] [Google Scholar]
- 8.Iglehart JK. Health reform, primary care, and graduate medical education. N Engl J Med. 2010;363(6):584–590. doi: 10.1056/NEJMhpr1006115. [DOI] [PubMed] [Google Scholar]
- 9.Aneja S, Smith BD, Gross CP, Wilson LD, Haffty BG, Roberts K, Yu JB. Geographic analysis of the radiation oncology workforce. Int J Radiat Oncol Biol Phys. 2011 doi: 10.1016/j.ijrobp.2011.01.070. [DOI] [PubMed] [Google Scholar]
- 10.Aneja S, Aneja S, Bordeaux JS. Association of increased dermatologist density with lower melanoma mortality. Arch Dermatol. 2012;148(2):174–178. doi: 10.1001/archdermatol.2011.345. [DOI] [PubMed] [Google Scholar]
- 11.Odisho AY, Cooperberg MR, Fradet V, Ahmad AE, Carroll PR. Urologist density and county-level urologic cancer mortality. J Clin Oncol. 2010;28(15):2499–2504. doi: 10.1200/JCO.2009.26.9597. [DOI] [PMC free article] [PubMed] [Google Scholar]
- 12.US Department of Health and Human Services HRaSA Area Resource File ARF. [18 March 2012];National county-level health resource information database. http://www.arfsys.com.
- 13.Park HS, Gross CP, Makarov DV, Yu JB. Immortal time bias: a frequently unrecognized threat to validity in the evaluation of postoperative radiotherapy. Int J Radiat Oncol Biol Phys. 2012 doi: 10.1016/j.ijrobp.2011.10.025. [DOI] [PubMed] [Google Scholar]
- 14.Koshy M, V J, Dolecek TA, Howard A, Mahmood U, Chmura SJ, Weichselbaum RR, McCarthy BJ. Improved survival time trends for glioblastoma using the SEER 17 population-based registries. J Neurooncol. 2012;107(1):207–212. doi: 10.1007/s11060-011-0738-7. [DOI] [PMC free article] [PubMed] [Google Scholar]
- 15.Kramm CM, Wagner S, Van Gool S, Schmid H, Strater R, Gnekow A, Rutkowski S, Wolff JE. Improved survival after gross total resection of malignant gliomas in pediatric patients from the HIT-GBM studies. Anticancer Res. 2006;26(5B):3773–3779. [PubMed] [Google Scholar]
- 16.Aghi M, B F, Curry WT, Carter BS. Survival after biopsy or resection of supratentorial lobar glioblastoma multiforme: a population-based study. Invited talk, congress of neurological surgeons annual meeting.2004. [Google Scholar]
- 17.Shinoda J, Sakai N, Murase S, Yano H, Matsuhisa T, Funakoshi T. Selection of eligible patients with supratentorial glio-blastoma multiforme for gross total resection. J Neurooncol. 2001;52(2):161–171. doi: 10.1023/a:1010624504311. [DOI] [PubMed] [Google Scholar]
- 18.Chang SM, Barker FG., 2 Marital status, treatment, and survival in patients with glioblastoma multiforme: a population based study. Cancer. 2005;104(9):1975–1984. doi: 10.1002/cncr.21399. [DOI] [PubMed] [Google Scholar]
- 19.Iwamoto FM, Reiner AS, Panageas KS, Elkin EB, Abrey LE. Patterns of care in elderly glioblastoma patients. Ann Neurol. 2008;64(6):628–634. doi: 10.1002/ana.21521. [DOI] [PubMed] [Google Scholar]
- 20.Keime-Guibert F, Chinot O, Taillandier L, Cartalat-Carel S, Frenay M, Kantor G, Guillamo JS, Jadaud E, Colin P, Bondiau PY, Menei P, Loiseau H, Bernier V, Honnorat J, Barrie M, Mokhtari K, Mazeron JJ, Bissery A, Delattre JY. Radiotherapy for glioblastoma in the elderly. N Engl J Med. 2007;356(15):1527–1535. doi: 10.1056/NEJMoa065901. [DOI] [PubMed] [Google Scholar]
- 21.Kristiansen K, Hagen S, Kollevold T, Torvik A, Holme I, Nesbakken R, Hatlevoll R, Lindgren M, Brun A, Lindgren S, Notter G, Andersen AP, Elgen K. Combined modality therapy of operated astrocytomas grade III and IV. Confirmation of the value of postoperative irradiation and lack of potentiation of bleomycin on survival time: a prospective multicenter trial of the Scandinavian Glioblastoma Study Group. Cancer. 1981;47(4):649–652. doi: 10.1002/1097-0142(19810215)47:4<649::aid-cncr2820470405>3.0.co;2-w. [DOI] [PubMed] [Google Scholar]
- 22.Stupp R, Mason WP, van den Bent MJ, Weller M, Fisher B, Taphoorn MJ, Belanger K, Brandes AA, Marosi C, Bogdahn U, Curschmann J, Janzer RC, Ludwin SK, Gorlia T, Allgeier A, Lacombe D, Cairncross JG, Eisenhauer E, Mirimanoff RO. Radiotherapy plus concomitant and adjuvant temozolomide for glioblastoma. N Engl J Med. 2005;352(10):987–996. doi: 10.1056/NEJMoa043330. [DOI] [PubMed] [Google Scholar]
- 23.Sherwood PR, Dahman BA, Donovan HS, Mintz A, Given CW, Bradley CJ. Treatment disparities following the diagnosis of an astrocytoma. J Neurooncol. 2010;101(1):67–74. doi: 10.1007/s11060-010-0223-8. [DOI] [PubMed] [Google Scholar]
- 24.Lawrence YR, Mishra MV, Werner-Wasik M, Andrews DW, Showalter TN, Glass J, Shen X, Symon Z, Dicker AP. Improving prognosis of glioblastoma in the 21st century: who has benefited most? Cancer. 2011;118(17):4228–4234. doi: 10.1002/cncr.26685. [DOI] [PubMed] [Google Scholar]
- 25.Sun M, Abdollah F, Liberman D, Abdo A, Thuret R, Tian Z, Shariat SF, Montorsi F, Perrotte P, Karakiewicz PI. Racial disparities and socioeconomic status in men diagnosed with testicular germ cell tumors: a survival analysis. Cancer. 2011;117(18):4277–4285. doi: 10.1002/cncr.25969. [DOI] [PubMed] [Google Scholar]
- 26.Reyes-Ortiz CA, G J, Zhang DD, Freeman JL. Socioeconomic status and chemotherapy use for melanoma in older people. Can J Aging. 2011;1:1–11. doi: 10.1017/S0714980810000796. [DOI] [PMC free article] [PubMed] [Google Scholar]
- 27.McBride RB, Lebwohl B, Hershman DL, Neugut AI. Impact of socioeconomic status on extent of lymph node dissection for colon cancer. Cancer Epidemiol Biomarkers Prev. 2010;19(3):738–745. doi: 10.1158/1055-9965.EPI-09-1086. [DOI] [PMC free article] [PubMed] [Google Scholar]
- 28.Shishehbor MH, Litaker D, Pothier CE, Lauer MS. Association of socioeconomic status with functional capacity, heart rate recovery, and all-cause mortality. JAMA. 2006;295(7):784–792. doi: 10.1001/jama.295.7.784. [DOI] [PubMed] [Google Scholar]
- 29.Stringhini S, Sabia S, Shipley M, Brunner E, Nabi H, Kivimaki M, Singh-Manoux A. Association of socioeconomic position with health behaviors and mortality. JAMA. 2010;303(12):1159–1166. doi: 10.1001/jama.2010.297. [DOI] [PMC free article] [PubMed] [Google Scholar]
- 30.Singal V, Singal AK, Kuo YF. Racial disparities in treatment for pancreatic cancer and impact on survival: a population-based analysis. J Cancer Res Clin Oncol. 2012;138(4):715–722. doi: 10.1007/s00432-012-1156-8. [DOI] [PubMed] [Google Scholar]
- 31.Evens AM, Antillon M, Aschebrook-Kilfoy B, Chiu BC. Racial disparities in Hodgkin’s lymphoma: a comprehensive population-based analysis. Ann Oncol. 2012 doi: 10.1093/annonc/mdr578. [DOI] [PubMed] [Google Scholar]
- 32.Robbins AS, Siegel RL, Jemal A. Racial disparities in stage-specific colorectal cancer mortality rates from 1985 to 2008. J Clin Oncol. 2012;30(4):401–405. doi: 10.1200/JCO.2011.37.5527. [DOI] [PubMed] [Google Scholar]
- 33.Terplan M, S N, McNamara EJ, Tracy JK, Temkin SM. Have racial disparities in ovarian cancer increased over time? An analysis of SEER data. Gynecol Oncol. 2012;125(1):19–24. doi: 10.1016/j.ygyno.2011.11.025. [DOI] [PubMed] [Google Scholar]
- 34.Wick W, Platten M, Meisner C, Felsberg J, Tabatabai G, Simon M, Nikkhah G, Papsdorf K, Steinbach JP, Sabel M, Combs SE, Vesper J, Braun C, Meixensberger J, Ketter R, Mayer-Steinacker R, Reifenberger G, Weller M. Temozolomide chemotherapy alone versus radiotherapy alone for malignant astrocytoma in the elderly: the NOA-08 randomised, phase 3 trial. Lancet Oncol. 2012;13(7):707–715. doi: 10.1016/S1470-2045(12)70164-X. [DOI] [PubMed] [Google Scholar]
- 35.Jagsi R, Abrahamse P, Hawley ST, Graff JJ, Hamilton AS, Katz SJ. Underascertainment of radiotherapy receipt in surveillance, Epidemiology, and End Results registry data. Cancer. 2012;118(2):333–341. doi: 10.1002/cncr.26295. [DOI] [PMC free article] [PubMed] [Google Scholar]