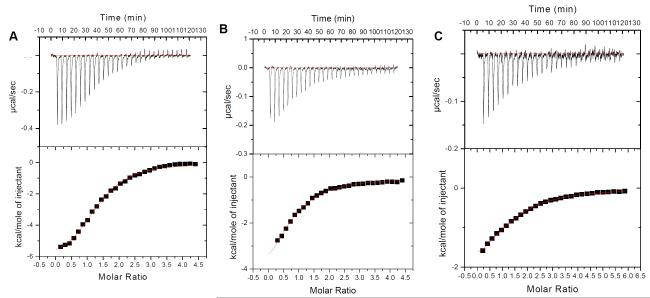
Figure 4.
ITC profiles for the titration of oxytricha nova quadruplex (GGGGTTTTGGGG)2 with neomycin or Paromomycin at 20°C. (A) neomycin in buffer 10 mM sodium cacodylate, 0.5 mM EDTA, and 60 mM KCl, at pH 7.0. (B) neomycin in buffer 10 mM sodium cacodylate, 0.5 mM EDTA, and 90 mM KCl at pH 7.0. (C) paromomyicn in buffer 10 mM sodium cacodylate, 0.5 mM EDTA, and 60 mM KCl at pH 7.0. The heat burst curves (top panel in the figures) is the result of 10μL injections of a concentrated ligand solution into the DNA solution in buffer conditions as described earlier. The data points (lower panel in the figures) reflect the corrected injection heats, which were obtained by subtracting the dilution heats obtained from separate control experiments in which ligand was titrated with buffer only. The red line represents the calculated fits of the data using one binding site model. The data fitting was carried out using Origin 5.0 software.

