

Abstract
Breast cancer is the most common cancer and the second leading cause of cancer-related mortality worldwide. The etiology of breast cancer is very diverse and ethanol (EtOH) consumption is a well-established risk factor for breast cancer in women. However, the mechanism by which EtOH exerts its carcinogenic activity in breast tissue remains unknown. CYP2E1 is known to metabolize ethanol and produce reactive oxygen species (ROS), including superoxide in epithelial cells. Therefore, in the present studies, we investigated whether there is an increase in ROS following overexpression of CYP2E1 in MCF-10A cells. We found that 30 and 100 mM EtOH increased ROS levels after 2 h treatment in CYP2E1 overexpressing cells. Based on these results and our previous studies with ROS-producing chemicals, we also examined epidermal growth factor receptor (EGFR) activation following exposure to ethanol. We found that there was an increase in phosphorylation of pY1086 EGFR after 18 h EtOH treatment in CYP2E1 overexpressing cells. These studies support a hypothesis that EtOH might increase human mammary cell activation, via an EGFR-dependent signaling mechanism associated with oxidative stress.
Keywords: breast cancer, ethanol, ROS, oxidative stress, EGFR, CYP2E1
1 Introduction
Previous studies by our laboratories have demonstrated that ROS activate epidermal growth factor receptor (EGFR) signaling pathways in human mammary epithelial cells by superoxide and hydrogen peroxide-dependent mechanisms (Burdick et al., 2003). Activation of EGFR signaling is associated with tumor promotion and progression in epithelial cells (Mill et al., 2009). We have previously worked with redox-cycling quinones derived from benzo(a)pyrene (BaP), which included the 1,6- and 3,6-benzo(a)pyrene quinones (1,6-BPQ and 3,6-BPQ). These quinones have been found to generate ROS, increase mammary cell proliferation and replace the need for normal growth factors such as EGF, in long term cultures. BPQs increase EGFR tyrosine phosphorylation on several phosphosites leading to downstream cell signaling pathways including phospholipase Cγ and several STAT pathways (Rodriguez et al., 2009).
Recent epidemiological studies have provided convincing evidence that ethanol (EtOH) consumption is associated with an increased risk of breast cancer in women (Chen et al., 2011). The mechanism(s) whereby EtOH increases breast cancer risk is still unclear. Because EtOH can be metabolized by several different pathways, one of which is associated with a microsomal enzyme oxidizing system (MEOS) and CYP2E1 in liver resulting in the formation of superoxide anion (Cederbaum et al, 2009), we were interested in determining whether CYP2E1 metabolism of EtOH can induce ROS formation in human mammary epithelial cells. Therefore, we examined the possibility that CYP2E1-related metabolism of ethanol may form sufficient amounts of superoxide to activate the EGFR in human mammary epithelial cells. The results of these studies show that ethanol increases oxidative stress and EGFR tyrosine phosphorylation in MCF-10A overexpressing CYP2E1.
2 Materials and Methods
2.1 Chemicals
All chemicals were purchased from Sigma (St. Louis, MO) unless otherwise indicated. 1,6-Benzo(a)pyrene quinone (BPQ) and 3,6-BPQ were purchased from the Midwest Research Institute (Kansas City, MO) at >99% purity and maintained as stock solutions in anhydrous tissue culture grade dimethyl sulfoxide (DMSO). The final concentration of DMSO in all experiments was 0.1%. 5-(and-6)-chloromethyl-2′,7′-dichlorodihydrofluorescein diacetate, acetyl ester, CM-H2DCFDA, *mixed isomers* (DCF) was purchased from Invitrogen (Carlsbad, CA).
2.2 Antibodies
Antibody against CYP2E1 was purchased from Abcam (Cambridge, MA). Antibodies against EGFR, actin, tubulin and horse radish peroxidase (HRP) – conjugated goat were purchased from Santa Cruz Biotechnology (Santa Cruz, CA). An antibody against HRP-conjugated rabbit and mouse were purchased from Cell Signaling Technology (Boston, MA). An antibody against pY1086 was purchased from Invitrogen/Biosource (Carlsbad, CA).
2.3 Cell culture and treatment
MCF-10A cells are a spontaneously immortalized and growth factor-dependent mammary epithelial cell line (Soule et al., 1990) that is grown on a Type I collagen-coated (PureCol, Advanced BioMatrix) 100 × 20 mm dishes (Corning Glass, Corning, NY, USA) in serum-free, growth factor-defined media (SFIHE media) at 10% CO2 and 37°C, as described elsewhere (Davis et al., 2003). We have used the MCF-10A cells as a model since it is a well-establish system to evaluate the effect of several toxic agents in human mammary epithelial cells. The reason to use human mammary epithelial cells instead of other cell type is because these cells are the origin of the most commonly occurring cancer in woman. These epithelial cells perform a variety of type-specific functions in vivo, with modulation by hormonal stimuli, and thus possess numerous differentiated properties which may be analyzed in response to different culture environments. For treatments, MCF-10A cells, passage 34 (and higher), were plated into 100 mm dishes at 3.5 × 10⁵ cells per dish in 5 mL SFIHE with 2% FBS, after 24 h the FBS containing media was removed and fresh media was added. EtOH exposure was performed by adding fresh media containing 10, 30 and 100 mM ethanol for 18 h. It should be noted that these are the initial concentrations of EtOH used in our studies, as EtOH rapidly volatilizes from cell culture plates. We estimate that most of the EtOH is gone within 4 hrs of exposure and therefore these are transient exposure levels. For phosphorylation assays, on day 3, media was removed and cells were placed in serum-free media containing hydrocortisone and insulin (SFIH), and without EGF for 18 h. Cells in EGF-deficient medium were then incubated with different treatment regimens. Treatments were run in triplicate at 1 μM 3,6-BPQ, 30 and 100 mM ethanol and 10 ng/mL EGF (controls). Cells were maintained in treatment media for 18 h or 15 min and then were lysed for further studies. For all the ethanol-treated cell studies, there were no changes in the cells that could be observed microscopically.
2.4 Western blot analysis
Lysates were prepared by exposing the cells to lysis buffer (50mM Tris pH 8, 150mM sodium chloride, 0.1% SDS, 0.5% sodium deoxycholate, 1% Triton X-100, 2μg/mL aprotinin, 10μg/mL leupeptin, 100 μM phenylmethylsulfonyl fluoride (PMSF), 1 mM sodium orthovanadate, 1mM dithiothreitol (DTT)) and a protease and phosphatase inhibitor tablet (Roche Diagnostics, Indianapolis, IN ), followed by scraping cells off of the plastic plates, and finally cleared by centrifugation. Protein concentrations were determined by a Bicinchoninic acid (BCA) protein assay (BioRad Laboratories, Hercules, CA), using bovine serum albumin (BSA) as standard (Pierce, Rockford, IL). 100 μg of protein from each sample was loaded onto 12% denaturing SDS-polyacrylamide gel. Gels were run at 180V for 1h and then electrotransferred to polyvinylidene fluoride (PVDF) membrane. The membrane was washed with 1X tris- buffered saline (TBS) for 10 min and then blocked overnight at 4°C in TBS with 0.05% Tween 20 (TBST) containing 5% nonfat dry milk. The membrane was then probed for CYP2E1 for 2 h at room temperature (RT) in 5% BSA in TBST using the manufacturer’s suggested dilution. The membrane was washed 3 × 5min in TBST and then incubated with the secondary antibody (HRP-conjugated) for 1 h at RT using the manufacturer’s suggested dilution. Actin was used as loading control. A chemiluminescence method (SuperSignal, Pierce, Rockford, IL) was used for the final visualization of the protein bands. The intensity of each band was imaged and quantified using a Kodak Imager scanning system (Kodak Co. Rochester, NY).
2.5 CYP2E1 transfection
A MCF-10A clonal cell line with increased CYP2E1 expression was established by stable transfection with a pIRES2-DsRed-Express expression vector (Contech) that contained the human CYP2E1 cDNA and G418 resistance gene. Clonal cell lines with increased CYP2E1 expression (4.1 2E1 cells) were identified by western blotting for CYP2E1 protein levels. A cell line transfected with the pIRES2-DsRed-Express backbone vector lacking CYP2E1 insert (1.2 BB cells) was also established and served as a control. Cells were maintained in SFIHE medium supplemented with G418.
2.6 Assessment of intracellular ROS by DCF
MCF-10A and CYP2E1-transfected cells were aliquoted into flow tubes at 3×10⁵cells and incubated with 5 μM DCF at 37°C and 10% CO2 for 30 min. Cells were then treated with 30 and 100 mM ethanol and 1μM 1,6- BPQ (as positive control) for 2 h under the incubation conditions described above. Following treatment, cells were centrifuged, resuspended in Dulbecco’s Phosphate Buffered Saline (DPBS), and analyzed on a FacScan flow cytometer.
2.7 EGFR immunoprecipitation and Western blot analysis
Lysates were prepared in lysis buffer (50mM Tris pH 7.4, 150mM NaCl, 1mM EDTA, 1mM EGTA, 0.1% SDS, 1% triton X-100, 0.2% sodium deoxycholate, 1 mM DTT, 1 μM PMSF, 5mm sodium fluoride, and a protease and phosphatase inhibitor tablet (Roche Diagnostics, Indianapolis, IN), and then scraping cells off of the plastic plates. Protein concentration was determined as we described above. For immunoprecipitation of EGFR, 350 μg of lysate protein was incubated with anti-EGRF antibody for 1h followed by incubation with Protein A/G PLUS- Agarose beads (Santa Cruz, CA) at 4°C for 4h. Beads were then collected by centrifugation, washed three times and then placed in Laemmli sample buffer (BioRad Laboratories, Hercules, CA). The immunoprecipitated protein was electrophoresed in a 7% denaturing SDS-polyacrylamide gel. Gel was run at 180 V for 1 h and then electro-transferred to PVDF membrane for 2 h. The membrane was blocked for 1 h in 5% w/v nonfat dry milk in TBST and then exposed to anti-pY1086 antibody overnight at 4°C in 5% BSA in TBST using the manufacturer’s suggested dilution. The membrane was washed and then incubated with anti-rabbit horseradish peroxidase conjugated antibody for 1 h at RT using the manufacturer’s suggested dilution. Tubulin was used as loading control. A chemiluminescence method (SuperSignal, Pierce, Rockford, IL) was used for the final visualization of the protein bands. The gel was imaged and the intensity of each band quantified using a Kodak Imager Scanning System (Kodak Co. Rochester, NY).
2.8 Statistical analysis
All of the data reported in this paper were analyzed using SigmaStat software (Systat Software, Inc.). The statistical differences were determined by one-way analysis of variance (ANOVA) followed by a Dunnett’s multiple comparison t-test. A p-value of <0.05 was considered significant.
3 Results
3.1 Expression of CYP2E1 protein in MCF-10A cells
Figure 1 shows the protein expression of CYP2E1 protein in ethanol-treated MCF-10A cells. MCF-10A cells were found to express low levels of CYP2E1, and these levels were not changed following an 18 h exposure to 10, 30 and 100 mM ethanol (Fig. 1). Because the levels of CYP2E1 protein was found to be quite low in MCF-10A as compared to normal human mammary epithelial cells (data not shown), we decided to develop a stable transfectant of MCF-10A cells overexpressing CYP2E1.
Fig. 1. Expression of CYP2E1 protein in MCF-10A cells.
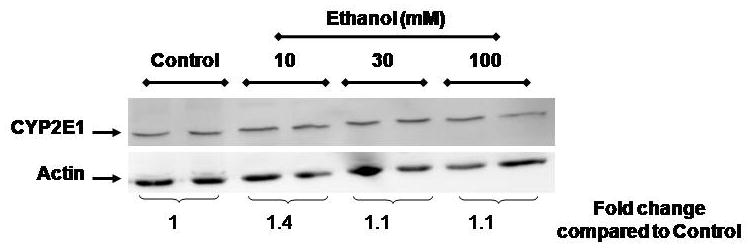
MCF-10A cells were cultured in the presence or absence of ethanol for 18 h. Whole protein was prepared and analyzed by Western blotting as described in the Material and Methods section. Values are from a representative experiment repeated at least twice and are the mean of three replicates ± S.E.M. * p< 0.05 as compared to control.
3.2 Stable Transfection of CYP2E1 into MCF-10A cells results in an increase of EtOH-induced Oxidative Stress
ROS levels from CYP2E1 transfected and untransfected MCF-10A cells treated with ethanol are shown in Figure 2. Untransfected MCF-10A cells showed an increase of ROS levels following 2 h treatment with 1 μM 1,6-BPQ (positive control, 36 mean channel fluorescence [MCF] increase compared to DMSO) and 100 mM ethanol (63 channel MCF increase, p<0.05). The 1.2 BB cells (backbone vector) showed similar ROS levels as untransfected MCF-10A cells when they were treated with 30 and 100 mM ethanol. In CYP2E1-overexpressing 4.12E1 cells, we found an increase in ROS levels (78 channel MCF increase, p<0.05) as compared to control 1.2 BB in 0.1% DMSO-treated control cells. Importantly, 4.1 2E1 cells treated with 30 or 100 mM ethanol for 2 h showed an increase in ROS levels demonstrated by 88 and 84 channel MCF shifts, respectively as compared to the 1.2BB cells (p<0.05). We observed differences in the MCF for MCF-10A cells treated with 30 or 100 mM of 4 and 63 channels, respectively as compared with 0.1% DMSO-treated cells (p<0.05). The positive control, 1 μM 1,6-BPQ, was also increased in 4.1 2E1 cells. These results show that MCF-10A cells have low expression levels of CYP2E1 that can form ROS, but that transfection leads to an increase in baseline levels of ROS as well as an increased response to ethanol and 1,6-BPQ.
Fig. 2. Quantification of ROS levels in CYP2E1 transfected and untransfected MCF-10A cells treated with ethanol.
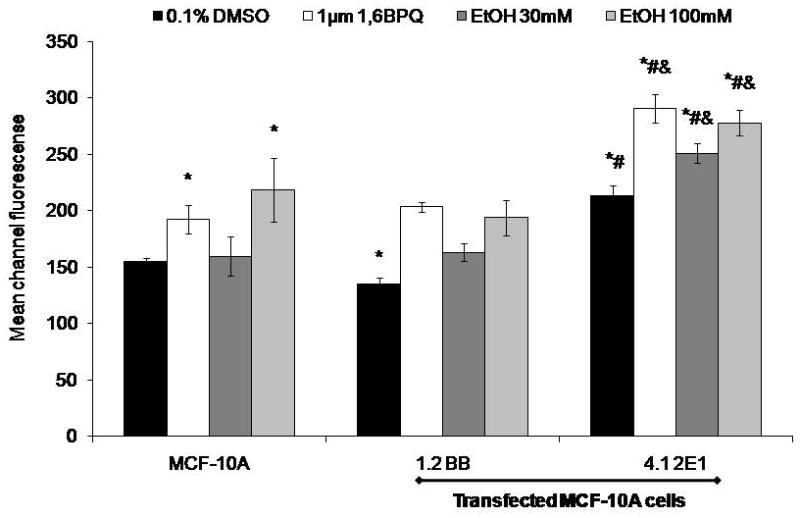
Cells were incubated with 5 μM dichlorofluorescein diacetate for 30 min and then treated with 30 and 100 mM ethanol for 2 h. Cells were analyzed on a FacScan flow cytometer. Values are from a representative experiment repeated at least twice and are the mean of three replicates ± S.E.M. *p< 0.05 as compared to control. *significantly different from MCF-10A (p< 0.05), #significantly different from 1.2BB, and & significantly different from DMSO 4.1 2E1 (p< 0.05).
3.3 Ethanol induces pY1086 EGFR phosphorylation in MCF-10A cells
Because we have previously shown that ROS-generating agents, such as 1,6- and 3,6-BPQs, increase EGFR tyrosine phosphorylation in MCF-10A cell which increases cell proliferation and can be an indication of tumor promotion (Burdick et al., 2003; Rodríguez-Fragoso et al., 2009), we wanted to see if ethanol could activate EGFR in CYP2E1 transfected (4.1 2E1) MCF-10A cells. Figure 3 shows the analysis of the pY1086 EGFR phosphorylation status in CYP2E1 transfected 4.1 2E1 cells and backbone transfected (1.2BB). Untransfected cells showed an increase in pY1086 EGFR phosphorylation treated with 10 ng/mL EGF and 1 μM 3,6-BPQ, 5.6-fold and 4.8-fold respectively (p<0.05). CYP2E1 transfected cells (4.1 2E1 cells) demonstrated an increase in the level of phosphorylation of pY1086 EGFR when cells were treated for 18 h with 1 μM 3,6-BPQ (used as a positive control based on the findings of Rodriguez et al., 2009, 20). Treatment with 30 mM ethanol produced a 1.2 fold increase in pY1086 phosphorylation (similar to 3,6-BPQ), and 100 mM ethanol produced a 3-fold increase, as compared to untreated cells and backbone vector controls (p<0.05). These results demonstrate that CYP2E1-generated ROS are able to activate the EGFR signaling pathway, as previously described for B(a)P-quinones (Rodriguez et al., 2009).
Fig. 3. EtOH and BPQs stimulate the pY1086 EGFR phosphorylation in CYP2E1 transfected and untransfected MCF-10A cells.
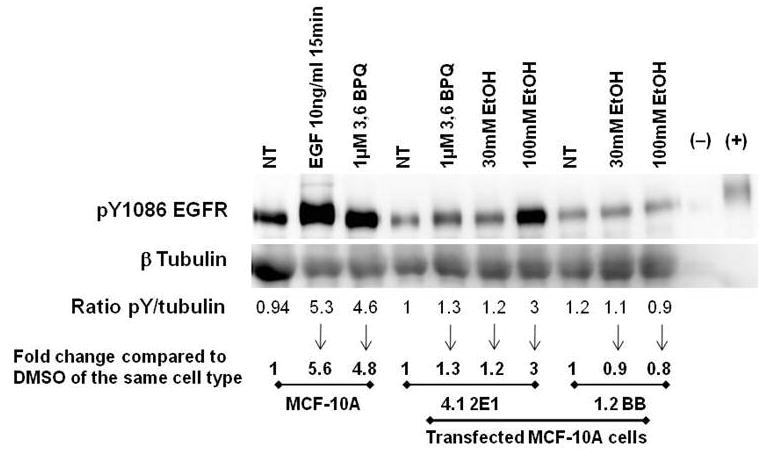
350 μg of lysate was incubated with anti-EGFR antibody and Protein A/G PLUS-Agarose for EGFR immunoprecipitation. Samples were then separated by SDS-PAGE and subject to Western blot analysis for EGFR phosphorylation using and anti-pY1086 EGFR. Non-stimulated and EGF-stimulated A431 cell lysates were included as negative and positive control, respectively. Relative phosphorylation levels were quantitated using digital imaging as compared to controls (DMSO) of the same cell type.
4 Discussion
Breast cancer is the most common cancer and the second leading cause of cancer-related mortality among American women (Draper, 2006). The etiology of breast cancer is very diverse and EtOH consumption is a well-established risk factor for breast cancer in women (Rohan et al., 2000; Boffeta and Hashibe, 2006; Smith-Warner et al., 1998; Hamajima et al., 2002; Singletary and Gapstur, 2011). However the mechanisms through which this agent is involved in the development of breast cancer is not fully elucidated. Acute and chronic EtOH consumption has the ability to induce lipid peroxidation, protein and DNA adducts and increase ROS production (Wright et al.,1999; Poschl and Seitz, 2004). The formation of ROS such as superoxide anion (O2−) and hydrogen peroxide (H2O2) causes oxidative injury leading to various diseases, including cancer. Changes in the intracellular redox status are linked to pathologic processes that are related to alterations of intracellular signaling pathways associated with protein kinases and growth factor receptor activation (Wu, 2006).
It has been reported that several agents such as radiation, oxidants and alkylating agents induce ligand-independent activation of numerous receptor tyrosine kinases at the cytoplasmic side of the plasma membrane, including the epidermal growth factor receptor (EGFR, Knebel et al., 1996). ROS have been included among intracellular signal transducers for the EGFR (Chiarugi and Buricchi, 2007). EGFR has the ability to stimulate tumor growth and progression by activating several signaling pathways associated with cell proliferation, angiogenesis, invasion, and metastasis (Mill et al., 2009).
The role of CYP2E1 in the metabolism of xenobiotics in mammary gland, including ethanol, has not been well defined. It has been reported that CYP2E1 is induced in the liver by the presence of high concentrations of ethanol or after chronic intake (Lieber and DeCarli, 1970; Guengerich et al., 1991). However, there are no reports in the literature showing that CYP2E1 can be induced by ethanol in human mammary cells. Our results showed that expression of CYP2E1 protein was not induced when MCF-10A cells were treated for 18 h suggesting that this enzyme may respond differently in extrahepatic tissues after an acute ethanol exposure.
Since we did not see any CYP2E1 induction, we developed a stable transfection of CYP2E1 into MCF-10A cells in order to demonstrate that overexpression of CYP2E1 correlates with an increase in the ROS production. It has been previously reported that overexpression of CYP2E1 protein and the production of ROS is increased following EtOH exposure (Roychowdhury et al., 2009; Wu and Cederbaum, 2010; Cedarbaum et al., 2009). Chandrasekaran et al. (2011) used cells expressing ADH/CYP2E1 proteins (VL-17A) and cells not expressing CYP2E1 protein (HepG2) in order to show that treatment with 100 mM ethanol for 72 h increased the levels of ROS only in cells expressing CYP2E1 protein. These results suggested that ROS production was dependent on the expression of CYP2E1 protein. The same effect has also been observed in primary neuronal cultures (Haorah et al, 2008). Primary neuronal cultures exposed to 17.5 mM ethanol increased ROS levels by 68%, an effect that was inhibited by the pretreatment with an inhibitor of ADH/CYP2E1 (4-methylpyrazole). Thus, these results also demonstrated that ROS production was dependent on CYP2E1 expression. In the present study we demonstrated that cells overexpressing CYP2E1, MCF-10A cells transfected with the pIRES2-DsRed-Express Vector containing the human CYP2E1 cDNA, showed an increase in ROS levels when they were exposed to 30 and 100 mM ethanol. Therefore, our results are consistent with previous reports.
ROS have been described as molecules that act as second messengers that are able to activate signaling pathways associated with tumor promotion through transactivation of growth factor receptors (Zima and Kalousova, 2005). Yusuf and Frenkel (2010) have shown that an oxidative environment promotes tumor transformation in MCF-10A cells. Previous studies in our laboratories have shown that exposure of MCF-10A cells to 1,6-and 3,6-BPQs (agents that increase ROS levels through redox cycling), induced EGFR transactivation and caused an increase in mammary cell proliferation (Burdick et al., 2003). Rodríguez-Fragoso et al., (2009) showed that MCF-10A cells exposed to 1μM 1,6- and 3,6-BPQs increased EGFR phosphorylation in several phosphosites associated with several signaling pathways leading to cell proliferation.
We have evaluated the effect of BPQs on the activation of various xenobiotic response elements and anti-oxidant response elements in MCF-10A cells. Our previous results have shown that both 3,6-BPQ and 1,6-BPQ induced oxidative stress associated genes (HMOX1, GCLC, GCLM, and SLC7A11), phase 2 enzyme genes (NQO1, NQO2, ALDH3A1), Polycyclic aromatic hydrocarbon (PAH) metabolizing genes (CYP1B1, EPHX1, AKR1C1), and certain EGFR associated genes (EGFR, IER3, ING1, SQSTM1 and TRIM16) (Burchiel et al., 2007). Here, we show that CYP2E1 overexpressing cells had a higher amount of ROS and an increase in the pY1086 EGFR phosphorylation as compared to non-transfected cell. These results suggest that the increase of ROS levels and phosphorylation of EGFR could be associated with an overexpression of CYP2E1 in MCF-10A cells. According to previous results from our laboratory and present data we suggest that EtOH might be able to activate xenobiotic response elements, to induce EGFR associated genes and activate different phosphosites in EGFR in MCF-10A cells, as seen with BPQs.
In this study we investigated whether CYP2E1-dependent oxidative stress was associated with an increase of pY1086 EGFR phosphorylation in MCF10A cells treated with EtOH. The relevance of the phosphorylation of pY1086 is that it facilitates the binding of the SH2 domains of growth factor receptor-bound protein 2 (GRB2). This binding results in mitogen activated protein kinase (MAPK) activation, a signaling pathway associated with cell proliferation (Jorissen et al., 2003). Our results demonstrate that MCF10A cells overexpressing CYP2E1 exposed to 30 and 100 mM ethanol increased the EGFR phosphorylation at phosphosite pY1086.
In summary, our results show that EtOH increases oxidative stress and activation of EGFR in MCF-10A cells overexpressing CYP2E1. Experimental data clearly support the hypothesis that EtOH metabolism via CYP2E1 may transactivate EGFR and activate downstream cell signaling in MCF-10A cells. Additional studies are needed to elucidate the signaling pathways that are activated after the phosphorylation of pY1086 EGFR and its relation to cellular processes associated with tumor promotion.
Acknowledgments
These studies were supported in part by NIH RO1 ES-07259 and by a Mexico CONACYT Fellowship to Angel León-Buitimea number 21416.
Footnotes
Conflict of Interest
The authors declare that they have no financial or other conflicts of interest to declare for the studies conducted in this manuscript, nor for the conclusions that have been reached.
References
- Boffeta P, Hashibe M. Alcohol and cancer. Lancet Oncol. 2006;7:149–156. doi: 10.1016/S1470-2045(06)70577-0. [DOI] [PubMed] [Google Scholar]
- Burdick AD, Davis JW, Liu JK, Hudson LG, Shi H, Monske ML, Burchiel SW. Benzo(a)pyrene quinones increase cell proliferation, generate reactive oxygen species, and transactivate the epidermal growth factor receptor in breast epithelial cells. Cancer Res. 2003;63:7825–7833. [PubMed] [Google Scholar]
- Cederbaum AI, Lu Y, Wu D. Role of oxidative stress in alcohol-induced liver injury. Arch Toxicol. 2009;83:519–48. doi: 10.1007/s00204-009-0432-0. Review. [DOI] [PubMed] [Google Scholar]
- Chandrasekaran K, Swaminathan K, Kumar SM, Chatterjee S, Clemens DL, Dey A. Elevated glutathione level does not protect against chronic alcohol mediated apoptosis in recombinant human hepatoma cell line VL-17A over-expressing alcohol metabolizing enzymes - Alcohol dehydrogenase and Cytochrome P450 2E1. Toxicol In Vitro. 2011;25:969–978. doi: 10.1016/j.tiv.2011.03.006. [DOI] [PubMed] [Google Scholar]
- Chen WY, Rosner B, Hankinson SE, Colditz GA, Willett WC. Moderate alcohol consumption during adult life, drinking patterns, and breast cancer risk. JAMA. 2011;306:1884–1890. doi: 10.1001/jama.2011.1590. [DOI] [PMC free article] [PubMed] [Google Scholar]
- Chiarugi P, Buricchi F. Protein tyrosine phosphorylation and reversible oxidation: two cross-talking posttranslational modifications. Antioxid Redox Signal. 2007;9:1–23. doi: 10.1089/ars.2007.9.1. [DOI] [PubMed] [Google Scholar]
- Davis JW, Jr, Burdick AD, Lauer FT, Burchiel SW. The aryl hydrocarbon receptor antagonist, 3′methoxy-4′nitroflavone, attenuates 2,3,7,8-tetrachlorodibenzo-p-dioxin-dependent regulation of growth factor signaling and apoptosis in the MCF-10A cell line. Toxicol Appl Pharmacol. 2003;188:42–49. doi: 10.1016/s0041-008x(03)00012-7. [DOI] [PubMed] [Google Scholar]
- Draper L. Breast cancer. Trends, risks, treatments and, effects. AAHN Journal. 2006;54:445–451. doi: 10.1177/216507990605401004. [DOI] [PubMed] [Google Scholar]
- Guengerich FP, Kim DH, Iwasaki M. Role of human cytochrome P450IIE1 in the oxidation of many low molecular weight cancer suspects. Chem Res Toxicol. 1991;4:168–179. doi: 10.1021/tx00020a008. [DOI] [PubMed] [Google Scholar]
- Hamajima N, Hirose K, Tajima K, et al. Alcohol, tobacco and breast cancer—collaborative reanalysis of individual data from 53 epidemiological studies, including 58 515 women with breast cancer and 95 067 women without the disease. Br J Cancer. 2002;87:1234–1245. doi: 10.1038/sj.bjc.6600596. [DOI] [PMC free article] [PubMed] [Google Scholar]
- Haorah J, Ramirez SH, Floreani N, Gorantla S, Morsey B, Persidsky Y. Mechanism of alcohol-induced oxidative stress and neuronal injury. Free Radic Biol Med. 2008;45:1542–1550. doi: 10.1016/j.freeradbiomed.2008.08.030. [DOI] [PMC free article] [PubMed] [Google Scholar]
- Jorissen RN, Walker F, Pouliot N, Garrett TP, Ward CW, Burgess AW. Epidermal growth factor receptor: mechanisms of activation and signaling. Exp Cell Res. 2003;284(1):31–53. doi: 10.1016/s0014-4827(02)00098-8. [DOI] [PubMed] [Google Scholar]
- Knebel A, Rahmsdorf HJ, Ullrich A, Herrlich P. Dephosphorylation of receptor tyrosine kinase as target of regulation by radiation, oxidants or alkylating agents. EMBO J. 1996;15:5314–5325. [PMC free article] [PubMed] [Google Scholar]
- Lieber CS, DeCarli LM. Hepatic microsomal ethanol-oxidizing systems: in vitro characteristics and adaptive properties in vivo. J Biol Chem. 1970;245:2505–2512. [PubMed] [Google Scholar]
- Mill CP, Chester JA, Riese DJ. EGFR may couple moderate alcohol consumption to increased breast cancer risk. Breast Cancer (London) 2009;1:31–38. doi: 10.2147/bctt.s6254. [DOI] [PMC free article] [PubMed] [Google Scholar]
- Poschl G, Seitz HK. Alcohol and cancer. Alcohol Alcohol. 2004;39:155–165. doi: 10.1093/alcalc/agh057. [DOI] [PubMed] [Google Scholar]
- Rodríguez-Fragoso L, Melendez K, Hudson LG, Lauer FT, Burchiel SW. EGF-receptor phosphorylation and downstream signaling are activated by benzo[a]pyrene 3,6-quinone and benzo[a]pyrene 1,6-quinone in human mammary epithelial cells. Toxicol Appl Pharmacol. 2009;235:321–328. doi: 10.1016/j.taap.2008.12.022. [DOI] [PMC free article] [PubMed] [Google Scholar]
- Rohan T, Jain M, Howe G, Miller A. Alcohol consumption and risk of breast cancer: a cohort study. Cancer Causes Control. 2000;11:239–247. doi: 10.1023/a:1008933824645. [DOI] [PubMed] [Google Scholar]
- Roychowdhury S, McMullen MR, Pritchard MT, Li W, Salomon RG, Nagy LE. Formation of gamma-ketoaldehyde-protein adducts during ethanol-induced liver injury in mice. Free Radic Biol Med. 2009;47:1526–1538. doi: 10.1016/j.freeradbiomed.2009.07.015. [DOI] [PMC free article] [PubMed] [Google Scholar]
- Singletary KW, Gapstur SM. Alcohol and breast cancer: review of epidemiologic and experimental evidence and potential mechanisms. JAMA. 2011;286:2143–2151. doi: 10.1001/jama.286.17.2143. [DOI] [PubMed] [Google Scholar]
- Smith-Warner SA, Spiegelman D, Yaun SS, Van den Brandt PA, Folsom AR, Goldbohm RA, Graham S, Holmberg L, Howe GR, Marshall JR, Miller AB, Potter JD, Speizer FE, Willett WC, Wolk A, Hunter DJ. Alcohol and breast cancer in women: a pooled analysis of cohort studies. JAMA. 1998;279:535–540. doi: 10.1001/jama.279.7.535. [DOI] [PubMed] [Google Scholar]
- Soule HD, Maloney TM, Wolman SR, Petersen WD, Jr, Brenz R, McGrath CM, Russ J, Pauley RJ, Jones RF, Brooks SC. 1990 Isolation and characterization of a spontaneously immortalized human breast epithelial cell line, MCF-10. Cancer Res. 2010;50:6075–6086. [PubMed] [Google Scholar]
- Wright MR, McManaman LJ, Repine EJ. Alcohol-induced breast cancer: a proposed mechanism. Free Radic Biol Med. 1999;26:348–354. doi: 10.1016/s0891-5849(98)00204-4. [DOI] [PubMed] [Google Scholar]
- Wu D. Alcohol-induced oxidative stress and cell responses. J Gastroenterol Hepatol. 2006;21:S26–29. doi: 10.1111/j.1440-1746.2006.04589.x. [DOI] [PubMed] [Google Scholar]
- Wu D, Cederbaum A. Activation of ASK-1 and downstream MAP kinases in cytochrome P4502E1 potentiates tumor necrosis factor alpha liver injury. Free Radic Biol Med. 2010;49:348–360. doi: 10.1016/j.freeradbiomed.2010.04.021. [DOI] [PMC free article] [PubMed] [Google Scholar]
- Yusuf R, Frenkel K. Morphologic transformation of human breast epithelial cells MCF-10A: dependence on an oxidative microenvironment and estrogen/epidermal growth factor receptors. Cancer Cell Int. 2010;10:30–46. doi: 10.1186/1475-2867-10-30. [DOI] [PMC free article] [PubMed] [Google Scholar]
- Zima T, Kalousova M. Oxidative stress and signaling transduction pathways in alcoholic liver disease. Alcohol Clin Exp Res. 2005;29:110S–115S. doi: 10.1097/01.alc.0000189288.30358.4b. [DOI] [PubMed] [Google Scholar]