

Highlights
► Gene Set Analysis (GSA) can reveal biological meaning from “omics” experiments. ► It is currently difficult to apply GSA to the range of available gene set databases. ► We constructed GeneSetDB, a comprehensive meta-database for gene set analysis. ► GeneSetDB integrates 26 databases containing different types of information. ► GeneSetDB lets biologists visualise the gene sets represented in their “omics” results.
Abbreviation: GSA, gene set analysis
Keywords: Database, Gene set, Enrichment analysis, Functional genomics
Abstract
Most “omics” experiments require comprehensive interpretation of the biological meaning of gene lists. To address this requirement, a number of gene set analysis (GSA) tools have been developed. Although the biological value of GSA is strictly limited by the breadth of the gene sets used, very few methods exist for simultaneously analysing multiple publically available gene set databases. Therefore, we constructed GeneSetDB (http://genesetdb.auckland.ac.nz/haeremai.html), a comprehensive meta-database, which integrates 26 public databases containing diverse biological information with a particular focus on human disease and pharmacology. GeneSetDB enables users to search for gene sets containing a gene identifier or keyword, generate their own gene sets, or statistically test for enrichment of an uploaded gene list across all gene sets, and visualise gene set enrichment and overlap using a clustered heat map.
1. Introduction
With the rapid development of high-throughput measurement technologies such as next generation sequencing and microarrays, biologists can easily analyse cells and tissues on a whole-genome scale. To make biological sense of the results of these analyses, biologists usually need to comprehensively interpret the biological meaning of gene lists. These gene lists may for example represent mRNAs co-regulated by a drug or experimental condition. Determining whether the members of a gene list share biological features has been made more important by the recent realisation that the expression of transcription factor target sets [1] or RNAs encoding proteins of similar function [2,3], are more often correlated than would be expected by chance. These correlated groups of functionally related RNAs appear to be tissue-specific and conserved across evolution [4,5]. For these reasons, genomics researchers find it valuable to analyse gene sets as well as individual genes [6,7] and gene set analysis (GSA) is frequently employed when interpreting genomic data. GSA statistically assesses whether experimentally identified gene lists have a larger intersection with biologically relevant gene sets than expected due to chance.
A number of GSA tools have been proposed and used successfully over the past decade [7]. However, most of these tools focus on identifying or visualising statistically significant gene set enrichment in one gene set database at a time. There are a fewer published reports of simultaneous analysis of multiple biologically distinct gene sets databases and their cross-visualisation. This is despite the fact that the gene sets employed critically limit the results of any GSA, and affect these results just as much as the statistical analysis methodologies used [7]. At present, Gene Ontology (GO) [8] is used as a “gold standard” gene set by many GSA tools [7]. However, many biologists would prefer to perform GSA using a single meta-database that allowed the statistically robust interrogation of GO and many other types of gene sets databases simultaneously, followed by a cross-visualisation of the results. A few GSA meta-databases (some embedded within specific GSA tools) have already been generated, like ConceptGen [9], DAVID [10], GATHER [11], GeneSigDB [12], MSigDB [13], and WhichGenes [14]. These are very useful resources/tools for GSA. In addition to these tools, there are several commercial products that allow variations of GSA but due to their cost these are not available to many academic researchers. However there remain no databases that are specifically designed for GSA and provide a searchable interface with full coverage of the available pathway, medical and pharmacological datasets.
Therefore, in order to allow comprehensive GSA across multiple databases of different types, we have constructed GeneSetDB, a comprehensive meta-database integrating 26 public databases. GeneSetDB allows users to identify and download the intersection between an individual gene or a gene list and gene sets in 26 databases. Moreover it allows users to statistically analyse the degree of enrichment of their gene list in gene sets and cross-visualise this enrichment in a clustered heatmap based on the overlap between the enriched gene sets.
2. Materials and methods
2.1. Gene set building
Data was downloaded from each source database with permission. Source databases were classified into five subclasses based on the database content: Pathway, Disease/Phenotype, Drug/Chemical, Genes Regulation and Gene Ontology (Table 1). Since different gene/protein identifiers are used in each database, Entrez gene ID was used as a representative identifier in GeneSetDB. The Bioconductor (http://www.bioconductor.org/) or biomaRt [38] bioinformatic resources were used in this identifier conversion. GeneSetDB is based primarily on human data; however, it supports mouse and rat gene lists by using the information in NCBI HomoloGene.
Table 1.
Sources databases included in GeneSetDB.
| Subclass Name | Sources database | Reference/URL |
|---|---|---|
| Pathway | Biocarta | http://www.biocarta.com |
| EHMN | [15] | |
| HumanCyc | [16] | |
| INOH | [17] | |
| NetPath | [18] | |
| PID | [19] | |
| Reactome | [20] | |
| SMPDB | [21] | |
| Wikipathways | [22] | |
| Disease/Phenotype | CancerGenes | [23] |
| HPO | [24] | |
| KEGG Disease | [25] | |
| MethCancerDB | [26] | |
| MethyCancer | [27] | |
| MPO | [28] | |
| SIDER | [29] | |
| Drug/Chemical | CTD | [30] |
| DrugBank | [31] | |
| MATADOR | [32] | |
| STITCH | [33] | |
| T3DB | [34] | |
| Gene Regulation | MicroCosm Targets | [35] |
| miRTarBase | [36] | |
| Rel/NF-κB target genes | http://bioinfo.lifl.fr/NF-KB | |
| TFactS | [37] | |
| GO | Gene Ontology | [8] |
2.2. Enrichment analysis
In general, enrichment analysis/overrepresentation analysis is the statistical assessment of whether input gene list has a larger intersection with biologically relevant gene sets than expected by chance. GeneSetDB uses the hypergeometric distribution to calculate the probability of overrepresentation (shown as P-value). The calculation of this P-value is followed by multiple testing correction use the Benjamini and Hochberg method [39], the result of which is shown as a false discovery rate (FDR). Gene sets with less than 10 or more than 500 genes are not used in the enrichment analysis. The reference (background) gene set was the set of Entrez gene IDs that have at least one annotation in the union of the gene sets used in the analysis (e.g. Subclass Pathway, GO, etc.). The gene sets shown on the results page can be filtered based on FDR. GeneSetDB allows the use of several types of identifier for the input gene list, including official gene symbols and commercial microarray probe IDs. Each input identifier is converted to an Entrez gene ID using the Bioconductor or biomaRt resources [38]. GeneSetDB allows visualisation of gene set overlap with the submitted gene list in a clustered heatmap. The heatmap colors show the proportion of overlap between the gene sets.
2.3. Implementation
All gene sets are stored in a MySQL database management system, and the web interface is implemented using Apache, PHP, Javascript and HTML. The statistical package R is used for statistical calculations and for drawing clustered heatmaps. To use GeneSetDB users can paste gene lists into the web interface or upload a gene list text file. Results can be downloaded to the user’s computer as a file or visualised in tables through a web browser. GeneSetDB is scriptable over the internet to allow its use by bioinformaticians from within other software such as R (see the Help page on GeneSetDB web site for mode details). The database structure and analysis scheme is visually described in Fig. 1.
Fig. 1.

Database structure and analysis scheme. The gene sets are downloaded from source databases and deposited into a MySQL database. All gene identifiers of both the source databases and the input gene list are converted into Entrez Gene ID using Bioconductor or biomaRt.
3. Results
Currently, GeneSetDB contains nine Pathway databases, seven Disease/Phenotype databases, five Drug/Chemical databases, four Gene Regulation databases and GO (Table 1). Table 2 shows the breadth of coverage of GeneSetDB compared to examples of currently available gene set meta-databases. This comparison suggests that GeneSetDB may cover a wider variety of biomedical features (especially human disease pathways and pharmacology) than some other databases. GeneSetDB also allows researchers to assemble their own original gene sets from these pre-existing gene sets, similar to the tools Gene Set Builder [40] and WhichGenes [14]. When performing enrichment analysis with GeneSetDB, users can choose combinations of one or more database subclasses (Pathway, Disease/Phenotype, Drug/Chemical, Gene Regulation and Gene Ontology), or any of the 26 individual databases as backend annotation depending on their research question (Fig. 2). Users can also generate a heatmap based on the intersection between the enriched gene sets with one another.
Table 2.
Feature comparison between GeneSetDB and existing databases.
| Feature | GeneSetDB | ConceptGen [9] | DAVID [10] | MSigDB [13] | WhichGenes [14] |
|---|---|---|---|---|---|
| Pathway database # | 9 | 3 | 6 | 7 | 3 |
| Disease/Phenotype database # | 7 | 1 | 2 | 2a | 4 |
| Drug/Chemical database # | 5 | 1 | 0 | 1a | 1 |
| Whole data downloadable | Yes | No | Yes | Yes | No |
| Making of original gene set | Yes | No | No | Yes | Yes |
| Gene/gene set intersection map | No | Yes | Yes | Yes | No |
| Gene set/gene set intersection map | Yes | No | No | No | No |
| Organismsb | Hs, Mm, Rn | Hs, Mm, Rn | Over 65 000 species | Dr, Hs, Mm, Mmu, Rn | Hs, Mm |
Including original curated datasets.
Dr: Danio rerio, Hs: Homo sapiens, Mm: Mus musculus, Mmu: Macaca mulatta, Rn: Rattus norvegicus.
Fig. 2.
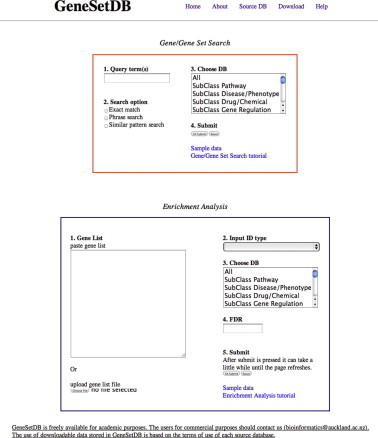
Top screen of GeneSetDB. Users can query gene names or biological terms in “gene/gene set search” and “gene list in enrichment analysis” modes. Users can also select a subclass of gene sets and database names if they wish to conduct a focused analysis. In the enrichment analysis mode, GeneSetDB allows the use of several gene identifier types (e.g. commercial probe IDs). FDR can be used to filter the gene sets shown in the results.
3.1. Description of the gene/gene set search function
GeneSetDB can be queried by gene name (e.g. FOXL2) or by a descriptive term, such as a disease, drug name or general biological term (e.g. melanoma, gleevec, cell cycle). The user can select subclass of database if their interest is specific (Fig. 2). For example, if they want to identify drugs targeting a specific gene, they can select the “Drug/Chemical” subclass in gene/gene set search. GeneSetDB provides three search functions: “Exact match”, “Phrase search”, and “Similar pattern search”, which allow for broader keywords’ matches. These functions are available only for Gene/Gene Set Search. The retrieved result lists the identifier and types of gene set, their sources and their constituent genes (Fig. 3). A gene set name is hyperlinked to the original data source if the original database’s identifier is available. The result of gene/gene set searches can be downloaded as tables as well as viewed as tables in a web browser window. This enables users to make and save original gene sets, which can be used as the backend annotation in their own enrichment analysis.
Fig. 3.
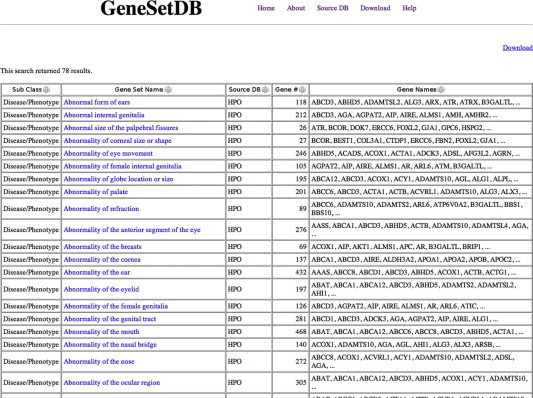
Gene/gene set search result. GeneSetDB shows subclass of gene set, gene set name, source database, the number of genes in corresponding gene set and gene names (first 10 genes). User can see all gene names in a downloadable text file. A gene set name is hyperlinked to the original database if the original database’s identifier is available.
3.2. The enrichment analysis function: an example where GeneSetDB is used to identify drugs related to the disease Systemic Lupus Erythematosus
New drugs are urgently needed for the treatment of autoimmune diseases like Systemic Lupus Erythematosus (SLE) [41]. Therefore we used the enrichment analysis function in GeneSetDB to identify drugs that target molecules and molecular pathways associated with SLE. We used a gene list from Alcorta et al.’s Affymetrix microarray analysis, which compared mRNA abundance in the leukocytes of patients with SLE to mRNA abundance in the leukocytes of healthy donors [42]. This experiment identified 205 SLE-associated Affymetrix probe sets, which we found mapped to 153 unique mRNAs using the NetAffix Annotation Update 32 (Supplementary Table 1). These 153 SLE-associated genes were investigated by enrichment analysis using the “Drug/Chemical” subclass of GeneSetDB. This identified 10 drug/chemical-associated gene sets for which the 153 SLE signature genes were significantly enriched (FDR < 1e-05; Fig. 4). Seven out of these 10 drugs/chemicals were related to autoimmune disease (data not shown). GeneSetDB generated a heatmap with clustering based on the proportion of overlapping genes between the enriched gene sets (Fig. 4). This heatmap contained two major clusters – one cluster included 2-xylene, ethylbenzene, trichloroethylene and toluene, which are environmental factors triggering SLE while the other cluster included chlorophyllin, plant extracts, polyinosinic-polycytidylic acid (poly(I:C)) and Zidovudine, which are associated with host response to viral infections. This type of analysis may potentially be useful for generating hypotheses for drug repositioning projects.
Fig. 4.
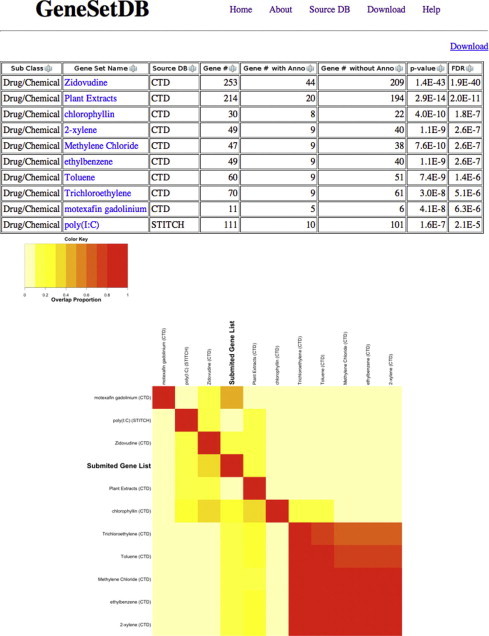
Enrichment analysis result of SLE signature genes. Enrichment analysis identifies the gene sets meeting a user-assigned FDR and generates a clustered heatmap based on the overlap proportion of genes between the gene sets. The overlap between the top 30 gene sets ranked by FDR, and between these gene sets and the submitted gene list, are shown in a clustered heatmap.
3.3. The enrichment analysis function: an example where GeneSetDB is used to identify the biological meaning of gene lists generated in human endothelial cell apoptosis microarray experiments
We applied GeneSetDB to a list of 79 Affymetrix probe sets that were differentially expressed when endothelial cells (EC) were induced to undergo apoptosis [43]. When this probe set list was analysed by our research group several years ago using a combination of the GO and manual annotation from the published literature, genes encoding proteins important for apoptosis, cellular stress, cell cycle, transcription, coagulation, and proteosomal degradation were identified [43]. When the gene list was re-analysed in September 2011 using the GATHER web tool [11] with default settings, additional associations were identified with cell signalling, NF-κB-related gene sets, and others (Supplementary Tables 2a–d). The GATHER web tool provided extremely useful information and was an easy-to-use screen for biological associations for this 79 probe list. When this gene list was re-analysed using GeneSetDB, we observed enrichment for many of the gene sets previously identified using manual annotation and GATHER analysis. However, GeneSetDB also identified additional biologically relevant gene set enrichment, especially related to drugs, molecular pathways and diseases (Supplementary Table 3). For example, as found with the previous manual literature and the GATHER analysis, GeneSetDB identified regulated activity of the NF-κB1 transcription. However, GeneSetDB highlighted several additional gene sets associated with upstream regulation of NF-κB activity including: TAK1, RANKL, TNF-α, Interleukin 1 and TNF-like death receptors. GeneSetDB also identified several drugs associated with EC proliferation and apoptosis including NF-κB activation inhibitor, thalidomide (a drug known to regulate apoptosis and the growth of new blood vessels [44]) and Vinblastine (a drug known to affect EC apoptosis [45]). Additional gene sets associated with canonical signalling pathways and diseases of blood vessels were also identified by GeneSetDB including the vascular endothelial growth factor (VEGF) pathway (VEGF is an important endothelial cell survival factor [46]), and abnormal neo-vascularisation.
Heatmap clustering using the “Pathway” subclass of GeneSetDB divided gene sets associated with EC apoptosis into two major groups, relevant to the cell cycle and relevant to signal transduction (Supplementary Fig. 1). In summary, GeneSetDB analysis provided detailed new leads about the molecules involved in EC apoptosis, diseases that may share these molecular relationships, and drugs that may modulate the apoptotic process.
4. Discussion
We suggest that GeneSetDB is a useful addition to available GSA tools, for both experimental and computational biologists. It is equally applicable to several omics technologies such as: expression microarrays, RNAseq and ChIP on Chip. It enables researchers to simultaneously compare experimentally-derived or in silico-derived gene lists to gene sets from 26 databases that cover five biological categories. Users can also choose to use only a subset of the gene sets contained in GeneSetDB, according to their research purposes, in order to focus on the most relevant results for their particular analysis, and in order to speed up the statistical calculations. GeneSetDB also includes novel clustered heatmap visualisation capabilities that facilitate visual understanding of the enrichment analysis. Computational biologists can script their access to GeneSetDB, and download the meta-gene sets related to their in silico work or to benchmark or validate additional GSA tools. We show that GeneSetDB identifies biologically relevant information about two gene lists that could not be identified using other currently available tools, and that it compliments these tools. However, there are limitations to using GeneSetDB. Since GeneSetDB particularly focuses on human disease and pharmacology, it may not be suitable for the study of microbiology or plant biology. Users having interest in such fields should consider addition GSA tools, which cover wide range of organisms (e.g. DAVID or others listed in [7]). As for the functional aspects, GeneSetDB uses the hypergeometric distribution to calculate the significance of overrepresentation. This type method requires pre-selection of genes (e.g. differentially expressed genes between disease and control samples), and the results of course depend on the criterion used for pre-selection. If users do not want to pre-select genes, Gene Set Enrichment Analysis (GESA), which does not require pre-selection of genes [47], integrated with MSigDB will be especially useful.
In conclusion, although GSA is nowadays a standard omics analysis tool, the wide range of gene set databases that are now publically available is poorly exploited due to our limited ability to analyse these databases together, especially databases related to drugs and human disease. This limitation is especially important for biological researchers who do not have access to expensive commercial tools, and for researchers who focus on drugs/diseases/phenotypes. GeneSetDB was designed a meta-gene set database for use in GSA to overcome these limitations. It is freely available for academic purposes and will be actively maintained. In future work we plan to integrate GeneSetDB with additional gene sets including TRANSFAC and mutation/polymorphism databases.
Availability and requirements
All gene sets, analysis functions and downloadable data in GeneSetDB are available, for academic purposes only, at: http://genesetdb.auckland.ac.nz/haeremai.html.
Acknowledgements
The authors gratefully acknowledge the developers of each source database for their permission to use their data in this study. The authors also thank Dr. Daniel Hurley and Ms. Vicky Fan for their useful comments and Dr. Enid Lam for her bioinformatic assistance with the development of a related database that contributed to GeneSetDB. H.A. is supported by FY 2010 Research Exchange Program between Royal Society of New Zealand and Japan Society for the Promotion of Science. Parts of this work have also been supported by NZ FoRST NERF contract 13296-NMTS-UOA, Maurice and Phyllis Paykel Trust contract 3624003, and a Maurice Wilkins Centre of Excellent grant.
Contributor Information
Hiromitsu Araki, Email: h.araki@auckland.ac.nz.
Christoph Knapp, Email: c.knapp@auckland.ac.nz.
Peter Tsai, Email: p.tsai@auckland.ac.nz.
Cristin Print, Email: c.print@auckland.ac.nz.
Appendix A. Supplementary data
Supplementary Fig. 1.

Clustered heatmap illustrating enrichment analysis result for an EC apoptosis microarray gene list using the Pathway subclass of GeneSetDB (FDR < 1e-5).
Supplmentary Tables 1–3.
References
- 1.Hatanaka Y., Nagasaki M., Yamaguchi R., Obayashi T., Numata K., Fujita A., Shimamura T., Tamada Y., Imoto S., Kinoshita K., Nakai K., Miyano S. A novel strategy to search conserved transcription factor binding sites among coexpressing genes in human. Genome Inform. 2008;20:212–221. [PubMed] [Google Scholar]
- 2.Lee H.K., Hsu A.K., Sajdak J., Qin J., Pavlidis P. Coexpression analysis of human genes across many microarray data sets. Genome Res. 2004;14:1085–1094. doi: 10.1101/gr.1910904. [DOI] [PMC free article] [PubMed] [Google Scholar]
- 3.Obayashi T., Kinoshita K. Rank of correlation coefficient as a comparable measure for biological significance of gene coexpression. DNA Res. 2009;16:249–260. doi: 10.1093/dnares/dsp016. [DOI] [PMC free article] [PubMed] [Google Scholar]
- 4.Stuart J.M., Segal E., Koller D., Kim S.K. A gene-coexpression network for global discovery of conserved genetic modules. Science. 2003;302:249–255. doi: 10.1126/science.1087447. [DOI] [PubMed] [Google Scholar]
- 5.Obayashi T., Kinoshita K. COXPRESdb: a database to compare gene coexpression in seven model animals. Nucleic Acids Res. 2011;39:D1016–D1022. doi: 10.1093/nar/gkq1147. [DOI] [PMC free article] [PubMed] [Google Scholar]
- 6.Song S., Black M.A. Microarray-based gene set analysis: a comparison of current methods. BMC Bioinformatics. 2008;9:502. doi: 10.1186/1471-2105-9-502. [DOI] [PMC free article] [PubMed] [Google Scholar]
- 7.Huang D.W., Sherman B.T., Lempicki R.A. Bioinformatics enrichment tools: paths toward the comprehensive functional analysis of large gene lists. Nucleic Acids Res. 2009;37:1–13. doi: 10.1093/nar/gkn923. [DOI] [PMC free article] [PubMed] [Google Scholar]
- 8.Ashburner M., Ball C.A., Blake J.A., Botstein D., Butler H., Cherry J.M., Davis A.P., Dolinski K., Dwight S.S., Eppig J.T., Harris M.A., Hill D.P., Issel-Tarver L., Kasarskis A., Lewis S., Matese J.C., Richardson J.E., Ringwald M., Rubin G.M., Sherlock G. Gene ontology: tool for the unification of biology. The gene ontology consortium. Nat. Genet. 2000;25:25–29. doi: 10.1038/75556. [DOI] [PMC free article] [PubMed] [Google Scholar]
- 9.Sartor M.A., Mahavisno V., Keshamouni V.G., Cavalcoli J., Wright Z., Karnovsky A., Kuick R., Jagadish H.V., Mirel B., Weymouth T., Athey B., Omenn G.S. ConceptGen: a gene set enrichment and gene set relation mapping tool. Bioinformatics. 2010;26:456–463. doi: 10.1093/bioinformatics/btp683. [DOI] [PMC free article] [PubMed] [Google Scholar]
- 10.Huang da W., Sherman B.T., Lempicki R.A. Systematic and integrative analysis of large gene lists using DAVID Bioinformatics Resources. Nat. Protoc. 2009;4:44–57. doi: 10.1038/nprot.2008.211. [DOI] [PubMed] [Google Scholar]
- 11.Chang J.T., Nevins J.R. GATHER: a systems approach to interpreting genomic signatures. Bioinformatics. 2006;22:2926–2933. doi: 10.1093/bioinformatics/btl483. [DOI] [PubMed] [Google Scholar]
- 12.Culhane A.C., Schwarzl T., Sultana R., Picard K.C., Picard S.C., Lu T.H., Franklin K.R., French S.J., Papenhausen G., Correll M., Quackenbush J. GeneSigDB – a curated database of gene expression signatures. Nucleic Acids Res. 2010;38:D716–D725. doi: 10.1093/nar/gkp1015. [DOI] [PMC free article] [PubMed] [Google Scholar]
- 13.Liberzon A., Subramanian A., Pinchback R., Thorvaldsdóttir H., Tamayo P., Mesirov J.P. Molecular Signatures Database (MSigDB) 3.0. Bioinformatics. 2011;27:1739–1740. doi: 10.1093/bioinformatics/btr260. [DOI] [PMC free article] [PubMed] [Google Scholar]
- 14.Glez-Peña D., Gómez-López G., Pisano D.G., Fdez-Riverola F. WhichGenes: a web-based tool for gathering, building, storing and exporting gene sets with application in gene set enrichment analysis. Nucleic Acids Res. 2007;37:W329–W334. doi: 10.1093/nar/gkp263. [DOI] [PMC free article] [PubMed] [Google Scholar]
- 15.Ma H., Sorokin A., Mazein A., Selkov A., Selkov E., Demin O., Goryanin I. The Edinburgh human metabolic network reconstruction and its functional analysis. Mol. Syst. Biol. 2007;3:135. doi: 10.1038/msb4100177. [DOI] [PMC free article] [PubMed] [Google Scholar]
- 16.Romero P., Wagg J., Green M.L., Kaiser D., Krummenacker M., Karp P.D. Computational prediction of human metabolic pathways from the complete human genome. Genome Biol. 2005;6:R2. doi: 10.1186/gb-2004-6-1-r2. [DOI] [PMC free article] [PubMed] [Google Scholar]
- 17.Kushida T., Takagi T., Fukuda K.I. Event ontology: a pathway-centric ontology for biological processes. Pac. Symp. Biocomput. 2006;11:152–163. [PubMed] [Google Scholar]
- 18.Kandasamy K., Mohan S.S., Raju R., Keerthikumar S., Kumar G.S., Venugopal A.K., Telikicherla D., Navarro J.D., Mathivanan S., Pecquet C., Gollapudi S.K., Tattikota S.G., Mohan S., Padhukasahasram H., Subbannayya Y., Goel R., Jacob H.K., Zhong J., Sekhar R., Nanjappa V., Balakrishnan L., Subbaiah R., Ramachandra Y.L., Rahiman B.A., Prasad T.S., Lin J.X., Houtman J.C., Desiderio S., Renauld J.C., Constantinescu S.N., Ohara O., Hirano T., Kubo M., Singh S., Khatri P., Draghici S., Bader G.D., Sander C., Leonard W.J., Pandey A. NetPath: a public resource of curated signal transduction pathways. Genome Biol. 2010;11:R3. doi: 10.1186/gb-2010-11-1-r3. [DOI] [PMC free article] [PubMed] [Google Scholar]
- 19.Schaefer C.F., Anthony K., Krupa S., Buchoff J., Day M., Hannay T., Buetow K.H. PID: the Pathway Interaction Database. Nucleic Acids Res. 2009;37:D674–D679. doi: 10.1093/nar/gkn653. [DOI] [PMC free article] [PubMed] [Google Scholar]
- 20.Croft D., O’Kelly G., Wu G., Haw R., Gillespie M., Matthews L., Caudy M., Garapati P., Gopinath G., Jassal B., Jupe S., Kalatskaya I., Mahajan S., May B., Ndegwa N., Schmidt E., Shamovsky V., Yung C., Birney E., Hermjakob H., D’Eustachio P., Stein L. Reactome: a database of reactions, pathways and biological processes. Nucleic Acids Res. 2011;39:D691–D697. doi: 10.1093/nar/gkq1018. [DOI] [PMC free article] [PubMed] [Google Scholar]
- 21.Frolkis A., Knox C., Lim E., Jewison T., Law V., Hau D.D., Liu P., Gautam B., Ly S., Guo A.C., Xia J., Liang Y., Shrivastava S., Wishart D.S. SMPDB: the Small Molecule Pathway Database. Nucleic Acids Res. 2010;38:D480–D487. doi: 10.1093/nar/gkp1002. [DOI] [PMC free article] [PubMed] [Google Scholar]
- 22.Pico A.R., Kelder T., van Iersel M.P., Hanspers K., Conklin B.R., Evelo C. WikiPathways: pathway editing for the people. PLoS Biol. 2008;6:e184. doi: 10.1371/journal.pbio.0060184. [DOI] [PMC free article] [PubMed] [Google Scholar]
- 23.Higgins M.E., Claremont M., Major J.E., Sander C., Lash A.E. CancerGenes: a gene selection resource for cancer genome projects. Nucleic Acids Res. 2007;35:D721–D726. doi: 10.1093/nar/gkl811. [DOI] [PMC free article] [PubMed] [Google Scholar]
- 24.Robinson P.N., Köhler S., Bauer S., Seelow D., Horn D., Mundlos S. The human phenotype ontology: a tool for annotating and analyzing human hereditary disease. Am. J. Hum. Genet. 2008;83:610–615. doi: 10.1016/j.ajhg.2008.09.017. [DOI] [PMC free article] [PubMed] [Google Scholar]
- 25.Kanehisa M., Goto S., Furumichi M., Tanabe M., Hirakawa M. KEGG for representation and analysis of molecular networks involving diseases and drugs. Nucleic Acids Res. 2010;38:D355–D360. doi: 10.1093/nar/gkp896. [DOI] [PMC free article] [PubMed] [Google Scholar]
- 26.Lauss M., Visne I., Weinhaeusel A., Vierlinger K., Noehammer C., Kriegner A. MethCancerDB – aberrant DNA methylation in human cancer. Br. J. Cancer. 2008;98:816–817. doi: 10.1038/sj.bjc.6604219. [DOI] [PMC free article] [PubMed] [Google Scholar]
- 27.He X., Chang S., Zhang J., Zhao Q., Xiang H., Kusonmano K., Yang L., Sun Z.S., Yang H., Wang J. MethyCancer: the database of human DNA methylation and cancer. Nucleic Acids Res. 2008;36:D836–D841. doi: 10.1093/nar/gkm730. [DOI] [PMC free article] [PubMed] [Google Scholar]
- 28.Smith C.L., Eppig J.T. The mammalian phenotype ontology: enabling robust annotation and comparative analysis. Wiley Interdiscip. Rev. Syst. Biol. Med. 2009;1:390–399. doi: 10.1002/wsbm.44. [DOI] [PMC free article] [PubMed] [Google Scholar]
- 29.Kuhn M., Campillos M., Letunic I., Jensen L.J., Bork P. A side effect resource to capture phenotypic effects of drugs. Mol. Syst. Biol. 2010;6:343. doi: 10.1038/msb.2009.98. [DOI] [PMC free article] [PubMed] [Google Scholar]
- 30.Davis A.P., King B.L., Mockus S., Murphy C.G., Saraceni-Richards C., Rosenstein M., Wiegers T., Mattingly C.J. The comparative toxicogenomics database: update 2011. Nucleic Acids Res. 2011;39:D1067–D1072. doi: 10.1093/nar/gkq813. [DOI] [PMC free article] [PubMed] [Google Scholar]
- 31.Knox C., Law V., Jewison T., Liu P., Ly S., Frolkis A., Pon A., Banco K., Mak C., Neveu V., Djoumbou Y., Eisner R., Guo A.C., Wishart D.S. DrugBank 3.0: a comprehensive resource for ‘omics’ research on drugs. Nucleic Acids Res. 2011;39:D1035–D1041. doi: 10.1093/nar/gkq1126. [DOI] [PMC free article] [PubMed] [Google Scholar]
- 32.Günther S., Kuhn M., Dunkel M., Campillos M., Senger C., Petsalaki E., Ahmed J., Urdiales E.G., Gewiess A., Jensen L.J., Schneider R., Skoblo R., Russell R.B., Bourne P.E., Bork P., Preissner R. SuperTarget and Matador: resources for exploring drug–target relationships. Nucleic Acids Res. 2008;36:D919–D922. doi: 10.1093/nar/gkm862. [DOI] [PMC free article] [PubMed] [Google Scholar]
- 33.Kuhn M., Szklarczyk D., Franceschini A., Campillos M., von Mering C., Jensen L.J., Beyer A., Bork P. STITCH 2: an interaction network database for small molecules and proteins. Nucleic Acids Res. 2010;38:D552–D556. doi: 10.1093/nar/gkp937. [DOI] [PMC free article] [PubMed] [Google Scholar]
- 34.Lim E., Pon A., Djoumbou Y., Knox C., Shrivastava S., Guo A.C., Neveu V., Wishart D.S. T3DB: a comprehensively annotated database of common toxins and their targets. Nucleic Acids Res. 2010;38:D781–D786. doi: 10.1093/nar/gkp934. [DOI] [PMC free article] [PubMed] [Google Scholar]
- 35.Kozomara A., Griffiths-Jones S. MiRBase: integrating microRNA annotation and deep-sequencing data. Nucleic Acids Res. 2011;39:D152–D157. doi: 10.1093/nar/gkq1027. [DOI] [PMC free article] [PubMed] [Google Scholar]
- 36.Hsu S.D., Lin F.M., Wu W.Y., Liang C., Huang W.C., Chan W.L., Tsai W.T., Chen G.Z., Lee C.J., Chiu C.M., Chien C.H., Wu M.C., Huang C.Y., Tsou A.P., Huang H.D. MiRTarBase: a database curates experimentally validated microRNA–target interactions. Nucleic Acids Res. 2011;39:D163–D169. doi: 10.1093/nar/gkq1107. [DOI] [PMC free article] [PubMed] [Google Scholar]
- 37.Essaghir A., Toffalini F., Knoops L., Kallin A., van Helden J., Demoulin J.B. Transcription factor regulation can be accurately predicted from the presence of target gene signatures in microarray gene expression data. Nucleic Acids Res. 2010;38:e120. doi: 10.1093/nar/gkq149. [DOI] [PMC free article] [PubMed] [Google Scholar]
- 38.Durinck S., Moreau Y., Kasprzyk A., Davis S., De Moor B., Brazma A., Huber W. BioMart and Bioconductor: a powerful link between biological databases and microarray data analysis. Bioinformatics. 2005;21:3439–3440. doi: 10.1093/bioinformatics/bti525. [DOI] [PubMed] [Google Scholar]
- 39.Benjamini Y., Hochberg Y. Controlling the false discovery rate: a practical and powerful approach to multiple testing. J. Roy. Stat. Soc. Ser. B. 1995;57:289–300. [Google Scholar]
- 40.Yusuf D., Lim J.S., Wasserman W.W. The Gene Set Builder: collation, curation, and distribution of sets of genes. BMC Bioinformatics. 2005;6:305. doi: 10.1186/1471-2105-6-305. [DOI] [PMC free article] [PubMed] [Google Scholar]
- 41.Pascual V., Chaussabel D., Banchereau J. A genomic approach to human autoimmune diseases. Annu. Rev. Immunol. 2010;28:535–571. doi: 10.1146/annurev-immunol-030409-101221. [DOI] [PMC free article] [PubMed] [Google Scholar]
- 42.Alcorta D.A., Barnes D.A., Dooley M.A., Sullivan P., Jonas B., Liu Y., Lionaki S., Reddy C.B., Chin H., Dempsey A.A., Jennette J.C., Falk R.J. Leukocyte gene expression signatures in antineutrophil cytoplasmic autoantibody and lupus glomerulonephritis. Kidney Int. 2007;72:853–864. doi: 10.1038/sj.ki.5002371. [DOI] [PubMed] [Google Scholar]
- 43.Johnson N.A., Sengupta S., Saidi S.A., Lessan K., Charnock-Jones S.D., Scott L., Stephens R., Freeman T.C., Tom B.D., Harris M., Denyer G., Sundaram M., Sasisekharan R., Smith S.K., Print C.G. Endothelial cells preparing to die by apoptosis initiate a program of transcriptome and glycome regulation. FASEB J. 2004;18:188–190. doi: 10.1096/fj.03-0097fje. [DOI] [PubMed] [Google Scholar]
- 44.Mitsiades N., Mitsiades C.S., Poulaki V., Chauhan D., Richardson P.G., Hideshima T., Munshi N.C., Treon S.P., Anderson K.C. Apoptotic signaling induced by immunomodulatory thalidomide analogs in human multiple myeloma cells: therapeutic implications. Blood. 2002;99 doi: 10.1182/blood.v99.12.4525. 4525-4530. [DOI] [PubMed] [Google Scholar]
- 45.Gallagher H., Carroll W.M., Dowd M., Rochev Y. The effects of vinblastine on endothelial cells. Endothelium. 2008;15:9–15. doi: 10.1080/10623320802092161. [DOI] [PubMed] [Google Scholar]
- 46.Schoenfeld J., Lessan K., Johnson N.A., Charnock-Jones D.S., Evans A., Vourvouhaki E., Scott L., Stephens R., Freeman T.C., Saidi S.A., Tom B., Weston G.C., Rogers P., Smith S.K., Print C.G. Bioinformatic analysis of primary endothelial cell gene array data illustrated by the analysis of transcriptome changes in endothelial cells exposed to VEGF-A and PlGF. Angiogenesis. 2004;7:143–156. doi: 10.1007/s10456-004-1677-0. [DOI] [PubMed] [Google Scholar]
- 47.Subramanian A., Tamayo P., Mootha V.K., Mukherjee S., Ebert B.L., Gillette M.A., Paulovich A., Pomeroy S.L., Golub T.R., Lander E.S., Mesirov J.P. Gene set enrichment analysis: a knowledge-based approach for interpreting genome-wide expression profiles. Proc. Natl. Acad. Sci. USA. 2005;102:15545–15550. doi: 10.1073/pnas.0506580102. [DOI] [PMC free article] [PubMed] [Google Scholar]
Associated Data
This section collects any data citations, data availability statements, or supplementary materials included in this article.
Supplementary Materials
Supplmentary Tables 1–3.