

Abstract
Real-time quantitative polymerase chain reaction (qPCR) is a routine and robust approach for measuring gene expression. The stability of reference genes in qPCR is crucial for the accurate quantification of gene expression. To provide reliable reference genes for studying the transcriptional responses of locust muscles to hypobaric hypoxia, we first examined the gene expression stability of the frequently used housekeeping genes 18S, GAPDH, and β-actin. However, the expression of these three housekeeping genes was influenced by hypobaric hypoxia. Consequently, we identified five novel candidate reference genes from the locust microarray data. The gene expression stability of the five candidates, together with the three classical housekeeping genes, were evaluated using two distinct algorithms implemented in geNorm and NormFinder. GeNorm identified Ach (acetyl-CoA hydrolase) and Pgp (phosphoglycolate phosphatase-like) as the most stable genes and NormFinder further distinguished Ach as the most stable one. The validity of Ach as a reference gene was confirmed through comparison with 18S. This study exemplifies the necessity of validating reference genes before their application and the feasibility of identifying condition-specific reference genes from large-scale gene expression data.
Keywords: Real-time quantitative PCR, Reference gene, Microarray, Hypobaric hypoxia, Locusta migratoria
Highlights
▸ The expression of GAPDH, 18S and β-actin was unstable under hypobaric hypoxia. ▸ New candidate reference genes were identified from microarray data. ▸ geNorm and NormFinder identified Ach and Pgp as the most stable genes. ▸ The validity of Ach as a reference gene was confirmed through comparison with 18S.
1. Introduction
Hypobaric hypoxia has a complex effect on health. It damages lipids and proteins [1], interferes with spermatogenesis [2], and increases cellular oxidative stress. For instance, native Tibetans who live at high altitudes still suffer from reactive oxygen species caused by hypobaric hypoxia [3]. Hypobaric hypoxia can also be beneficial. For instance, body weight was reduced when subjects with obesity were exposed to hypobaric hypoxia [4]. Understanding the effects of hypobaric hypoxia can help improve medical healthcare in high altitude regions. The migratory locust Locusta migratoria, widely distributed both in high altitude plateaus and in low altitude plains, is a good model for studying the biological responses to hypobaric hypoxia.
Gene expression analysis can reveal the molecular responses to environmental stimuli. Although various high-throughput techniques have been developed to examine gene expression, real-time quantitative polymerase chain reaction (qPCR) remains the gold standard for quantifying gene expression. The results from large-scale parallel examination methods, such as serial analysis of gene expression (SAGE) [5], expressed sequence tag (EST) [6], microarray [7–9], and RNA-seq [10], still require confirmation using qPCR.
The accuracy of qPCR strongly depends on reliable normalization using stably expressed reference genes. If the reference gene is unstable, qPCR may lead to erroneous results [11,12]. However, the frequently used reference genes are not always stably expressed. For instance, β-actin is influenced by genetic background and the circadian time in mice [11]; GAPDH, β-actin, and 28S rRNA are influenced substantially and independently by drugs in mammary epithelial cells and fibroblasts from breast tissues [13]. To avoid the bias introduced by reference genes, their stability should be validated before application [14–17].
Efforts to identify stably expressed reference genes can be classified based on the origin of the candidate genes. One way is to predefine a list of candidate reference genes, most of which are previously reported housekeeping genes [18–21]. However, this is not a safe solution because a recent study revealed that none of their 10 predefined candidate reference genes was stably expressed across all engineered muscle samples [21]. Another way is to identify stably expressed genes as novel candidate references through the meta-analysis of large datasets, e.g. microarray data produced under diverse conditions [22–24]. However, these novel candidate reference genes have the same limitations as the traditionally used reference genes, i.e., their stable expression across the studied conditions do not guarantee their feasibility under other circumstances. Thus, identifying condition-specific reference genes for a particular experimental system is required [18,25].
We examined the gene expression stability of three conventionally used housekeeping genes. However, all of the genes were influenced by hypobaric hypoxia. Hence, we identified new stable reference genes from microarray data and confirmed their validity under the experimental condition. The use of validated reference genes will help avoid the erroneous interpretation of transcriptional profiles.
2. Materials and methods
2.1. Sample preparation
The locusts were previously collected from a gregarious population in Huanghua, Hebei Province, China, reared in their gregarious state at 30 ± 2 °C under a 14 h:10 h light:dark photoperiod regime, and fed with fresh wheat seedlings and bran [6]. The female adult locusts were treated in a hypobaric chamber from which air was pumped out to a partial oxygen pressure of 13 kPa to simulate 4 km altitude hypoxia. After 48 h of treatment, the thoracic muscles of the locust were immediately collected and frozen in liquid nitrogen. Six groups of identically treated adult female locusts were used, with ten individuals in each group. Six groups of ten adult female locusts under normoxia were also sampled as controls.
2.2. RNA isolation and cDNA synthesis
Total RNA was isolated from samples following the protocol of the RNeasy Mini Kit (Qiagen). Total RNA concentrations were determined using a Nanodrop ND-1000 (Thermo Fisher Scientific, CA, USA) and the A260/A280 ratios of RNA samples were between 1.8 and 2.0. We also checked the RNA integrity by agarose gel electrophoresis. The RNA samples were considered intact if an 18S band was clearly observed. The band of 28S rRNA is usually hard to be identified because of the ‘hidden break’ in insects [26]. Two microgram RNA was reverse-transcribed with random primers (Promega) using M-MLV Reverse Transcriptase (Promega) according to the manufacturer's instructions.
2.3. Microarray data
Expression profiling data from the 12 thoracic muscle samples of the migratory locust (6 treatments and 6 controls) were generated from a customized oligonucleotide microarray [7–9]. The raw data were background corrected using the normexp method [27] and were normalized within-array using the LOWESS method, as implemented in the Limma package [28]. Then, the data were fitted into a linear model and empirical Bayesian smoothing was applied to the standard errors [28]. The cutoff criteria for differentially expressed genes was set to a false discovery rate (FDR) < 0.05 (p value adjusted using BH method [29] implemented in Limma [28]) and fold change >1.5. The microarray data were deposited into the NCBI Gene Expression Omnibus database (GEO ID: GSE33898).
2.4. Selection of candidate reference genes
The candidate reference genes were selected based on the results of the Limma package. The genes with FDR > 0.99 were selected as preliminary candidates. The candidates with A < 8 (, R and G represent the fluorescence intensity of red and green channels), which indicates weak fluorescence intensity, or those with a signal-to-noise ratio <3 in any of the Cy3 and Cy5 channels on all six hybridizations, which indicates low signal contrast, were filtered out [30]. After filtration, five genes, together with GAPDH, 18S, and β-actin, were selected as candidate reference genes for qPCR (Table 1).
Table 1.
Characteristics of the eight candidate reference genes.
| Symbol | Name | GenBank accession number | Description | Forward (F) and reverse (R) primers | PCR efficiency (%) | Amplicon (bp) |
|---|---|---|---|---|---|---|
| 18S | 18S rRNA | AF370793 | Ribosomal RNA | F: GAAACGGCTACCACATCCA | 98.2 | 168 |
| R: CACCAGACTTGCCCTCCA | ||||||
| Actb | β-actin | AY344445 | Cytoskeleton | F: AATTACCATTGGTAACGAGCGATT | 97.3 | 73 |
| R: TGCTTCCATACCCAGGAATGA | ||||||
| GAPDH | Glyceraldehyde-3-phosphate dehydrogenase | JF915526 | Glycolysis and gluconeogenesis | F: GGCAGTTAATGACCCGTTCA | 101.4 | 114 |
| R: ACAACAAGACTGTCGCCATC | ||||||
| Ach | Acetyl-CoA hydrolase | NP_651762 | Involved in acetate utilization in mitochondria and fatty acid metabolism | F: CAGTACAAGGAAAACAGCAATAA | 98.5 | 126 |
| R: ATCCAGTAAAGGGGCTAAGAA | ||||||
| Cht2 | Probable chitinase 2 | NP_477298 | To hydrolyze chitin | F: CTTCCATTATCCTTGGTTTGC | 104.5 | 258 |
| R: GAGTATGACTGGGTTGTAGCCT | ||||||
| Hpk | Hypothetical protein KGM_09817 | EHJ73760 | Hypothetical protein with unknown function | F: CCCCGAAAATGTGGTGAAG | 99.2 | 230 |
| R: CCAGCAGGAAGTATGGGTAGAA | ||||||
| Pgp | Phosphoglycolate phosphatase-like | XP_003426392 | To degrade 2-phosphoglycolate produced in the DNA repair process | F: CAGGTGCTGATGTTGCTTTG | 97.7 | 138 |
| R: TTTCTTCTTCTGATGCCTTG | ||||||
| Rrp | Recombination repair protein 1 | XP_002422991 | To promote homologous recombination at sites of DNA damage | F: GCCGACAGAGTATGCGAAAT | 96.7 | 194 |
| R: CCTGCTGCTTCCACCTCC |
2.5. Real-time quantitative PCR
Amplicons of the eight candidate genes (Table 1) were ligated into pGEM T-easy vectors (Promega) and transferred into Escherichia coli DH5α competent cells (Tiangen) for amplification. Plasmids were extracted and serially diluted tenfold to construct calibration curves in qPCR [7,31]. qPCR was performed on a Mx3000P system (Stratagene) using RealMasterMix SYBR Green (Tiangen). Reactions were performed in a 20 μl volume containing 10 ng cDNA, 300 nM each of specific forward and reverse primers, and 9 μl RealMasterMix/SYBR solution. The cycling conditions were as follows: 10 min at 95 °C followed by 40 rounds of 20 s at 95 °C, 20 s at 58 °C and 20 s at 68 °C. Melting curve analysis was performed from 56 °C to 95 °C to confirm the specificity of the amplification. The reactions were run in triplicate for the calibration curves and in duplicate for the 12 samples. The quantities of the 8 candidate genes in the 12 samples were determined based on their own calibration curve [7,31]. To compare the performance of the reference genes, nine differentially expressed genes and one non-differentially expressed gene were selected for qPCR (Table A1).
2.6. Gene expression stability and the optimal number of reference genes
Gene expression stability was evaluated using two distinct algorithms, a pairwise comparison approach implemented in geNorm [32] and a model-based approach implemented in NormFinder [24]. The geNorm algorithm computes the average expression stability M to rank the genes. The genes with low M values have low variations. Stepwise elimination of the genes with the highest M value yields the two most stable genes. Furthermore, geNorm determines the optimal number of genes required for reliable normalization [32]. NormFinder estimates the intragroup and intergroup variations, and then ranks the genes in terms of stability [24].
3. Results
3.1. Instability of three commonly used housekeeping genes
The transcriptional responses to hypobaric hypoxia were examined in locusts using oligo microarrays [7–9]. We included the housekeeping genes 18S, β-actin, and GAPDH in the microarrays to serve as positive controls. The gene expression of the three housekeeping genes was influenced by hypobaric hypoxia. Up to 20 of the 96 β-actin (Actb) probes, as well as 30 of the 48 18S probes were significantly induced, whereas 12 of the 48 GAPDH probes were suppressed (Fig. 1). This indicated that the three classical housekeeping genes were unsuitable reference genes for studying gene expression under our experimental conditions.
Fig. 1.
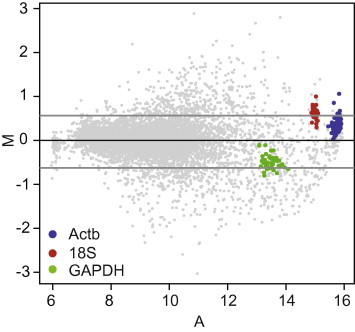
Instability of three commonly used reference genes. Each spot on the MA plot represents a unique gene on the microarray. Three commonly used reference genes are distinguished in different colors, with β-actin (Actb) in blue, 18S in red, and GAPDH in green. M = log2(R/G), , R and G represent the fluorescent intensities of red and green channels. The two gray horizontal lines indicate the fold change cutoff value of 1.5. (For interpretation of reference to color in this figure legend, the reader is referred to the web version of this article.)
3.2. Selection and characteristics of candidate reference genes
To identify novel reference genes, we selected 125 genes with FDR > 0.99 as preliminary candidates (Fig. 2A). The logFC values of these preliminary candidates were between −0.009 and 0.006 (Fig. 2B), indicating these genes were not significantly altered under hypobaric hypoxia. To obtain candidates with reliable expression, we filtered out spots with relatively low intensities and signals. Five candidates involved in different biological processes were identified (Fig. 2B). To compare the performance of the newly identified candidates and the conventional reference genes, we included 18S, β-actin, and GAPDH for further analysis. The identities, putative functions, and PCR primers of the candidate reference genes are summarized in Table 1.
Fig. 2.
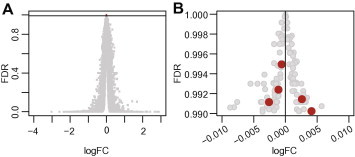
Selection of candidate reference genes for qPCR. (A) The output of the Limma software was used for candidate selection. Genes with false discovery rates (FDRs) > 0.99, indicated by the horizontal line, were selected as initial candidates. FC, fold change. (B) The candidates were further filtered based on the intensities and signal-to-noise ratios. Five genes (red spots), together with the three traditionally used reference genes, were selected as candidate reference genes for further evaluation using qPCR. (For interpretation of reference to color in this figure legend, the reader is referred to the web version of this article.)
3.3. Identification of the most stable reference genes
The expression levels of the candidate reference genes were presented as raw quantification cycle (Cq) values [33] that were inversely related to the abundance of a specific transcript in the sample (Fig. 3A). 18S showed the highest expression in all samples, with a mean Cq of 12.3, which is expected because it is highly abundant in eukaryotic cells and it can be used as a visual marker for verifying RNA quality in gel electrophoresis. However, 18S showed the 2nd highest variation in Cq values (1.79 cycles) in our experiment. The highest variation was observed in Cht2 (1.94 cycles), whereas the lowest variation was in Pgp (0.62 cycles). Rrp showed the lowest expression level, with a mean Cq of 23.1 and a variation of 1.33 cycles.
Fig. 3.
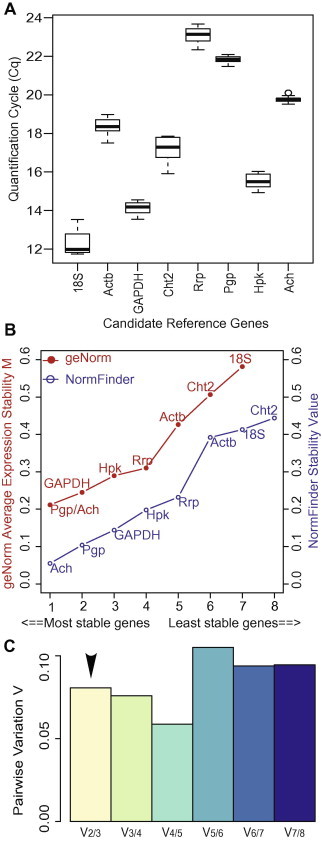
Identification of the most stable reference genes. (A) Expression levels of candidate reference genes. The expression levels in the 12 samples are represented as quantification cycle (Cq) values obtained from the qPCR experiments. The median is indicated by a line in each box and the box defines the 25th and 75th percentiles. Whiskers represent the 10/90 percentile ranges. Circles represent the potential outliers. (B) Ranking of candidate reference genes according to gene expression stability. Expression stability was evaluated using two different algorithms implemented in geNorm and NormFinder. The genes with lower stability values were more stably expressed. (C) Pairwise variation analysis to determine the optimal number of reference genes for normalization. The V2/3 value is below the proposed cut-off of 0.15, which indicates that the two genes are adequate for the accurate normalization of the gene expression data.
Gene expression stability was evaluated using geNorm [32] and NormFinder [24]. Both methods ranked most of the genes in the same order (Fig. 3B). GeNorm and NormFinder both identified Pgp and Ach as the two most stable reference genes, and NormFinder further distinguished Ach as the most stable gene. Both methods identified Cht2 and 18S as the least stable genes, but ranked them in different order.
To determine the optimal number of reference genes required for accurate normalization, a pairwise variation analysis was conducted using geNorm. The recommended threshold for pairwise variation was 0.15, below which the inclusion of an additional reference gene for normalization is unnecessary [32,34]. Pairwise variation V showed that the V2/3 was below 0.15 (Fig. 3C), which suggests that the utilization of Ach and Pgp is sufficient for the accurate normalization of the qPCR data.
3.4. Performance of the most stable reference gene
To compare the performance of the novel reference genes and the traditional housekeeping genes, we conducted qPCR on 10 genes using 18S and Ach as references. 18S was the least stable of the candidate reference genes (Fig. 3B), whereas Ach was the most stable of the newly identified reference genes. When 18S was used as a reference, the fold changes of several genes differed greatly between the qPCR and microarray analyses. For instance, Hsp20 and Pgk were suppressed in the microarray but enhanced in the qPCR; Glut8 was enhanced in the microarray but suppressed in the qPCR. The log fold change of Hsc70 was 0.88 based on the microarray but was 0.03 in the qPCR (Fig. 4A). The overall correlation of the qPCR with the microarray data was not significant (Pearson product–moment correlation coefficient r = 0.546, p = 0.103; Fig. 4A). However, when Ach was used, the discrepancies between the microarray and the qPCR decreased and the correlation between the two methods was greatly improved (Pearson product–moment correlation coefficient r = 0.918, p < 0.001) (Fig. 4B).
Fig. 4.
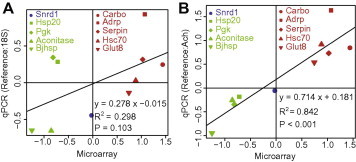
Performance of the newly identified reference gene. qPCR was conducted with 18S (A) and Ach (B) as the reference genes. The red spots indicate the upregulated genes based on the microarray results, green indicates the downregulated genes, and blue indicates the stable genes. The x-axis and the y-axis represent the log2-based gene expression. When 18S was used as the reference, the correlation between the microarray and the qPCR results was not significant (Pearson product–moment correlation coefficient r = 0.546, p = 0.103). However, when the newly identified reference gene was used, the correlation was significant (Pearson product–moment correlation coefficient r = 0.918, p < 0.001). (For interpretation of reference to color in this figure legend, the reader is referred to the web version of this article.)
4. Discussion
The qPCR has become the most common method for quantifying gene expression levels. The accuracy of this method depends highly on the stability of the reference genes. However, no reference genes are suitable for all experimental conditions. Thus, identifying condition-specific reference genes is necessary for the accurate quantification of gene expression. We presented how to identify condition-specific reference genes from microarray data.
β-Actin and 18S rRNA have been used as reference genes for qPCR in previous studies on locust phase change [7,8]. However, their gene expression levels were altered when the locusts were subjected to hypobaric hypoxia (Fig. 1), which necessitated the identification of new reference genes. Different methods for selecting candidate reference genes have been used in previous studies, such as the re-evaluation of traditional references under new circumstances [35–37] and the identification of novel reference genes through the meta-analysis of large datasets [22–24]. We used the Limma results [28] to identify novel candidate reference genes from our condition-specific microarray data. Limma computed the logFC and FDR of every gene in the microarray, which were used to identify the stably expressed genes. Unlike the criteria for the differentially expressed genes, we identified genes with low absolute logFC and high FDR as stably expressed genes (Fig. 2). The stably expressed genes were further filtered and evaluated to identify the most suitable reference genes. The identification of condition-specific reference genes was relatively simple and could be translated to other gene expression studies based on microarrays and even RNA-seq. We propose examining the performance of traditional housekeeping genes in large-scale gene expression data before applying them to normalize the gene expression levels in qPCR. If the traditional housekeeping genes are influenced in a particular experimental system, the large-scale gene expression data can be used to identify condition-specific reference genes.
The identification of condition-specific reference genes is facilitated by diverse algorithms, such as pairwise comparisons and model-based evaluations of intergroup and intragroup variations that are implemented in geNorm [32] and NormFinder [24] respectively. By combining the two distinct algorithms, we identified Ach and Pgp as the two most stable reference genes. However, different algorithms do not always reach the same conclusion as in our present study. For instance, one of the two most stable reference genes identified by geNorm and NormFinder was different in circadian study of different tissues and mouse strains [11]. Nevertheless, the two most stable genes identified by the two methods both showed better performance than the non-validated gene [11]. To identify reliable reference genes using different algorithms, we should be aware of their strengths and weaknesses. For instance, geNorm determines the optimal number of reference genes whereas NormFinder does not; however, geNorm risks identifying the coregulated genes as the most stable references whereas NormFinder does not [24]. By combining different algorithms, appropriate reference genes for a particular experimental system can be identified.
Pairwise variations indicated that two genes, Ach and Pgp, were adequate for the accurate normalization of the qPCR data (Fig. 3C). Both Ach and Pgp are novel reference genes. Ach is involved in acetate utilization in the mitochondria [38] and fatty acid metabolism [39]. Pgp is a housekeeping enzyme involved in the catabolism of the intracellular 2-phosphoglycolate produced during DNA repair [40]. To demonstrate the performance of the new reference genes, we selected only Ach, the most stable reference gene, for comparison with 18S. As expected, Ach outperformed 18S rRNA in the accurate normalization of gene expression data. However, we cannot simply conclude that ribosomal RNA is an unsuitable reference gene for studies under hypoxia. An independent evaluation of reference genes under extreme hypoxia (1 kPa oxygen pressure) demonstrated that 28S rRNA is constantly expressed in four biologically diverse cell lines and the best reference gene for comparative transcription analysis [41]. Thus, different levels of hypoxia may trigger different biological responses, which complicates and necessitates the selection of condition-specific reference genes when studying the transcriptional responses to hypoxia.
In conclusion, we identified and validated suitable reference genes for studying locust responses to hypobaric hypoxia. The application of validated reference genes will improve the accuracy of gene expression quantification and avoid erroneous conclusions. This study demonstrated the necessity and feasibility of identifying condition-specific reference genes and the solution can be translated to other gene expression studies based on microarrays and even RNA-seq.
Acknowledgements
We would like to thank Prof. Jon Harrison and Dr. Arianne Cease from Arizona State University, Dr. Xianhui Wang and Dr. Feng Jiang from Institute of Zoology, Chinese Academy of Sciences, for their critical review of the draft manuscript. This research was supported by grants from the National Natural Science Foundation of China (Grant Nos. 31070366 and 30970407) and the National Basic Research Program of China (Grant No. 2012CB114102).
Supplementary Material
Supplementary material associated with this article can be found, in the online version, at doi:10.1016/j.fob.2012.08.001
Appendix. Supplementary material
PCR primers used for comparing the genes via microarray and qPCR analyses
References
- 1.Magalhães J., Ascensão A., Soares J.M.C. Acute and severe hypobaric hypoxia increases oxidative stress and impairs mitochondrial function in mouse skeletal muscle. J. Appl. Physiol. 2005;99:1247–1253. doi: 10.1152/japplphysiol.01324.2004. [DOI] [PubMed] [Google Scholar]
- 2.Liao W., Cai M., Chen J. Hypobaric hypoxia causes deleterious effects on spermatogenesis in rats. Reproduction. 2010;139:1031–1038. doi: 10.1530/REP-09-0557. [DOI] [PubMed] [Google Scholar]
- 3.Gelfi C., De Palma S., Ripamonti M. New aspects of altitude adaptation in Tibetans: a proteomic approach. FASEB J. 2004;18:612–614. doi: 10.1096/fj.03-1077fje. [DOI] [PubMed] [Google Scholar]
- 4.Lippl F.J., Neubauer S., Schipfer S. Hypobaric hypoxia causes body weight reduction in obese subjects. Obesity. 2010;18:675–681. doi: 10.1038/oby.2009.509. [DOI] [PubMed] [Google Scholar]
- 5.Ekman D.R., Lorenz W.W., Przybyla A.E. SAGE analysis of transcriptome responses in arabidopsis roots exposed to 2,4,6-trinitrotoluene. Plant Physiol. 2003;133:1397–1406. doi: 10.1104/pp.103.028019. [DOI] [PMC free article] [PubMed] [Google Scholar]
- 6.Kang L., Chen X., Zhou Y. The analysis of large-scale gene expression correlated to the phase changes of the migratory locust. Proc. Natl. Acad. Sci. U.S.A. 2004;101:17611–17615. doi: 10.1073/pnas.0407753101. [DOI] [PMC free article] [PubMed] [Google Scholar]
- 7.Guo W., Wang X., Ma Z. CSP and Takeout genes modulate the switch between attraction and repulsion during behavioral phase change in the migratory locust. PLoS Genet. 2011;7:e1001291. doi: 10.1371/journal.pgen.1001291. [DOI] [PMC free article] [PubMed] [Google Scholar]
- 8.Ma Z., Guo W., Guo X. Modulation of behavioral phase changes of the migratory locust by the catecholamine metabolic pathway. Proc. Natl. Acad. Sci. U.S.A. 2011;108:3882–3887. doi: 10.1073/pnas.1015098108. [DOI] [PMC free article] [PubMed] [Google Scholar]
- 9.Wang H., Ma Z., Cui F. Parental phase status affects the cold hardiness of progeny eggs in locusts. Funct. Ecol. 2012;26:379–389. [Google Scholar]
- 10.Chen S., Yang P., Jiang F. De novo analysis of transcriptome dynamics in the migratory locust during the development of phase traits. PLoS ONE. 2010;5:e15633. doi: 10.1371/journal.pone.0015633. [DOI] [PMC free article] [PubMed] [Google Scholar]
- 11.Kosir R., Acimovic J., Golicnik M. Determination of reference genes for circadian studies in different tissues and mouse strains. BMC Mol. Biol. 2010;11:60. doi: 10.1186/1471-2199-11-60. [DOI] [PMC free article] [PubMed] [Google Scholar]
- 12.Kidd M., Nadler B., Mane S. GeneChip, geNorm, and gastrointestinal tumors: novel reference genes for real-time PCR. Physiol. Genomics. 2007;30:363–370. doi: 10.1152/physiolgenomics.00251.2006. [DOI] [PubMed] [Google Scholar]
- 13.Spanakis E. Problems related to the interpretation of autoradiographic data on gene expression using common constitutive transcripts as controls. Nucleic Acids Res. 1993;21:3809–3819. doi: 10.1093/nar/21.16.3809. [DOI] [PMC free article] [PubMed] [Google Scholar]
- 14.Piana C., Wirth M., Gerbes S. Validation of reference genes for qPCR studies on Caco-2 cell differentiation. Eur. J. Pharm. Biopharm. 2008;69:1187–1192. doi: 10.1016/j.ejpb.2008.03.008. [DOI] [PubMed] [Google Scholar]
- 15.Watson S., Mercier S., Bye C. Determination of suitable housekeeping genes for normalisation of quantitative real time PCR analysis of cells infected with human immunodeficiency virus and herpes viruses. Virol. J. 2007;4:130. doi: 10.1186/1743-422X-4-130. [DOI] [PMC free article] [PubMed] [Google Scholar]
- 16.Udvardi M.K., Czechowski T., Scheible W.R. Eleven golden rules of quantitative RT-PCR. Plant Cell. 2008;20:1736–1737. doi: 10.1105/tpc.108.061143. [DOI] [PMC free article] [PubMed] [Google Scholar]
- 17.Cicinnati V., Shen Q., Sotiropoulos G. Validation of putative reference genes for gene expression studies in human hepatocellular carcinoma using real-time quantitative RT-PCR. BMC Cancer. 2008;8:350. doi: 10.1186/1471-2407-8-350. [DOI] [PMC free article] [PubMed] [Google Scholar]
- 18.Majerowicz D., Alves-Bezerra M., Logullo R. Looking for reference genes for real-time quantitative PCR experiments in Rhodnius prolixus (Hemiptera: Reduviidae) Insect Mol. Biol. 2011;20:713–722. doi: 10.1111/j.1365-2583.2011.01101.x. [DOI] [PubMed] [Google Scholar]
- 19.Jain M., Nijhawan A., Tyagi A.K. Validation of housekeeping genes as internal control for studying gene expression in rice by quantitative real-time PCR. Biochem. Biophys. Res. Commun. 2006;345:646–651. doi: 10.1016/j.bbrc.2006.04.140. [DOI] [PubMed] [Google Scholar]
- 20.Radonić A., Thulke S., Mackay I.M. Guideline to reference gene selection for quantitative real-time PCR. Biochem. Biophys. Res. Commun. 2004;313:856–862. doi: 10.1016/j.bbrc.2003.11.177. [DOI] [PubMed] [Google Scholar]
- 21.An Y., Reimers K., Allmeling C. Validation of differential gene expression in muscle engineered from rat groin adipose tissue by quantitative real-time PCR. Biochem. Biophys. Res. Commun. 2012;421:736–742. doi: 10.1016/j.bbrc.2012.04.073. [DOI] [PubMed] [Google Scholar]
- 22.Popovici V., Goldstein D., Antonov J. Selecting control genes for RT-QPCR using public microarray data. BMC Bioinformatics. 2009;10:42. doi: 10.1186/1471-2105-10-42. [DOI] [PMC free article] [PubMed] [Google Scholar]
- 23.de Jonge H.J.M., Fehrmann R.S.N., de Bont E.S.J.M. Evidence based selection of housekeeping genes. PLoS ONE. 2007;2:e898. doi: 10.1371/journal.pone.0000898. [DOI] [PMC free article] [PubMed] [Google Scholar]
- 24.Andersen C.L., Jensen J.L., Orntoft T.F. Normalization of real-time quantitative reverse transcription-PCR data: a model-based variance estimation approach to identify genes suited for normalization, applied to bladder and colon cancer data sets. Cancer Res. 2004;64:5245–5250. doi: 10.1158/0008-5472.CAN-04-0496. [DOI] [PubMed] [Google Scholar]
- 25.Guénin S., Mauriat M., Pelloux J. Normalization of qRT-PCR data: the necessity of adopting a systematic, experimental conditions-specific, validation of references. J. Exp. Bot. 2009;60:487–493. doi: 10.1093/jxb/ern305. [DOI] [PubMed] [Google Scholar]
- 26.Winnebeck E.C., Millar C.D., Warman G.R. Why does insect RNA look degraded. J. Insect. Sci. 2010;10:159. doi: 10.1673/031.010.14119. [DOI] [PMC free article] [PubMed] [Google Scholar]
- 27.Ritchie M.E., Silver J., Oshlack A. A comparison of background correction methods for two-colour microarrays. Bioinformatics. 2007;23:2700–2707. doi: 10.1093/bioinformatics/btm412. [DOI] [PubMed] [Google Scholar]
- 28.Smyth G.K. Linear models and empirical bayes methods for assessing differential expression in microarray experiments. Stat. Appl. Genet. Mol. Biol. 2004;3 doi: 10.2202/1544-6115.1027. Article3. [DOI] [PubMed] [Google Scholar]
- 29.Benjamini Y., Hochberg Y. Controlling the false discovery rate: a practical and powerful approach to multiple testing. J. Roy. Statist. Soc. Ser. B. 1995;57:289–300. [Google Scholar]
- 30.Pickett S., Carriedo S., Wang C., Determining the signal-to-noise ratio and optimal photomultiplier gain setting in the GenePix 4000B (Application Note), (2001).
- 31.Guo W., Wang X.H., Zhao D.J. Molecular cloning and temporal–spatial expression of I element in gregarious and solitary locusts. J. Insect Physiol. 2010;56:943–948. doi: 10.1016/j.jinsphys.2010.05.007. [DOI] [PubMed] [Google Scholar]
- 32.Vandesompele J., De Preter K., Pattyn F. Accurate normalization of real-time quantitative RT-PCR data by geometric averaging of multiple internal control genes. Genome Biol. 2002;3 doi: 10.1186/gb-2002-3-7-research0034. RESEARCH0034. [DOI] [PMC free article] [PubMed] [Google Scholar]
- 33.Bustin S.A., Benes V., Garson J.A. The MIQE guidelines: minimum information for publication of quantitative real-time PCR experiments. Clin. Chem. 2009;55:611–622. doi: 10.1373/clinchem.2008.112797. [DOI] [PubMed] [Google Scholar]
- 34.Foldager C.B., Munir S., Ulrik-Vinther M. Validation of suitable house keeping genes for hypoxia-cultured human chondrocytes. BMC Mol. Biol. 2009;10:94. doi: 10.1186/1471-2199-10-94. [DOI] [PMC free article] [PubMed] [Google Scholar]
- 35.McCurley A.T., Callard G.V. Characterization of housekeeping genes in zebrafish: male-female differences and effects of tissue type, developmental stage and chemical treatment. BMC Mol. Biol. 2008;9:102. doi: 10.1186/1471-2199-9-102. [DOI] [PMC free article] [PubMed] [Google Scholar]
- 36.Nicot N., Hausman J.-F., Hoffmann L. Housekeeping gene selection for real-time RT-PCR normalization in potato during biotic and abiotic stress. J. Exp. Bot. 2005;56:2907–2914. doi: 10.1093/jxb/eri285. [DOI] [PubMed] [Google Scholar]
- 37.Silver N., Best S., Jiang J. Selection of housekeeping genes for gene expression studies in human reticulocytes using real-time PCR. BMC Mol. Biol. 2006;7:33. doi: 10.1186/1471-2199-7-33. [DOI] [PMC free article] [PubMed] [Google Scholar]
- 38.Lee F.J., Lin L.W., Smith J.A. Acetyl-CoA hydrolase involved in acetate utilization in Saccharomyces cerevisiae. Biochim. Biophys. Acta. 1996;1297:105–109. doi: 10.1016/0167-4838(96)00109-4. [DOI] [PubMed] [Google Scholar]
- 39.Suematsu N., Okamoto K., Isohashi F. Mouse cytosolic acetyl-CoA hydrolase, a novel candidate for a key enzyme involved in fat metabolism: cDNA cloning, sequencing and functional expression. Acta Biochim. Pol. 2002;49:937–945. [PubMed] [Google Scholar]
- 40.Teresa Pellicer M., Felisa Nunez M., Aguilar J. Role of 2-phosphoglycolate phosphatase of Escherichia coli in metabolism of the 2-phosphoglycolate formed in DNA repair. J. Bacteriol. 2003;185:5815–5821. doi: 10.1128/JB.185.19.5815-5821.2003. [DOI] [PMC free article] [PubMed] [Google Scholar]
- 41.Zhong H., Simons J.W. Direct comparison of GAPDH, beta-actin, cyclophilin, and 28S rRNA as internal standards for quantifying RNA levels under hypoxia. Biochem. Biophys. Res. Commun. 1999;259:523–526. doi: 10.1006/bbrc.1999.0815. [DOI] [PubMed] [Google Scholar]
Associated Data
This section collects any data citations, data availability statements, or supplementary materials included in this article.
Supplementary Materials
PCR primers used for comparing the genes via microarray and qPCR analyses