Abstract.
A swept-source dual-wavelength photothermal (DWP) optical coherence tomography (OCT) system is demonstrated for quantitative imaging of microvasculature oxygen saturation. DWP-OCT is capable of recording three-dimensional images of tissue and depth-resolved phase variation in response to photothermal excitation. A 1,064-nm OCT probe and 770-nm and 800-nm photothermal excitation beams are combined in a single-mode optical fiber to measure microvasculature hemoglobin oxygen saturation () levels in phantom blood vessels with a range of blood flow speeds (0 to ). A 50-μm-diameter blood vessel phantom is imaged, and levels are measured using DWP-OCT and compared with values provided by a commercial oximeter at various blood oxygen concentrations. The influences of blood flow speed and mechanisms of SNR phase degradation on the accuracy of measurement are identified and investigated.
Keywords: optical coherence tomography, dual-wavelength, imaging, phase-sensitive, microvasculature, hemoglobin oxygen saturation, phantom
1. Introduction
Noninvasive quantitative evaluation of microvasculature hemoglobin oxygen saturation () in tissue is important in early detection and monitoring the progression of inflammatory and ischemic diseases such as cancer, stroke, and glaucoma.1,2 Various approaches have been used to assess in vivo microvascular oxygen saturation, including oxygen-sensitive microelectrodes,3–7 magnetic resonance imaging (MRI),8–12 reflection spectroscopic oximetry.13–18 and phosphorescence quenching.17,19–24 Measurement by oxygen-sensitive microelectrodes is a point measurement method and is primarily limited to animal studies. MRI has limited spatial (100 to 150 μm) and temporal (tens of seconds to minutes) resolution. The phosphorescence quenching technique has limited spatial resolution (e.g., 50 μm), and no oxygen sensitive dyes that are approved by the United States Food and Drug Administration are available for clinical translation.
A useful three-dimensional imaging technique, optical coherence tomography (OCT), was introduced in 1991 as a time domain approach25 and was later used as a frequency domain method.26,27 OCT implementation in the frequency domain improves signal-to-noise ratio and allows high-speed image acquisition. More recently, Huber et al. showed that, for an equivalent signal-to-noise ratio, swept-source (SS) OCT with balanced detection provides higher acquisition rates compared with spectrometer-based Fourier domain OCT approaches.28
Biomedical investigators are interested in applying OCT approaches to measure microvasculature in tissues. Spectroscopic Fourier domain OCT (SFD-OCT)29,30 has been reported to measure depth-resolved microvasculature oxygenation, but an appropriate model has not been given to estimate the attenuation coefficients required to determine blood levels using OCT light in the near infrared spectral region.31 SFD-OCT has been shown to provide sufficient sensitivity to quantify micro vascular levels using visible wavelengths (460 to 700 nm) where hemoglobin absorption is relatively large.32,33 However, SFD-OCT using visible wavelength sources is compromised by limited imaging depth, which is restricted by increased scattering.
Photothermal OCT is a functional imaging technique that can measure the optical pathlength variation of OCT light backscattered from tissues in response to an excitation beam. Adler has demonstrated photothermal OCT using a gold nanoparticle contrast agent.34 Skala has developed photothermal OCT for high-resolution molecular imaging,35 and Paranjape has reported using photothermal OCT to detect macrophages in tissue.36 So far, reported applications of photothermal OCT have focused primarily on light absorption by nanoparticles. Previously, we reported using dual-wavelength photothermal OCT (DWP-OCT) to measure microvasculature in both phantom37 and in vivo38 blood vessels using a common-path phase-sensitive (PhS) OCT system.39 Because we used a common path interferometer, imaging by scanning the beam was difficult, and the results were limited to point microvasculature measurement. In this study, we report a DWP-OCT system that uses a two-beam interferometer and allows for the imaging and measurement of levels.
Compared to two-beam interferometers, common path interferometry provides higher sensitivity and stability to measure the phase of interference fringes of light backscattered from transparent and scattering media. Despite these advantages, several drawbacks of prior common-path DWP-OCT system37–39 design are recognized. Recording en-face images is challenged by incorporating a 2D scanning system into the sample arm. A short working distance associated with common-path DWP-OCT introduces problems for positioning the OCT probe beam at a desired sample measurement location. Also, the short working distance makes intravascular, retinal, and endoscopic applications challenging. We present a DWP-OCT system using a fiber two-beam interferometer to image and measure levels in a phantom blood vessel.
2. Methods
2.1. DWP-OCT System
In this study, a DWP-OCT system using a fiber Michelson interferometer was constructed for imaging and blood measurement. Interferometric fringe phase stabilization is a critical feature required for measurement. In a generic phase-sensitive SS OCT system, two mechanisms contribute to phase noise: inconsistency of the start wavelength between successive A-scans, and nonspecific mechanical movement of optical elements in sample and reference arms. To resolve the first issue, 5% of light in the sample arm is coupled to a high-reflectivity mirror, which is sufficient to form a high SNR interference fringe signal with reference light but too weak to introduce an artifactual autocorrelation and interference signal with light backscattering from the sample. Light reflecting from a high-reflectivity mirror in the sample path introduces a feature-line in recorded B-scans positioned below the imaging media and does not compromise image quality. To minimize the second source of phase noise (due to nonspecific mechanical movement of optical elements), the sample beam scanning system is constructed using a stable mechanical cage system.
Blood measurement value is dependent on the ratio () of optical pathlength () signal amplitude at modulation frequencies introduced by 770-nm and 800-nm photothermal excitation light. To balance incident fluence of photothermal excitation beams, the scanning optics is designed to provide nearly equivalent spot sizes for 770-nm and 800-nm light.
The DWP-OCT system (Fig. 1) for imaging and blood measurement consists of two major systems: a SS PhS OCT system that provides accurate depth-resolved phase measurement with a 300-pm lower bound of detectable signal amplitude, and two excitation lasers (770 and 800 nm) that are intensity modulated at 400 and 380 Hz, respectively, and introduce a nanometer-scale harmonic signal amplitude due to blood absorption.
Fig. 1.
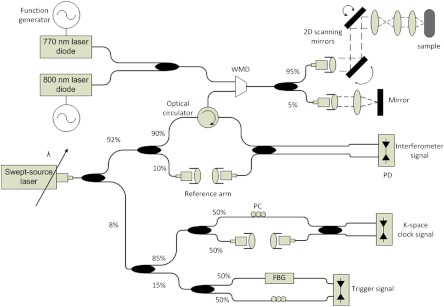
DWP-OCT system schematic. WDM: wavelength division multiplexer, FBG: fiber Bragg grating, PC: polarization controller, PD: photodetector.
The phase-sensitive OCT system uses a swept source laser (HSL-1000, Santec Corp. Komaki, Aichi, Japan) with a 28-kHz A-line rate, a center wavelength at 1,060 nm, and full-wave-half-maximum spectral width of 58 nm. Single-mode optical fiber (HI1060, Corning Inc., Corning, NY) is utilized to construct the interferometer. Light emitted by the SS laser is split into three subsystems: trigger, sampling clock, and signal interferometer.
The trigger subsystem utilizes a fiber Bragg grating (FBG) to ensure the digitizer starts data acquisition at a consistent and repeatable wavenumber for each A-scan. The sampling clock subsystem consists of a Mach-Zehnder interferometer with a clock rate set by adjusting the interferometric light delay. The sampling clock signal received by a balanced photodetector is input into an external analog circuit, frequency quadrupled, and used as a sampling trigger for the analog-to-digital converter.40 The third subsystem is the Michelson signal interferometer with sample and reference arms. An optical circulator (1060 PI TGG, Agiltron Inc., Woburn, MA) is used in the sample arm of the Michelson interferometer to increase SNR.41 The sample arm contains two light paths: a path to the phantom blood vessel with an achromatic scanning system (consisting of two galvanometers and an afocal telescope), and a high-reflectivity mirror used for phase stabilization. The achromatic scanning system is designed and simulated in optical design software (Zemax, Radiant Zemax LLC, Redmond, WA) and provides micrometer-scale lateral resolution for imaging three co-aligned beams; the computed diffraction encircled energy computation gives a 13-μm lateral resolution for 770-nm and 800-nm excitation beams, along with a 14-μm resolution for the 1,060-nm PhS-OCT probe beam.
After the interference fringe signal is acquired uniformly in wavenumber (or optical frequency), computing a fast Fourier transform (FFT) of the signal, we obtain a complex number data array for each A-scan. The complex number amplitude is used to construct an OCT intensity image, and the complex number angle is used to determine the phase of the depth-resolved fringe signal. The signal phase of light reflecting from the mirror in the sample path is utilized to correct for any error introduced by delay in data acquisition. Phase errors at any sample depth () are eliminated by subtracting the reference phase scaled by depth from the sample phase42 as
| (1) |
where is the corrected sample phase, is the sample phase acquired from the raw signal FFT, is the reference phase obtained from interference between light reflected from the mirror in the sample path and the reference arm, and and are the sample and reference depths, respectively.
The system operates in real-time in either OCT intensity imaging or M-mode phase imaging. Data acquisition and signal processing software are written in Labview (National Instrument Corp., Austin, TX). The system sensitivity is 102 dB (with shot-noise limited sensitivity of 107 dB), and the axial resolution is 13 μm in tissue with the application of a real-time digital dispersion compensationalgorithm.43,44 The axial resolution is limited by polarization mode dispersion in the circulator. After Fourier transform of M-mode phase data (i.e., 1-s duration), with a calibration process, the phase of light backscattered from a selected sample depth is converted to the optical pathlength (, where is the center wavelength and is the corrected sample phase). The mean noise level in the signal frequency region corresponding to the intensity modulation of photothermal excitation light (360 to 420 Hz) is taken as the signal noise floor and measured at 300 pm.
Photothermal excitation beams are emitted from two 100-mW single-mode fiber (HI780, Corning Inc., Corning, NY) pigtailed laser diodes (QFLD-780-100S,QPhotonics LLC, Ann Arbor, MI for 770 nm and QFLD-795-100S for 800 nm). Light from these sources is coupled into the DWP-OCT system’s sample arm through a wavelength division multiplexer (WDM) (PSK-000851, Gould Fiber Optics, Millersville, MD). Both the WDM and the PhS-OCT system are constructed using HI1060 Corning fiber, which is single-mode fiber for 1,060-nm probe light and allows two or three propagation modes at photothermal excitation wavelengths of 770 nm and 800 nm. The temperature of each laser diode is precisely controlled within a fraction of a degree (K) and selected to ensure emission at the desired wavelength as calibrated using a spectrometer. The photothermal excitation power incidents on the sample for 800-nm and 770-nm wavelengths are 2.78 mW and 2.87 mW, respectively; both are within ANSI limits for skin. Intensity modulation frequencies for photothermal excitation light [770 nm (400 Hz) and 800 nm (380 Hz)] are selected in a signal frequency range where the phase noise is low (0.3 nm) and the signal amplitude is high. The procedure for determining the optimum photothermal excitation frequency to maximize signal-to-noise ratio for blood was reported previously.38 OCT probe (1,064-nm) and photothermal excitation (770-nm and 800-nm) beams are co-aligned and coincident on the sample.
2.2. Calculation
We assume that signal amplitude due to absorption by blood is linear with the fluence of photothermal excitation light,45 as derived and reported previously.37,38 Neglecting the effect of thermal diffusion, level can be estimated from measurement in response to 770-nm (1) and 800-nm (2) photothermal excitation.
| (2) |
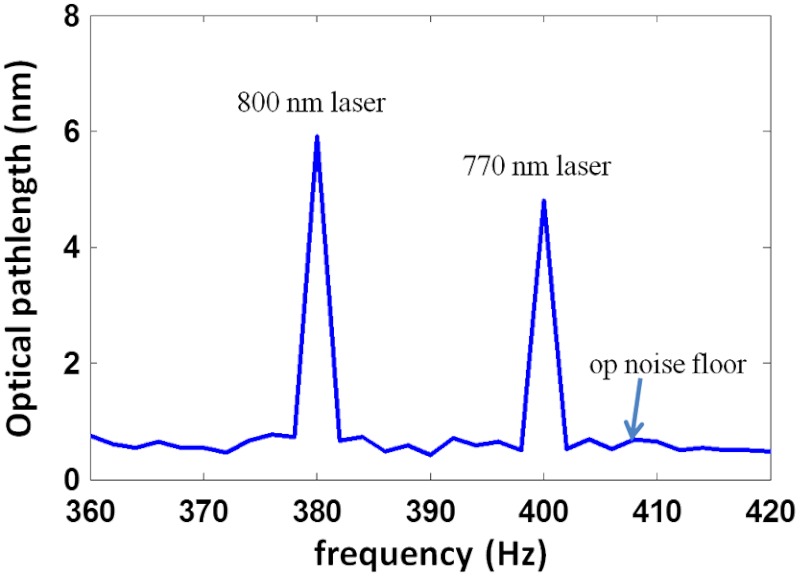
where is the concentration of oxygenated hemoglobin (mM); is the concentration of deoxygenated hemoglobin (mM); ; is the measured optical pathlength signal amplitude; represents the fluence over one period; is the period of photothermal excitation; is the average intensity of excitation light on the blood vessel; and are the tabulated molar extinction coefficients of oxygenated and deoxygenated hemoglobin (), respectively; and subscripts 1 (770 nm) and 2 (800 nm) correspond to the wavelengths of excitation light (, , , ). The ratio of the two excitation beams’ fluence () at the sample is calibrated before measurement. The signal amplitude at each photothermal excitation wavelength ( and ) is determined by computing the magnitude of the signal phase oscillation at the respective modulation frequencies of excitation light (Fig. 2).
Fig. 2.
Spectra of signal amplitude induced by 770-nm (5-nm, 400-Hz) and 800-nm (6-nm, 380-Hz) excitation light.
2.3. Blood Vessel Phantom and Blood Flow
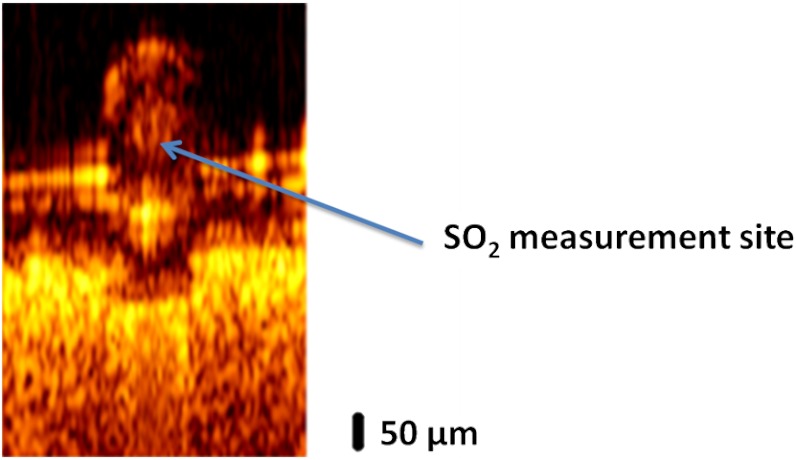
A 50-μm inner diameter polytetrafluoroethylene conduit (SUBL 060, Braintree Scientific Inc., Braintree, MA) containing porcine blood is used as a blood vessel phantom. A desired blood level is achieved by adding sodium dithionite to the blood sample to deoxygenate. Six blood samples are prepared at different levels (99.6%, 89.2%, 84.1%, 69.0%, 57.3%, and 3.0%). To provide a scattering background for imaging, the phantom blood vessel is placed on a sheet of white-colored copy paper. After imaging, blood measurements are recorded in an M-mode acquisition at a selected position in the lumen of the phantom vessel (Fig. 3).
Fig. 3.
B-scan image of a phantom vessel with a 50-μm inner diameter containing blood positioned on a sheet of white-colored copy paper.
To investigate the effect of blood flow on measured by DWP-OCT, a digital syringe pump (AL-1000,World Precision Instruments, Sarasota, FL) is used to introduce blood flow in the phantom vessel at a fixed level (98.2%) corresponding to an arteriole. At the fixed level, DWP-OCT measurements are recorded at blood flow speeds from 0 to . For each blood flow speed, levels are also measured at the same position in the lumen of the phantom vessel.
3. Results
We observed signal amplitude in the phantom vessel containing blood resulting from photothermal excitation with 770-nm and 800-nm light. In a control experiment, with the phantom vessel containing water, no signal was detected in response to photothermal excitation. Three experiments were completed to investigate the functionality of the DWP-OCT system: en-face imaging of the blood vessel phantom, blood measurement without flow, and influence of blood flow speed on measurement.
3.1. Phantom Image
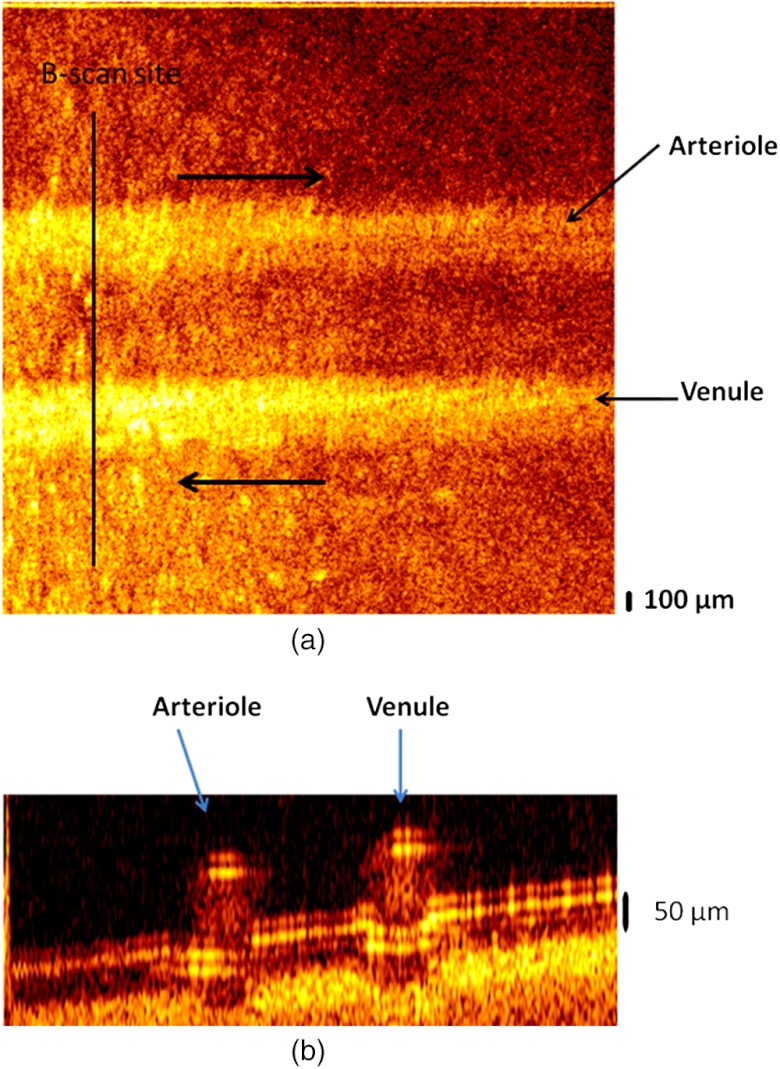
A two-vessel phantom was constructed to demonstrate DWP-OCT imaging of an arterial-venous vessel pair. Two 50-μm inner-diameter phantom vessels were attached to a sheet of white-colored copy paper to provide a scattering background for imaging. The two phantom vessels were filled with porcine blood, and digital syringe pumps were used to introduce flow () in opposite directions in each phantom vessel (Fig. 4). Average flow speed was calculated by dividing the syringe pump infusion flow rate (0, 20, 40, 60, 80, 100, and ) by the phantom vessel’s lumen cross-sectional area ().
Fig. 4.
(a) En-face image of an arterial-venous phantom vessel pair. (b) B-scan image at the indicated site. Arrows in (a) indicate blood flow direction.
3.2. Blood Measurement in Phantom Vessel without Flow
DWP-OCT phase data was recorded over a time period of 1-s at the bottom of the lumen in one of the phantom vessels (Fig. 3). The signal amplitude was determined for each 0.5-s data acquisition period by computing the fast Fourier transform (FFT) of the phase () data. For each 1-s of acquired DWP-OCT data, 15 sub-segments were analyzed with a offset between successive 0.5-s data segments. For each 0.5-s data segment, the signal amplitudes at 380 and 400 Hz were calculated, and the level was estimated according to Eq. (2). In the experiment, DWP-OCT data segments longer than 1-s were not recorded due to phase drift. Estimates of were obtained using a moving average approach, which is preferred for short signal durations to reduce high-frequency noise. Phase noise in the signal amplitude increases variance in the computed levels (see error propagation model in Sec. 4.1).The mean of values derived from 15 sub-segments gives a better estimate, and a moving window will smooth the time variation of oxygen saturation. Averaging values over the sub-segments suppresses the phase noise in the signal amplitude.
To demonstrate DWP-OCT for blood measurement, the six blood samples prepared at different levels were measured (99.6%, 89.2%, 84.1%, 69.0%, 57.3%, and 3.0%) with a commercial blood oximeter (AVOXimeter 1000E, International Technidyne Corp., Edison, NJ). Each blood sample was separated into two volumes to ensure DWP-OCT and oximeter measurements could be carried out simultaneously, thus reducing measurement variation due to differences in reoxygenation. The DWP-OCT measurement time of a single blood sample was shorter than 30 min to minimize the effect of drift in the blood levels (blood samples were deoxygenated by sodium dithionite).46 The DWP-OCT measurement results of the blood samples are shown in Fig. 5. Each plot indicates the level deduced from Eq. (2) and derived from the 15 segments lasting 0.5-s each. The solid line (green) and dashed lines (red and blue) represent the mean and standard deviation, respectively, of the 15 segments’ DWP-OCT values. The levels measured by a commercial oximeter are indicated in the right portion of each plot.
Fig. 5.
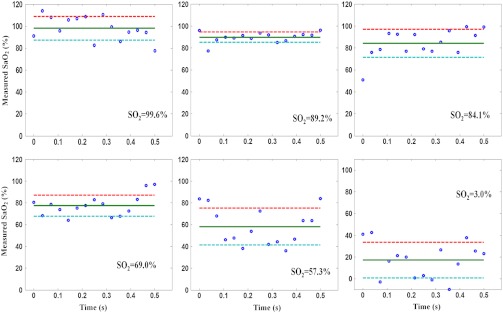
Blood levels measured in phantom vessels by DWP-OCT. The solid line represents the mean of 15 segments of 0.5 s each, and the dashed lines represent standard deviation. The levels measured by a commercial oximeter are indicated in the right portion of each plot. Blood is stationary for all measurements.
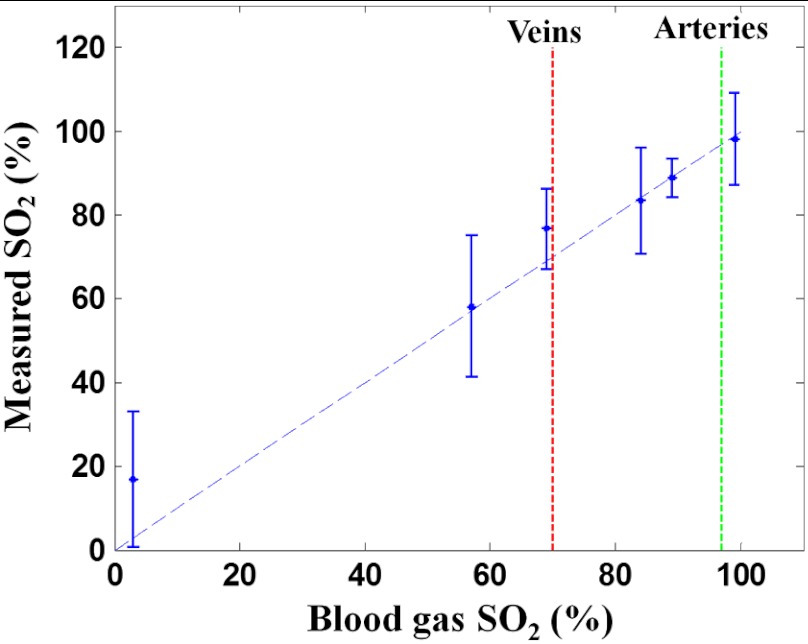
The six blood samples’ levels cover a substantially wider range than physiological variation [from 70% (veins) to 97 to 99% (arteries)]. For each measured level, the oximeter measurement results are within the experimental error of DWP-OCT measurement values (Fig. 6). The AVOXimeter 1000E features a specified accuracy of and a precision of for blood measurements.
Fig. 6.
Blood level measured by DWP-OCT (vertical) versus oximeter values (horizontal). Blood is stationary for all measurements.
3.3. Influence of Blood Flow on DWP-OCT Measurement
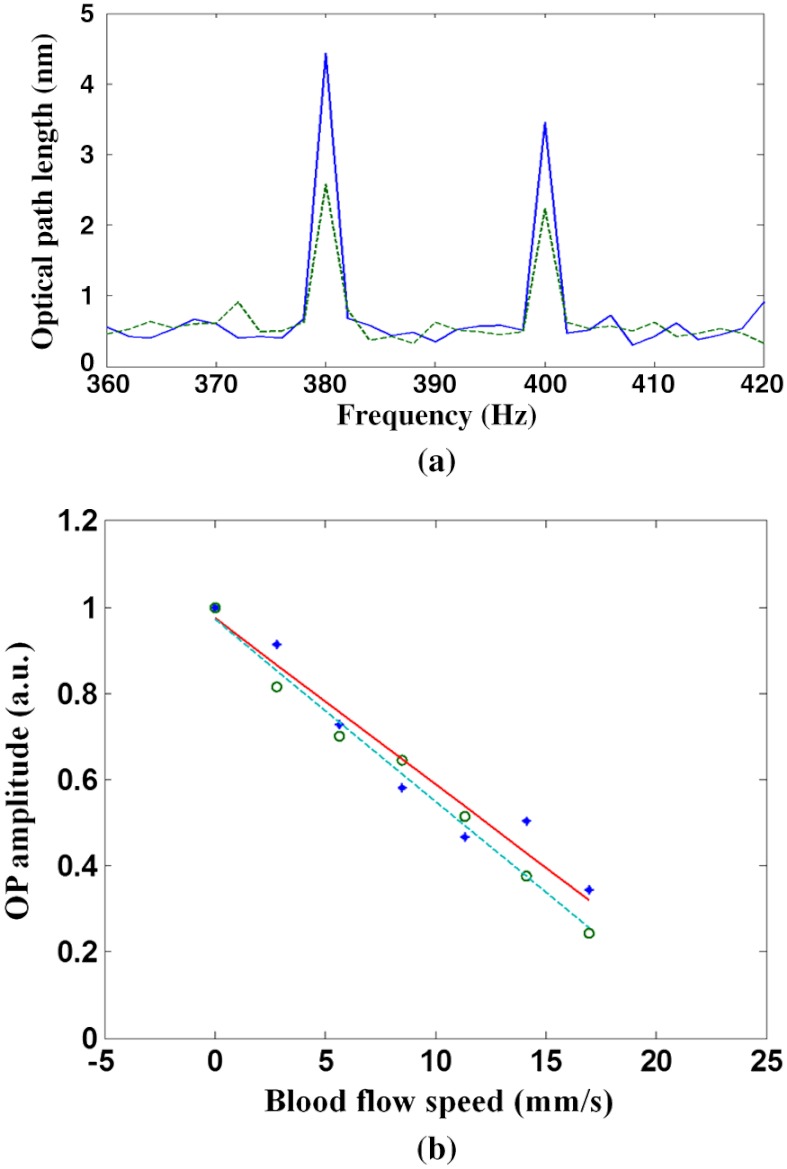
To determine the impact of blood flow on DWP-OCT measurement, we recorded the signal amplitude in a 50-μm inner-diameter phantom blood vessel at different average blood flow speeds introduced by the syringe pump. For each DWP-OCT measurement, the level was fixed at 98.2%. At increasing blood flow speeds, the signal amplitude induced by blood absorption of each photothermal excitation beam was reduced, as shown in Fig. 7(a). A substantial reduction (80%) in the signal amplitude was observed at the greatest average blood flow speed ().
Fig. 7.
(a) Reduction in the signal amplitude at 800 nm (380 Hz) and 770 nm (400 Hz) from stationary (solid line) to increased average blood flow speed (dashed line, ) in a phantom blood vessel with a 50-μm inner diameter. (b) Normalized signal amplitude versus average blood flow speed. Circle: signal amplitude in response to 770-nm excitation, dashed line: linear fit, diamond: signal amplitude in response to 800-nm excitation, solid line: linear fit.
The DWP-OCT measurements were recorded at average blood flow speeds from stationary to , and the signal amplitudes for 770-nm (400-Hz) and 800-nm (380-Hz) light were normalized by respective amplitudes at the stationary condition, as shown in Fig. 7(b).
4. Discussion
In this study, we constructed a DWP-OCT system for the imaging and measurement of static and flowing blood level in a phantom vessel. From Eq. (2), we find that the relative uncertainty in DWP-OCT blood values can be written as
| (3) |
The variation in [; see Eq. (4)] can originate from phase variation in the optical pathlength ( or ) or the fluence ( or ) of photothermal excitation beams.
| (4) |
We define the signal-to-noise ratio [SNR; see Eq. (5)], where op is the optical pathlength signal amplitude in response to photothermal excitation (380 Hz or 400 Hz), and corresponds to the optical pathlength variation due to either the DWP-OCT system or relative motion between the DWP-OCT source beams (PhS-OCT probe beam and photothermal excitation beams) and sample constituents.
| (5) |
4.1. DWP-OCT Static Blood Measurement Error
In phantom vessel static blood measurement, low-power () photothermal excitation light gives amplitudes of 2 to 5 nm, and a 0.3-nm uncertainty in amplitude gives a relative uncertainty to 15% ( SNR 8.2 to 12.2 dB). Laser power fluctuation can introduce a 2% uncertainty in . Based on Eqs. (3) and (4), the effect of the SNR on the relative blood measurement error () was estimated (Fig. 8). Relative uncertainty in decreases with an increasing SNR, as shown in Fig. 8(a). Relative uncertainty in DWP-OCT blood increases with decreased values, as shown in Fig. 8(b). At any blood level, increases with increasing relative uncertainty in . Each of the six measured blood samples’ relative measurement errors in a single (0.5-s) segment was deduced and plotted, as shown in Fig. 8(b), and they have values close to curves corresponding to 20% and 30% relative uncertainty in .
Fig. 8.
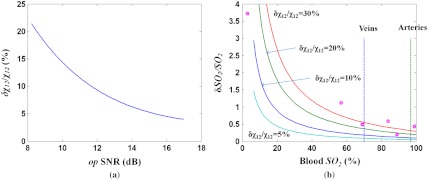
(a) Relative error () versus SNR.(b) Relative blood measurement error () versus for various levels of relative error. Horizontal axis: blood level, vertical axis: relative error of . Solid curves represent conditions when the relative variations of are 5%, 10%, 20%, and 30%. Dashed lines: of veins (70%) and arteries (97%), circles: relative blood measurement error in six blood samples.
To reduce DWP-OCT’s relative blood measurement error to within 5% ( above 60%), relative uncertainty in must be less than 5%, requiring an SNR above 15 dB ( below 3%). A substantial increase in DWP-OCT measurement errors observed in 57.3% and 3% blood levels are consistent with computed values, as shown in Fig. 8(b). To increase DWP-OCT blood measurement accuracy and reliability, system phase stabilization is critical.
4.2. Effect of Blood Flow on SNR of the Optical Pathlength Signal
The accuracy of DWP-OCT measurement at various blood flow speeds can be determined by analysis of the SNR of the signal in response to laser excitation [Eq. (5)]. SNR degradation with respect to increasing blood flow speed, illustrated in Fig. 9(a), suggests that the most reliable DWP-OCT measurements can be obtained at blood flow speeds up to .
Fig. 9.
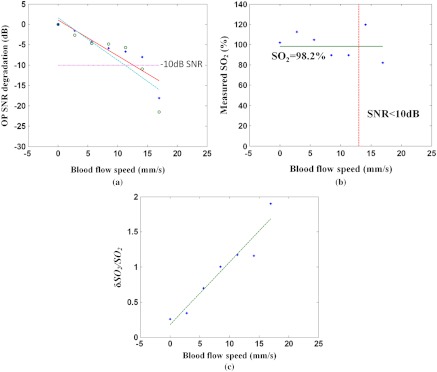
(a) SNR degradation versus blood flow speed. Circle: SNR in response to 770-nm excitation, dashed line: linear fit, diamond: SNR in response to 800-nm excitation, solid line: linear fit, dotted line: 10-dB SNR degradation. (b) measurement in blood vessel phantom at various blood flow speeds. Diamond: measured by DWP-OCT, solid line: measured by oximeter (98.2%), dashed line: threshold speed above which SNR degradation exceeds 10 dB. (c) Relative blood measurement error () for a single segment (0.5 s) versus blood flow speed. Dashed line is linear fit.
The level is calculated for average blood flow speeds up to , as shown in Fig. 9(b). The measured by DWP-OCT is within the experimental error of values measured by a commercial oximeter for average blood flow speeds less than . A average blood flow speed is found in retinal arterioles47 30 to 40 μm in diameter. Relative blood measurement error increases with increasing blood flow speed, as shown in Fig. 9(c). The SNR is a critical factor that determines accuracy of measured levels, as shown in Fig. 9(b). The results suggest that when the SNR degradation exceeds 10 dB, levels measured by DWP-OCT are no longer reliable. Experimental results suggest that a DWP-OCT system utilizing low-power () photothermal excitation has sufficient stability and sensitivity to measure levels in a 50-μm-diameter stationary blood vessel phantom with average blood flow speeds from stationary up to .
Brownian motion and blood flow can also contribute to an increased signal noise floor; in the blood flow experiments reported here, the difference in refractive indices between red blood cells (RBC) and blood plasma is one source of increased signal noise. The time dependent optical pathlength of the probe beam traveling through the phantom vessel lumen can be expressed as
| (6) |
where and are the group refractive indices of red blood cells and plasma, respectively; and and are the physical pathlengths that probe beam travels through RBC and blood plasma, respectively. The values of and vary randomly due to blood flow; a higher blood flow speed will cause signal amplitude to change more rapidly, as indicated in Eq. (6), which results in an increased signal noise floor between successive A-scans. In the case of stationary blood, Brownian RBC motion contributes to the signal noise. For the phantom blood vessel tested here (with a 50 μm innerdiameter), the effect of Brownian RBC motion on signal noise is approximately equivalent to the increase associated with a 6-mm/s blood flow speed relative to the stationary state.48 An increased signal noise floor is observed in a larger vessel (300 μm innerdiameter) due to a longer physical pathlength. The measurement has also been recorded in a 300-μm-diameter phantom blood vessel. At an equivalent average blood flow speed (), the signal noise floor (1.82 nm) in the larger phantom vessel (300 um innerdiameter) increases by 1.3 nm over the signal noise floor (0.52 nm) in the phantom vessel with a 50-μm innerdiameter.
For in vivo measurements, the relative motion between the DWP-OCT source beams and the bulk tissue is an additional noise source that degrades the SNR. Tissue motion artifacts can be suppressed by increasing either the modulation frequency or the DWP-OCT A-scan rate. SS laser sweep rates of up to 5 MHz have been demonstrated.49 A higher modulation frequency will require photothermal excitation lasers with greater instantaneous power (corresponding to a shorter excitation period) to maintain fluence at the same level as the system presented here. In studies reported here, the incident radiant power () is within the ANSI limits for skin. For retinal applications, the photothermal excitation power must be less than 0.75 mW.
Acknowledgments
This study was partially supported by NIH KL2 training grants (Parent Grant Nos. UL1RR025767 and KL2RR025766); by the San Antonio Area Foundation (Grant No. 130977); and by research support from Carl Zeiss Meditec to RVK and TEM, from the Department of Veterans Affairs (VA MERIT Award) to TQD, and by the NIH (R01 EY018855 and R01 EY014211) to TQD. The authors also gratefully acknowledge support from the National Institutes of Health (NIH R01EY016462).
References
- 1.Carmeliet P., Jain R. K., “Angiogenesis in cancer and other diseases,” Nature 407(6801), 249–257 (2000). 10.1038/35025220 [DOI] [PubMed] [Google Scholar]
- 2.Carmeliet P., “Angiogenesis in life, disease and medicine,” Nature 438(7070), 932–936 (2005). 10.1038/nature04478 [DOI] [PubMed] [Google Scholar]
- 3.Linsenmeier R. A., Yancey C. M., “Effects of hyperoxia on the oxygen distribution in the intact cat retina,” Investig. Ophthalmol. Vis. Sci. 30(4), 612–618 (1989). [PubMed] [Google Scholar]
- 4.Padnick-Silver L., et al. , “Retinal oxygenation and oxygen metabolism in Abyssinian cats with a hereditary retinal degeneration,” Investig. Ophthalmol. Vis. Sci. 47(8), 3683–3689 (2006). 10.1167/iovs.05-1284 [DOI] [PubMed] [Google Scholar]
- 5.Yu D. Y., Cringle S. J., Su E. N., “Intraretinal oxygen distribution in the monkey retina and the response to systemic hyperoxia,” Investig. Ophthalmol. Vis. Sci. 46(12), 4728–4733 (2005). 10.1167/iovs.05-0694 [DOI] [PubMed] [Google Scholar]
- 6.Glud R. N., et al. , “Planar optrodes: a new tool for fine scale measurements of two-dimensional O2 distribution in benthic communities,” Mar. Ecol. Prog. Ser. 140, 217–226 (1996). 10.3354/meps140217 [DOI] [Google Scholar]
- 7.Yu C. Y., et al. , “Oxygen distribution and consumption in rat lower incisor pulp,” Arch. Oral Biol. 47(7), 529–536 (2002). 10.1016/S0003-9969(02)00036-5 [DOI] [PubMed] [Google Scholar]
- 8.Cheng H. Y., et al. , “Structural and functional MRI reveals multiple retinal layers,” Proc. Natl. Acad. Sci. U.S.A. 103(46), 17525–17530 (2006). 10.1073/pnas.0605790103 [DOI] [PMC free article] [PubMed] [Google Scholar]
- 9.Berkowitz B. A., et al. , “Subnormal retinal oxygenation response precedes diabetic-like retinopathy,” Investig. Ophthalmol. Vis. Sci. 40(9), 2100–2105 (1999). [PubMed] [Google Scholar]
- 10.Duong T. Q., et al. , “Layer-specific anatomical, physiological and functional MRI of the retina,” NMR Biomed. 21(9), 978–996 (2008). 10.1002/nbm.v21:9 [DOI] [PMC free article] [PubMed] [Google Scholar]
- 11.Karni A., et al. , “Functional MRI evidence for adult motor cortex plasticity during motor skill learning,” Nature 377(6545), 155–158 (1995). 10.1038/377155a0 [DOI] [PubMed] [Google Scholar]
- 12.Koopmans P. J., Barth M., Norris D. G., “Layer-specific BOLD activation in human V1,” Hum. Brain Mapp. 31(9), 1297–1304 (2010). 10.1002/hbm.v31:9 [DOI] [PMC free article] [PubMed] [Google Scholar]
- 13.Denninghoff K. R., et al. , “Retinal venous oxygen saturation and cardiac output during controlled hemorrhage and resuscitation,” J. Appl. Physiol. 94(3), 891–896 (2003). [DOI] [PubMed] [Google Scholar]
- 14.Hammer M., Schweitzer D., “Quantitative reflection spectroscopy at the human ocular fundus,” Phys. Med. Biol. 47(2), 179–191 (2002). 10.1088/0031-9155/47/2/301 [DOI] [PubMed] [Google Scholar]
- 15.Madsen P. L., Secher N. H., “Near-infrared oximetry of the brain,” Prog. Neurobiol. 58(6), 541–560 (1999). 10.1016/S0301-0082(98)00093-8 [DOI] [PubMed] [Google Scholar]
- 16.Sowa M. G., et al. , “Noninvasive assessment of regional and temporal variations in tissue oxygenation by near-infrared spectroscopy and imaging,” Appl. Spectrosc. 51(2), 143–151 (1997). 10.1366/0003702971939901 [DOI] [Google Scholar]
- 17.Dunn A. K., et al. , “Simultaneous imaging of total cerebral hemoglobin concentration, oxygenation and blood flow during functional activation,” Opt. Lett. 28(1), 28–30 (2003). 10.1364/OL.28.000028 [DOI] [PubMed] [Google Scholar]
- 18.Izhaky D., et al. , “Functional imaging using the retinal function imager: direct imaging of blood velocity, achieving fluorescein angiography-like images without any contrast agent, qualitative oximetry, and functional metabolic signals,” Jpn. J. Ophthalmol. 53(4), 345–351 (2009). 10.1007/s10384-009-0689-0 [DOI] [PubMed] [Google Scholar]
- 19.Shonat R. D., Kight A. C., “Oxygen tension imaging in the mouse retina,” Ann. Biomed. Eng. 31(9), 1084–1096 (2003). 10.1114/1.1603256 [DOI] [PubMed] [Google Scholar]
- 20.Zuckerman R., Cheasty J. E., Wang Y. P., “Optical mapping of inner retinal tissue ,” Curr. Eye Res. 12(9), 809–825 (1993). 10.3109/02713689309020386 [DOI] [PubMed] [Google Scholar]
- 21.Golub A. S., Tevald M. A., Pittman R. N., “Phosphorescence quenching microrespirometry of skeletal muscle in situ,” Am. J. Physiol. Heart Circ. Physiol. 300(1), H135–H143 (2011). 10.1152/ajpheart.00626.2010 [DOI] [PMC free article] [PubMed] [Google Scholar]
- 22.Tsai A. G., et al. , “Microvascular and tissue oxygen gradients in the rat mesentery,” Proc. Natl. Acad. Sci. U.S.A. 95(12), 6590–6595 (1998). 10.1073/pnas.95.12.6590 [DOI] [PMC free article] [PubMed] [Google Scholar]
- 23.Lo L. W., Koch C. J., Wilson D. F., “Calibration of oxygen-dependent quenching of the phosphorescence of Pd-meso-tetra (4-carboxyphenyl) porphine: a phosphor with general application for measuring oxygen concentration in biological systems,” Anal. Biochem. 236(1), 153–160 (1996). 10.1006/abio.1996.0144 [DOI] [PubMed] [Google Scholar]
- 24.Helmlinger G., et al. , “Interstitial pH and gradients in solid tumors in vivo: high-resolution measurements reveal a lack of correlation,” Nat. Med. 3(2), 177–182 (1997). 10.1038/nm0297-177 [DOI] [PubMed] [Google Scholar]
- 25.Huang D., et al. , “Optical coherence tomography,” Science 254(5035), 1178–1181 (1991). 10.1126/science.1957169 [DOI] [PMC free article] [PubMed] [Google Scholar]
- 26.Fercher A. F., et al. , “Measurement of intraocular distances by backscattering spectral interferometry,” Opt. Commun. 117(1–2), 43–48 (1995). 10.1016/0030-4018(95)00119-S [DOI] [Google Scholar]
- 27.Häusler G., Lindner M. W., “‘Coherence radar’ and ‘spectral radar’-new tools for dermatological diagnosis,” J. Biomed. Opt. 3(1), 21–31 (1998). 10.1117/1.429899 [DOI] [PubMed] [Google Scholar]
- 28.Huber R., et al. , “Amplified, frequency swept lasers for frequency domain reflectometry and OCT imaging: design and scaling principles,” Opt. Express 13(9), 3513–3528 (2005). 10.1364/OPEX.13.003513 [DOI] [PubMed] [Google Scholar]
- 29.Robles F., Graf R. N., Wax A., “Dual window method for processing spectroscopic optical coherence tomography signals with simultaneously high spectral and temporal resolution,” Opt. Express 17(8), 6799–6812 (2009). 10.1364/OE.17.006799 [DOI] [PMC free article] [PubMed] [Google Scholar]
- 30.Leitgeb R., et al. , “Spectral measurement of absorption by spectroscopic frequency-domain optical coherence tomography,” Opt. Lett. 25(11), 820–822 (2000). 10.1364/OL.25.000820 [DOI] [PubMed] [Google Scholar]
- 31.Faber D. J., van Leeuwen T. G., “Are quantitative attenuation measurements of blood by optical coherence tomography feasible?,” Opt. Lett. 34(9), 1435–1437 (2009). 10.1364/OL.34.001435 [DOI] [PubMed] [Google Scholar]
- 32.Yi J., Li X., “Estimation of oxygen saturation from erythrocytes by high-resolution spectroscopic optical coherence tomography,” Opt. Lett. 35(12), 2094–2096 (2010). 10.1364/OL.35.002094 [DOI] [PubMed] [Google Scholar]
- 33.Robles F. E., et al. , “Molecular imaging true-colour spectroscopic optical coherence tomography,” Nat. Photon. 5(12), 744–747 (2011). 10.1038/nphoton.2011.257 [DOI] [PMC free article] [PubMed] [Google Scholar]
- 34.Adler D.C., et al. , “Photothermal detection of gold nanoparticles using phase-sensitive optical coherence tomography,” Opt. Express 16(7), 4376–4393 (2008). 10.1364/OE.16.004376 [DOI] [PubMed] [Google Scholar]
- 35.Skala M. C., et al. , “Photothermal optical coherence tomography of epidermal growth factor receptor in live cells using immunotargeted gold nanospheres,” Nano Lett. 8(10), 3461–3467 (2008). 10.1021/nl802351p [DOI] [PMC free article] [PubMed] [Google Scholar]
- 36.Paranjape A. S., et al. , “Depth resolved photothermal OCT detection of macrophages in tissue using nanorose,” Biomed. Opt. Express 1(1), 2–16 (2010). 10.1364/BOE.1.000002 [DOI] [PMC free article] [PubMed] [Google Scholar]
- 37.Kuranov R. V., et al. , “Depth-resolved blood oxygen saturation measurement by dual-wavelength photothermal (DWP) optical coherence tomography,” Biomed. Opt. Express 2(3), 491–504 (2011). 10.1364/BOE.2.000491 [DOI] [PMC free article] [PubMed] [Google Scholar]
- 38.Kuranov R. V., et al. , “In vivo depth-resolved oxygen saturation by dual-wavelength photothermal (DWP) OCT,” Opt. Express 19(24), 23831–23844 (2011). 10.1364/OE.19.023831 [DOI] [PMC free article] [PubMed] [Google Scholar]
- 39.Kuranov R. V., et al. , “Gas-cell referenced swept source phase sensitive optical coherence tomography,” IEEE Photon. Technol. Lett. 22(20), 1524–1526 (2010). 10.1109/LPT.2010.2055842 [DOI] [Google Scholar]
- 40.Santhanam K., “Clock system design for quadrupling the frequency of reference clock for a swept source spectral domain optical coherence tomography,” Master Thesis, The University of Texas at Austin (2009). [Google Scholar]
- 41.Rollins A. M., Izatt J. A., “Optimal interferometer designs for optical coherence tomography,” Opt. Lett. 24(21), 1484–1486 (1999). 10.1364/OL.24.001484 [DOI] [PubMed] [Google Scholar]
- 42.Vakoc B. J., et al. , “Phase-resolved optical frequency domain imaging,” Opt. Express 13(14), 5483–5493 (2005). 10.1364/OPEX.13.005483 [DOI] [PMC free article] [PubMed] [Google Scholar]
- 43.Wojtkowski M., et al. , “Ultrahigh-resolution, high-speed, Fourier domain optical coherence tomography and methods for dispersion compensation,” Opt. Express 12(11), 2404–2422 (2004). 10.1364/OPEX.12.002404 [DOI] [PubMed] [Google Scholar]
- 44.Wu T., et al. , “Spectral phase based k-domain interpolation for uniform sampling in swept-source optical coherence tomography,” Opt. Express 19(19), 18430–18439 (2011). 10.1364/OE.19.018430 [DOI] [PubMed] [Google Scholar]
- 45.Welch A. J., van Gemert M. J. C., Optical-Thermal Response of Laser-Irradiated Tissue, Laser, Photonics, and Electro-Optics, Plenum Press, New York, NY: (1995). [Google Scholar]
- 46.Briely-Sabo K., Bjornerud A., “Accurate de-oxygenation of ex vivo whole blood using sodium Dithionite,” Proc. Intl. Sot. Mag. Reson. Med. 8, 2025 (2000). [Google Scholar]
- 47.Ma Y. P., et al. , “On-line measurement of the dynamic velocity of erythrocytes in the cerebral microvessels in the rat,” Microvas. Res. 8(1), 1–13 (1974). 10.1016/0026-2862(74)90059-4 [DOI] [PubMed] [Google Scholar]
- 48.Binzoni T., et al. , “Non-invasive laser Doppler perfusion measurements of large tissue volumes and human skeletal muscle blood RMS velocity,” Phys. Med. Biol. 48(15), 2527–2549 (2003). 10.1088/0031-9155/48/15/318 [DOI] [PubMed] [Google Scholar]
- 49.Wieser W., et al. , “Multi-Megahertz OCT: high quality 3D imaging at 20 million A-scans and 4.5 GVoxels per second,” Opt. Express 18(14), 14685–14704 (2010). 10.1364/OE.18.014685 [DOI] [PubMed] [Google Scholar]


