

Background: T-type Ca2+ (Cav3.2) channel inhibitors prevent neuronal death during ischemia, but the cytotoxic signals have not been resolved.
Results: Cav3.2 channels generate cytotoxic Ca2+ elevations in the cytosol and mitochondria of PC12 cells deprived of oxygen and glucose.
Conclusion: Ca2+ transfer from Cav3.2 channels to mitochondria contributes to ischemic toxicity.
Significance: Cav3.2 channels and the mitochondrial Ca2+ uniporter (MCU) are potential targets for the treatment of stroke.
Keywords: Calcium Signaling, Ion Channels, Ischemia, Mitochondria, Stroke
Abstract
T-type Ca2+ channel inhibitors protect hippocampal CA1 neurons from delayed death after global ischemia in rats, suggesting that Cav3.1, Cav3.2, or Cav3.3 channels generate cytotoxic Ca2+ elevations during anoxia. To test this hypothesis, we measured the Ca2+ concentration changes evoked by oxygen and glucose deprivation (OGD) in the cytosol and in the mitochondria of PC12 cells. OGD evoked long-lasting cytosolic Ca2+ elevations that were reduced by Cav3.2 inhibition (50 μm Ni2+) and Cav3.1/Cav3.2 silencing and potentiated by Cav3.2 overexpression. The kinetics of the sustained cytosolic Ca2+ elevations occurring during OGD directly correlated to the extent of cell death measured 20 h after reoxygenation, which was decreased by Ni2+ and Cav3.1/Cav3.2 silencing and increased by Cav3.2 overexpression. Ni2+ and Cav3.1/Cav3.2 silencing delayed the decline of cellular ATP during OGD, consistent with a reduction in the Ca2+ load actively extruded by plasma membrane Ca2+ pumps. The cytosolic Ca2+ elevations were paralleled by mitochondrial Ca2+ elevations that were also increased by Cav3.2 overexpression and decreased by Ni2+ but not by Cav3.1/Cav3.2 silencing. Overexpression and silencing of the mitochondrial Ca2+ uniporter, the major mitochondrial Ca2+ uptake protein, revealed that the cytotoxicity was correlated to the amplitude of the mitochondrial, rather than the cytosolic, Ca2+ elevations. Selective activation of T-type Ca2+ channels evoked both cytosolic and mitochondrial Ca2+ elevations, but only the mitochondrial responses were reduced by Cav3.1/Cav3.2 silencing. We conclude that the opening of Cav3.2 channels during ischemia contribute to the entry of Ca2+ ions that are transmitted to mitochondria, resulting in a deleterious mitochondrial Ca2+ overload.
Introduction
The brain is one of the most energy-consuming organs, and disturbances in cerebral blood flow that deprive brain regions of oxygen and glucose rapidly cause metabolic defects by preventing the synthesis of the cytosolic ATP required for normal neuronal function. Within minutes of ischemia, neurons lose the ability to maintain ionic gradients, depolarize, and their cytosolic Ca2+ concentration ([Ca2+]cyt)2 increases sufficiently to trigger the exocytosis of excitatory neurotransmitters, leading to a secondary massive entry of Ca2+ that extends to nearby neurons in a deadly cascade termed excitotoxicity. Increased Ca2+ release from the endoplasmic reticulum (ER), increased Ca2+ influx across plasma membrane (PM) channels, and decreased Ca2+ extrusion have all been implicated in the pathogenesis of the [Ca2+]cyt overload during ischemia (1). Cleavage of the Na+/Ca2+ exchanger by calpain was shown to prevent Ca2+ extrusion, potentiate Ca2+ overload (2), and reverse mode operation of the Na+/Ca2+ exchanger to contribute directly to Ca2+ entry, driven by increased cytosolic sodium build-up during ischemia (3) (reviewed in Ref. 4). Ionotropic glutamate receptors are recognized as the major Ca2+ entry pathway that mediates excitotoxicity (5) (reviewed in Ref. 1). In addition, during both the ischemic and reperfusion phases, Ca2+ entry is mediated by voltage-gated Ca2+ channels as well as acid-sensing ion channels (6) and Ca2+-permeable transient receptor potential channels (7, 8), which are activated by the acidosis and the high concentrations of reactive oxygen species that develop around ischemic neurons (9). Dihydropyridine-sensitive L-type voltage-dependent Ca2+ channels (Cav1.2) were long considered to be the main non-excitotoxic Ca2+ entry pathway, as Cav1.2 opening upon neuronal depolarization can cause massive Ca2+ entry during ischemia. However, clinical studies showed little benefit of dihydropyridine analogues in acute ischemic stroke patients (10). Inhibition of the lower capacity T-type voltage-gated Ca2+ channels (Cav3.1 and Cav3.2), on the other hand, was shown to protect rat organotypic hippocampal slice cultures from ischemia-induced delayed cell death (11) and to protect CA1 neurons from delayed death after global ischemia in rats (12). T-type Ca2+ channels can remain open for long durations at voltages close to the resting potential, generating a “window current” that allows a small but sustained entry of Ca2+ ions that can drive long-lasting processes such as myoblast differentiation (13). Such a small and sustained entry of Ca2+ could initiate a Ca2+-dependent apoptotic or necrotic cascade during ischemia (14), but no direct evidence that T-type channels contribute to pathological Ca2+ signals has been provided to date.
Mitochondria are intracellular signaling hubs that link Ca2+ homeostasis to cell metabolism and fate by their ability to sequester Ca2+ ions (15). The negative potential of the mitochondrial matrix drives the influx of Ca2+ ions across a low-affinity mitochondrial Ca2+ uniporter (MCU) that was identified recently (16, 17). MCU-mediated Ca2+ uptake allows mitochondria to act as mobile Ca2+ buffers that mitigate [Ca2+]cyt elevations and prevent the Ca2+-dependent activation or inactivation of PM channels (reviewed in Ref. 18) and to translate [Ca2+]cyt changes into metabolic responses (19). Moderate elevations in the mitochondrial matrix free Ca2+ concentration ([Ca2+]mit) activate enzymes of the tricarboxylic acid cycle to boost ATP production (20), whereas excessive [Ca2+]mit elevations can activate the mitochondrial permeability transition pore, increasing the permeability of the inner mitochondrial membrane and triggering the release of pro-apoptotic factors that initiate the cell death cascade (reviewed in Ref. 21). Accordingly, MCU-overexpressing cells were more sensitive to apoptosis triggered by ceramide and hydrogen peroxide (17). The paradox that mitochondrial Ca2+ uptake requires high micromolar Ca2+ concentrations never achieved in the bulk cytoplasm of living cells (22) has been resolved by the discovery that mitochondria can be exposed to transient microdomains of high [Ca2+]cyt during physiological and pathological Ca2+ elevations (23, 24). Mitochondria can take up Ca2+ ions flowing across Ca2+ release channels on the ER (25) and voltage-gated Ca2+ entry channels on the PM (26) but not across store-operated Ca2+ entry channels (27), which are activated by electrostatic interactions with proteins on apposed cortical ER structures (28), which precludes mitochondria access. Whether mitochondria can take up Ca2+ ions flowing across Ca2+ entry channels during ischemia is not known.
To fill this gap of knowledge, we used genetically encoded fluorescent biosensors to measure the [Ca2+]cyt and [Ca2+]mit changes occurring during ischemia in PC12 cells and assessed the contribution of T-type Ca2+ channels and of the MCU by gene silencing and overexpression. PC12 cells express oxygen-sensitive potassium channels that were shown to regulate membrane depolarization during hypoxia (29) and express both high- and low-threshold voltage-gated Ca2+ channels (30), the predominant T-type Ca2+ channel isoform Cav3.2 being up-regulated by hypoxia-inducible transcription factors and recruited to the PM after exposure to chronic hypoxia (31). Our data indicate that both Cav3.2 and the MCU contribute to ischemic toxicity by allowing the sustained transfer of Ca2+ to subplasmalemmal mitochondria during anoxia.
EXPERIMENTAL PROCEDURES
Reagents
RPMI 1640, Lipofectamine 2000, penicillin, and streptomycin were obtained from Invitrogen. Fetal calf serum and horse serum were obtained from Brunschwig. Sodium dithionite and staurosporine were obtained from Sigma-Aldrich. The D3cpv and 4mtD3cpv constructs were provided by Drs. Laurent Combettes (Université of Paris-Sud) and Roger Tsien (University of California, San Diego, CA). Cytosolic FRET-based ATP indicators (ATeam, adenosine 5′-triphosphate indicator on the basis of the ∈ subunit for analytical measurements) were provided by Drs. Hiromi Imamura (Japan Science and Technology Agency, Tokyo) and Hiroyuki Noji (Osaka University).
Cell Culture, Transfection, and RNA Interference
PC12 cells were grown in RPMI 1640 l-glutamine medium containing 5% fetal calf serum, 10% horse serum, and 100 units/ml of penicillin and streptomycin. Cells were cultured in 95% air and 5% CO2 at 37 °C and subcultured every 7 days at a 1:10 dilution. Cells were plated on poly-L-lysine-coated coverslips or plates and grown for 24 h before transfection with siRNA and/or fluorescent proteins using Lipofectamine 2000. Experiments were performed 48 h after transfection. Cav3.1 and Cav3.2 silencing was achieved with a pool of three target-specific siRNAs (Santa Cruz Biotechnology, Inc., catalog nos. sc-61869 and sc-61870), and knockdown efficiency was verified by quantitative PCR.
Mitochondrial Isolation, Cell Lysis, and Western Blotting
Mitochondria were isolated by differential centrifugation in isolation buffer (300 mm sucrose, 10 mm HEPES, 0.5 mm EGTA (pH 7.6)) and lysed for 20 min on ice in lysis buffer (25 mm Tris-HCl (pH 7.6), 150 mm NaCl, 1% Nonidet P-40, 1% sodium deoxycholate, 0.1% SDS) supplemented with protease inhibitors (Roche) as described in Ref. 32. The lysate was centrifuged at 14,000 × g for 20 min, and the protein content of the supernatant was determined using the Bradford protein assay (Bio-Rad). 30 μg of total protein/lane was loaded on an SDS-PAGE gel. For immunoblotting, proteins were transferred onto a nitrocellulose membrane and probed with 1/500 anti-CCDC109A/MCU and anti-Tom20 (Santa Cruz Biotechnology, Inc., catalog nos. sc-246071 and sc-11415, respectively). Horseradish peroxidase-conjugated secondary antibodies 1/20,000 (Amersham Biosciences) were used, followed by detection by chemiluminescence.
Oxygen-Glucose Deprivation (OGD) Experiments
Cells were washed twice in a HEPES-buffered solution containing 140 mm NaCl, 5 mm KCl, 1 mm MgCl2, 2 mm CaCl2, 20 mm HEPES (pH 7.4) with NaOH at 37 °C, placed into an anoxic chamber (Miniature Incubator, Bioscience Tools), and flushed continuously with a mixture of 95% N2/5% CO2 at 37 °C (TC2-80-150, Bioscience Tools). A similar solution containing 2 mm of sodium dithionite and equilibrated with the N2/CO2 mixture for 5 min was injected into the chamber to initiate the OGD. Oxygen levels were monitored with a titanium-coated probe and a Neo Fox 1 channel oxy monitor system (Instech Laboratories, Inc.). After the OGD period, cells were washed twice with RPMI 1640 medium and cultured for 24 h in a normoxic environment. Control (non-ischemic) cells were exposed to a HEPES-buffered solution containing 10 mm glucose in an incubator with 95% air and 5% CO2 at 37 °C.
[Ca2+]cyt, [Ca2+]mit, and [ATP]cyt Imaging
Cells were imaged on an Axiovert s100 TV microscope using a ×40, 1.3 numerical aperture oil immersion objective (Carl Zeiss AG, Feldbach, Switzerland) and a cooled, 16-bit charge-coupled device back-illuminated frame transfer MicroMax camera (Roper Scientific, Trenton, NJ). [Ca2+]cyt and [Ca2+]mit were measured with D3cpv and 4mtD3cpv, respectively, and cytosolic [ATP] was measured with ATeamcyto, all FRET-based indicators. Cells were excited at 430 nm through a 455DRLP dichroic filter and alternately imaged with 480AF30 and 535DF25 emission filters (Omega Optical). Image pairs were acquired every 10 s. Fluorescence ratios were calculated in MetaFluor 6.3 (Universal Imaging) and analyzed in Excel (Microsoft) and GraphPad Prism 4 (GraphPad). Ca2+ slopes were determined by a linear fit to the steepest part of the Ca2+ increase, recorded between 20 and 60 min after OGD initiation.
Cytotoxicity Measurements
Lactate dehydrogenase (LDH) release was measured 20 h after OGD with a cytotoxicity kit assay (Abcam) on the basis of the cleavage of a tetrazolium salt by LDH. 100 μl of culture medium was collected, centrifuged to remove cellular debris, and transferred to a 96-well plate. 100 μl of the reaction mixture was added to each well and incubated for 30 min at room temperature. Absorbance was measured at 490 nm, and LDH release was expressed as a percentage of total LDH activity, measured by lysing cells with Triton.
RNA Extraction and Real-time PCR
Two days after cotransfection, cells were harvested by trypsination, washed twice with phosphate-buffered saline, and subjected to cytofluorometric analysis. GFP-positive cells were sorted using FACStar+ (BD Biosciences). Total RNA was isolated from sorted cells using the NucleoSpin RNA II kit (Macherey-Nagel, Düren, Germany), and 0.5 μg of DNase-treated RNA was used to synthesize cDNA using a QuantiTec reverse transcription kit (Qiagen, Hombrechtikon, Switzerland). For each PCR reaction, 1/20th of the cDNA template was amplified in a 7900HT SDS system using Power SYBR Green PCR master mix (Applied Biosystems, Foster City, CA). Raw threshold-cycle (Ct) values obtained from triplicate PCR reactions were averaged and normalized to four endogenous control genes (egf1, GAPDH, rps29, and tubb). Primers used were as follows: rat Cav3.2, GGCGTGGTGGTGGAGA-ACTT/GATGATGGTGGGATTGAT; rat Cav3.1, ACCTGCCTGACACTCTGCAG/GCTGGCCTCAGCGCAGTCGG; and rat MCU, AGACTTTTTGG-CTCCTTTATGGAAA/GAATATGTTTATCCTGAAGCCAGAGA.
Immunofluorescence
Cells were fixed with 4% PAF for 20 min at 4 °C, permeabilized with 0.2% Triton+ 1% BSA for 20 min at 20 °C, incubated overnight at 4 °C with the primary antibody at 1/100 (sc-16263, Santa Cruz), washed and incubated for 30 min at 20 °C with the secondary antibody at 1/1000 (Alexa Anti-Goat 405 nm, Invitrogen), and mounted on glass slides with Dako mounting medium. Images were taken on a Confocal Laser Scanning Microscope (Zeiss CLSM 700) using a Plan-Apochromat 63x/1.4 Oil objective.
Electrophysiology
Currents were recorded in the whole-cell configuration of the patch-clamp technique with an Axopatch 200B amplifier and Clampex 10.3 software (Molecular Devices). Cells were plated 3 days before the recordings, performed at 20 °C. Borosilicate glass pipettes (World Precision Instruments) were pulled with a Sutter puller, fire polished, and had a resistance between 2 and 3 mΩ. The external solution contained 130 mm NMDG, 10 mm BaCl2, 1 mm MgCl2, 10 mm HEPES, 10 mm glucose, pH adjusted to 7.4 with HCl (278 mOsM/kg). The pipette solution contained 140 mm CsAsp, 10 mm HEPES, 1 mm MgCl2, 10 mm EGTA, pH adjusted to 7.4 with CsOH (277 mOsM/kg). 350 ms pulses to +0mV were applied from a holding potential of −80mV to evoke T-type Ca2+ currents. Data were filtered at 5 kHz, digitized at 50 kHz, and currents normalized to the cell capacitance (10–20 pF).
Statistical analysis
The significance of differences between means was established using the Student's t test for unpaired samples (*, p < 0.05; **, p < 0.01; ***, p < 0.001).
RESULTS
To study the impact of oxygen and glucose deprivation (OGD) on cytosolic Ca2+ levels we took advantage of genetically encoded indicators that, unlike synthetic dyes, allow long-term recordings when expressed in cells or tissues. PC12 cells were transiently transfected with the cytosolic FRET-based “Cameleon” Ca2+ indicator D3cpv, and [Ca2+]cyt was measured by fluorescence microscopy during a 3-h long OGD generated by replacing the saline solution with a glucose-free medium bubbled with 95% nitrogen and 5% CO2. OGD triggered an immediate [Ca2+]cyt increase followed within 20 min by a monotonic elevation that reached a steady-state plateau after 2 h (Fig. 1A). Subsequent oxygen/glucose readmission evoked a further, but transient, [Ca2+]cyt increase. This procedure was associated with ∼80% cytotoxicity, as determined by measuring LDH release 20 h after the insult (Fig. 1B). A 3-h OGD was as efficient as thapsigargin in evoking LDH release and slightly less efficient than staurosporine, two commonly used cytotoxic agents (Fig. 1B). Depriving cells of oxygen and glucose for 90 min caused ∼25% cytotoxicity, whereas 30 min of OGD did not promote LDH release (not shown). Consistent with a causal role for Ca2+ entry in this cell death, cytotoxicity decreased by 30% when OGD was performed in the absence of extracellular Ca2+ (Fig. 2A). Strikingly, a similar protection was observed when OGD was performed in the presence of 50 μm Ni2+ (Fig. 2A), a concentration that selectively inhibits Cav3.2 channels (half maximal inhibition, 13 μm for Cav3.2 versus 250 μm and 213 μm for Cav3.1 and Cav3.3, respectively (33)). To confirm the implication of T-type Ca2+ channels in OGD-induced cell death, we knocked down the two T-type channel isoforms expressed in PC12 cells, Cav3.1 and Cav3.2 (31), using a combination of siRNAs that decreased their mRNA levels by 60–70% (Fig. 2B). Knockdown of T-type channels reduced cytotoxicity by 40% to the level observed in the absence of external Ca2+ or in the presence of Ni2+ (Fig. 2A). Concordantly, overexpression of the major endogenous T-type channel isoform of PC12 cells Cav3.2 (31) increased cytotoxicity by ∼30% (Fig. 2A). Transfection of cells with scrambled siRNA or with an empty vector did not alter OGD-evoked cytotoxicity (not shown). Functional overexpression was verified by immunofluorescence (Fig. 2C) and by recordings of transient inward currents activated by depolarizing voltage steps above −50 mV that were of large amplitude and inhibited by Ni2+ (D). These data indicate that, in PC12 cells, T-type calcium channels contribute to the cytotoxicity resulting from OGD.
FIGURE 1.
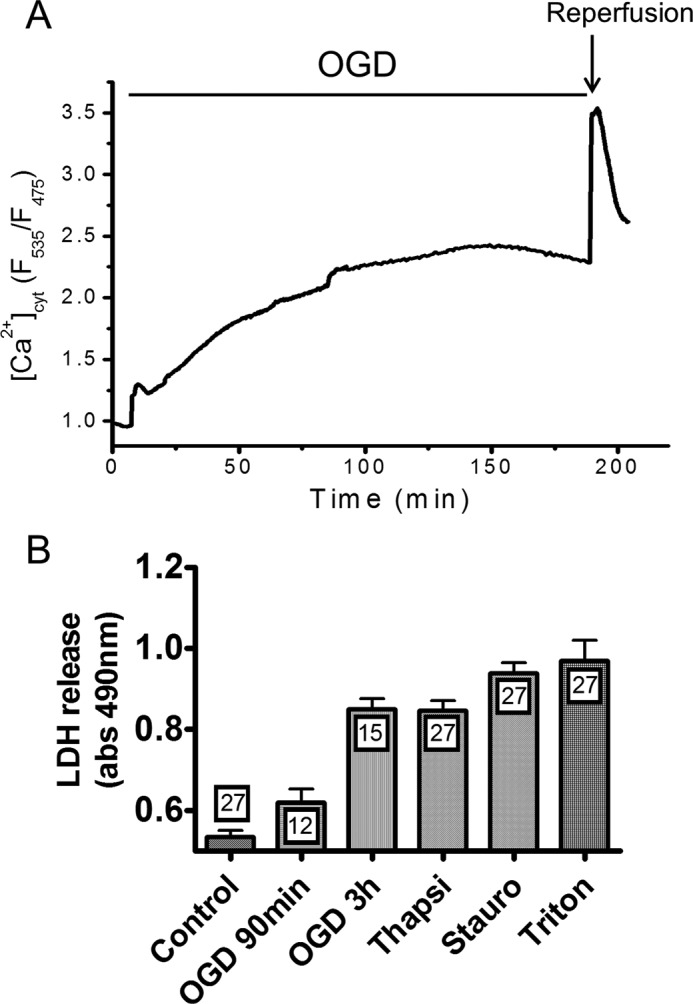
[Ca2+]cyt elevations and cytotoxicity evoked by OGD. [Ca2+]cyt was measured with the Cameleon indicator D3cpv, and cytotoxicity was measured by quantifying LDH release 20 h after anoxia. A, typical recording illustrating long-lasting [Ca2+]cyt elevations evoked by OGD. OGD triggered a rapid [Ca2+]cyt increase followed by a sustained elevation that reached a steady state after 2 h, and a further [Ca2+]cyt increase was observed upon oxygen/glucose readmission. B, LDH release evoked by 90 min and 3 h of OGD and release evoked by thapsigargin (Thapsi) and staurosporine (Stauro), used as positive controls. Data are mean ± S.E. n is indicated inside the bars.
FIGURE 2.

Effect of T-type Ca2+ channels modulation on the cytotoxicity evoked by OGD. A, effect of T-type channels modulation on the cytotoxicity evoked by OGD. Data are mean ± S.E., expressed as fold changes from the control condition. n is indicated inside the bars. B, Cav3.1 and Cav3.2 mRNA levels in cells treated with the indicated siRNAs, relative to house-keeping genes. C, Cav3.2 immunostaining in naïve PC12 cells (left panel) and in a cell overexpressing Cav3.2. D, current-voltage relationship of the peak inward current recorded before (○) and after (■) the addition of 50 μm Ni2+ in cells overexpressing Cav3.2. The inset shows the inward currents evoked by a 350-ms depolarization step to +0 mV in the absence and presence of 50 μm Ni2+. Data are mean ± S.E. from three to seven recordings. **, p < 0.01; ***, p < 0.001 (Student's t test for unpaired samples).
To confirm this link, we studied the impact of pharmacological and genetic manipulations of T-type Ca2+ channels on the cytosolic [Ca2+]cyt elevations evoked by OGD. Shorter (30- and 90-min) OGD was applied to streamline the acquisition process because the prototypical biphasic [Ca2+]cyt elevations could be well resolved during these time frames (Fig. 3, A and B). Notably, following 90 min of OGD, [Ca2+]cyt did not increase further upon oxygen/glucose readmission but rapidly returned to basal levels (Fig. 3A). Predictably, [Ca2+]cyt elevations were nearly abolished during OGD performed in the absence of external Ca2+, a procedure that also decreased the resting [Ca2+]cyt concentration (Fig. 3, B–D). Ni2+, on the other hand, appeared to selectively impact the delayed phase of the [Ca2+]cyt elevation, as it decreased the rates of the secondary [Ca2+]cyt increase by 70% (Fig. 3, A and E) without altering resting [Ca2+]cyt levels or the amplitude of the initial [Ca2+]cyt peak (C and D). T-type Ca2+ channel knockdown also decreased the slope by 40% without altering resting [Ca2+]cyt levels and, in addition, slightly increased the initial peak amplitude (Fig. 3, C–E). Conversely, Cav3.2 overexpression increased [Ca2+]cyt levels at all times during OGD, increasing the rates of the secondary [Ca2+]cyt elevation by 70%. These data indicate that T-type Ca2+ channels contribute to Ca2+ entry during the sustained phase of the [Ca2+]cyt elevations evoked by OGD. The kinetics of the delayed [Ca2+]cyt elevations measured during 30 min and 90 min of OGD correlated with the expression levels of T type Ca2+ channel isoforms and with cytotoxicity (Fig. 3F), a correlation that was particularly apparent for Ca2+ slopes measured during 90 min of OGD (R2 = 0.97). This tight relationship suggests that the Ca2+ ions entering across T-type channels during the delayed phase of the [Ca2+]cyt elevations evoked by OGD are particularly toxic for cells.
FIGURE 3.

Effect of T-type Ca2+ channels modulation on the [Ca2+]cyt elevations evoked by OGD. A, [Ca2+]cyt recordings during 90 min of OGD. The delayed [Ca2+]cyt elevation was reduced by Ni2+ and Cav3.1/Cav3.2 silencing and increased by Cav3.2 overexpression. Traces are the averaged [Ca2+]cyt responses measured in the indicated conditions. B, [Ca2+]cyt elevations evoked by 30 min of OGD. External Ca2+ removal prevented the elevations. C, basal [Ca2+]cyt levels recorded under the different conditions. D, amplitude of the initial [Ca2+]cyt elevation evoked by OGD. Data are mean ± S.E. from six to eight independent recordings. The total number of measured cells is indicated inside the bars. E, effect of T-type Ca2+ channel modulation on the slope of the secondary [Ca2+]cyt elevation. Data are mean ± S.E. from three to four independent recordings, expressed as fold changes from the control condition. The total number of measured cells is indicated inside the bars. F, cytotoxicity as a function of the Ca2+ slope measured in the indicated conditions. Data are from Figs. 2A and 3E. ns, non-significant; *, p < 0.05; **, p < 0.01; ***, p < 0.001 (Student's t test for unpaired samples).
During ischemia, mitochondrial and glycolytic ATP production is prevented, and the residual ATP is rapidly consumed by the activity of plasma membrane pumps that attempt to maintain a normal membrane potential and [Ca2+]cyt. Reducing the [Ca2+]cyt elevation associated with OGD should, therefore, decrease ATP consumption by plasma membrane Ca2+ pumps and delay ATP depletion during ODG. To test this hypothesis we measured cytosolic ATP levels with the genetically encoded indicators ATeam (34). As expected, cytosolic ATP levels rapidly decreased upon OGD to reach a minimum value within 20 min, and recovered immediately when oxygen and glucose were subsequently restored (Fig. 4A). The values recorded after 20 min of OGD approached the levels measured in cells exposed to 10 μg/ml oligomycin and 10 mm 2-deoxyglucose (Fig. 4A, dotted line), indicating that cytosolic ATP contents were fully depleted. Interestingly, pharmacological and genetic invalidation of T-type channel activity markedly delayed the kinetics of ATP decrease, increasing the time required to reach the minimal ATP levels during OGD by ∼50% (Fig. 4A and B). Ca2+ removal had an even more pronounced delaying effect (not shown) whereas overexpression of Cav3.2 channels had no significant effect (Fig. 4A and B). None of these treatments had any effect on basal ATP levels (not shown), indicating that T-type Ca2+ channel inhibition specifically decreases ATP consumption during OGD. This ATP sparing effect might contribute to the reduced cytotoxicity observed in these conditions.
FIGURE 4.

Effect of T-type channels activity on cytosolic ATP levels and on [Ca2+]mit during OGD. A, averaged ATeam ratio fluorescence recordings during OGD. [ATP]cyt levels decreased monotonically to reach a minimal value within 15 min and increased immediately upon reoxygenation. The dotted line indicates the level measured in cells exposed to 10 μg/ml oligomycin and 10 mm 2-deoxyglucose. B, averaged decay time in [ATP]cyt levels during OGD. C, averaged [Ca2+]mit recordings from cells exposed to 30 min of OGD. Ni2+ decreased [Ca2+]mit at rest and throughout the OGD, whereas Cav3.2 overexpression increased resting [Ca2+]mit and caused a delayed [Ca2+]mit elevation during OGD. D, effect of T-type channels activity on resting [Ca2+]mit levels (top panel) and on [Ca2+]mit levels at the end of the 30-min OGD. Data are mean ± S.E. from three to five independent recordings. The total number of measured cells is indicated inside the bars. ns, non-significant; *, p < 0.05; **, p < 0.01; ***, p < 0.001 (Student's t test for unpaired samples).
We next investigated whether T-type Ca2+ channels also contribute to mitochondrial matrix Ca2+ ([Ca2+]mit) elevations during OGD, using the mitochondria-targeted Cameleon probe 4mtD3cpv. The [Ca2+]mit responses evoked by OGD mimicked the responses observed in the cytosol, with a rapid increase followed by a sustained plateau and, after short OGD, a rapid return to baseline levels (Fig. 4C). As observed in the cytosol, Cav3.2 overexpression increased the amplitude of [Ca2+]mit elevations by accelerating the second phase of the response, whereas Ni2+ had the opposite effect (Fig. 4D). In contrast with the cytosolic data however, Cav3.2 overexpression increased, whereasNi2+ decreased, resting [Ca2+]mit levels, whereas Cav3.1 and Cav3.2 silencing had no measurable impact on basal [Ca2+]mit levels and on the [Ca2+]mit elevations evoked by OGD (Fig. 4D).
To test whether the [Ca2+]mit elevations contributed to OGD toxicity, we altered the expression levels of the major Ca2+ uptake protein of mitochondria, the mitochondrial Ca2+ uniporter (MCU) (16, 17). MCU overexpression, validated by Western blot (Fig. 5E), increased the delayed phase of the [Ca2+]mit elevation evoked by OGD as well as resting [Ca2+]mit levels (Fig. 5A and B) without altering the [Ca2+]cyt elevations evoked by OGD (Fig. 5E) Conversely, MCU silencing, validated by Western blot (Fig. 5E), decreased the [Ca2+]mit elevation evoked by OGD but did not alter basal [Ca2+]mit levels (Fig. 5A and B). The increased [Ca2+]mit elevation of MCU overexpressers was prevented by Ni2+, suggesting that a fraction of the Ca2+ taken up by mitochondria originated from T-type Ca2+ channels. Consistent with a role for mitochondrial Ca2+ uptake in cytotoxicity, MCU overexpression increased whereas MCU silencing decreased the cytotoxicity evoked by OGD (Fig. 5C). The deleterious effect of MCU expression was also prevented by Ni2+ (Fig. 5C). The opposite effects of Ni2+ and of MCU overexpression on [Ca2+]mit and cytotoxicity suggests that mitochondria might be located close to T-type Ca2+ channels. Accordingly, expression of a matrix-targeted RFP revealed a high density of mitochondria in PC12 cells, with numerous mitochondria located beneath the plasma membrane that co-localized extensively with Cav3.2 immunoreactivity (Fig. 5D, Mander's coefficient, 0.56, n = 18). This indicates that the majority of Cav3.2 channels were located in close proximity to subplasmalemmal mitochondria. To test whether Ca2+ ions entering across T-type Ca2+ channels reach mitochondria, we used a low potassium concentration (20 mm) to depolarize the plasma membrane to ∼-50 mV and selectively activate T-type Ca2+ channels. This protocol evoked rapid increases in [Ca2+]mit that were reduced by Cav3.1/Cav 3.2 silencing (Fig. 6A). The mitochondrial responses evoked by ER Ca2+ release or by SOCE channel activation were not affected by Cav3.1/Cav 3.2 silencing (Fig. 6C and 6D), validating the specificity of the siRNA. These data indicate that Ca2+ ions entering across T-type Ca2+ channels are taken up by mitochondria. These mitochondria must be located close to the influx channels as mitochondrial Ca2+ uptake only occurs at microdomains of high Ca2+ concentration (27). Accordingly, the [Ca2+]cyt elevations evoked by 20 mm K+ were not affected by Cav3.1/Cav 3.2 silencing (Fig. 6B), indicating that incoming Ca2+ ions are preferentially transmitted from T-type Ca2+ channels to mitochondria. These data indicate that Cav3.2 channels are functionally coupled to subplasmalemmal mitochondria and contribute to pathological [Ca2+]mit elevations during OGD.
FIGURE 5.

Effect of MCU overexpression of [Ca2+]mit elevations and cytotoxicity evoked by OGD. A, averaged [Ca2+]mit recordings from naïve, MCU-depleted, and MCU-overexpressing cells exposed to 30 min of OGD. Traces are the averaged [Ca2+]cyt responses measured in the indicated conditions. B, [Ca2+]mit levels recorded before and 30 min after the initiation of OGD under the different conditions. Data are mean ± S.E. from three to six recordings. The total number of measured cells is indicated inside the bars. C, effect of MCU silencing and overexpression on LDH release. Data are mean ± S.E. n is indicated inside the bars. D, Cav3.2 immunostaining in a cell expressing a matrix-targeted RFP. A significant fraction (56%) of the Cav3.2 immunoreactivity colocalized with the RFP fluorescence (white pixels). E, Western blot analysis showing the monomeric (mon) and dimeric (dim) forms of the MCU protein, which increased upon MCU overexpression (MCU) and decreased upon MCU silencing (shMCU) in a mitochondrial-enriched preparation. The insets show blot quantification. C, control. F, [Ca2+]cyt levels recorded before and 30 min after the initiation of OGD in naïve and MCU-overexpressing cells. Data are mean ± S.E. from three to six independent recordings. The total number of measured cells is indicated inside the bars. ns, non-significant; *, p < 0.05; **, p < 0.01; ***, p < 0.001 (Student's t test for unpaired samples).
FIGURE 6.

Effect of T-type Ca2+ channel activation on [Ca2+]mit and [Ca2+]cyt. A, [Ca2+]mit responses evoked by the addition of 20 mm K+ to naïve and Cav3.1/Cav3.2-depleted cells. Cav3.1/Cav3.2 silencing significantly decreased the amplitude of the [Ca2+]mit response. B, [Ca2+]cyt responses recorded under the same conditions. C, [Ca2+]mit responses evoked by the addition of 100 μm ATP to evoke rapid Ca2+ release from intracellular stores. D, [Ca2+]mit responses evoked by the addition of thapsigargin followed by Ca2+ readmission to promote Ca2+ entry across store-operated Ca2+ entry channels. Cav3.1/Cav3.2 silencing had no effect on the mitochondrial Ca2+ responses associated with ER Ca2+ release or store-operated Ca2+ entry-mediated Ca2+ influx. Data are mean ± S.E. from three to six independent recordings. The total number of measured cells is indicated inside the bars. ns, non-significant; **, p < 0.01 (Student's t test for unpaired samples).
DISCUSSION
We report here that T-type Ca2+ channels contribute to cytotoxic Ca2+ elevations occurring during ischemia in PC12 cells, and that this toxicity is mediated at least in part by mitochondrial Ca2+ uptake. Consistent with earlier reports (31), we found that PC12 cells express very little amounts of T-type channels. Although we detected mRNA for both Cav3.1 and Cav3.2 by quantitative PCR, we could only document expression of Cav3.2 channels by immunofluorescence, and only a small fraction of cells was decorated with the Cav3.2 antibody. Moreover, we could not record endogenous T-type Ca2+ currents in PC12 cells, even with the sensitive tail current protocol described in (31), whereas we could readily record T-type Ca2+ currents when overexpressing Cav3.2 channels. Although we cannot rule out that T-type Ca2+ channels are activated or recruited during OGD as we could not record cells under these conditions, these data indicate that native T-type Ca2+ channels are expressed at very low level at the PM of PC12 cells. Despite their low abundance, we could obtain functional evidence of T-type Ca2+ channel activity by recording Ca2+ elevations evoked by small membrane depolarization steps with low concentrations of K+. More importantly, we observed that T-type Ca2+ channels contributed significantly to the cytotoxicity associated with OGD, and could relate this protective effect to specific alterations of cellular Ca2+ signals. Our long-term recordings with genetically encoded indicators revealed that [Ca2+]cyt levels increase steadily for 2 h during OGD. External Ca2+ removal nearly abrogated this sustained [Ca2+]cyt elevation and decreased OGD cytotoxicity, confirming that Ca2+ influx contributes to ischemia-induced Ca2+ overload and cell death. Remarkably, T-type channel knock-down or inhibition with low doses of Ni2+ decreased OGD cytotoxicity to levels similar than Ca2+ removal, but had much more specific effects on [Ca2+]cyt that were restricted to the delayed phase of the sustained [Ca2+]cyt elevation. The main effect of T-type channel inhibition was to slow the rates of the secondary [Ca2+]cyt increase, without impacting on the amplitude of the first rapid elevation. This suggests that T-type Ca2+ channels are activated with a delay following OGD and contribute only a fraction of the Ca2+ influx-dependent [Ca2+]cyt elevation during anoxia. T-type channel inhibition also delayed the decline in cellular ATP levels during OGD, likely by decreasing the Ca2+ load that must be actively extruded by plasma membrane Ca2+ ATPase. In contrast, overexpression Cav3.2 channels potentiated the sustained phase of the [Ca2+]cyt response and maximally increased OGD toxicity. Cav3.2 overexpression also increased basal [Ca2+]cyt levels, indicating that enforced expression of T-type Ca2+ channels might disrupt cellular Ca2+ homeostasis. These data link the protective effect of T-channels inhibitors reported previously in rat hippocampal neurons (11, 12) to decreases in pathological Ca2+ elevations. More importantly, the observation that manipulations of T-type channel expression preferentially alter the delayed Ca2+ signals during OGD yet maximally modulate the ensuing cytotoxicity suggests that the Ca2+ ions entering across these channels are particularly toxic.
Our results indicate that Ca2+ transfer to subplasmalemmal mitochondria might explain the unexpected toxicity of Ca2+ ions entering across T-type channels during ischemia. Sustained [Ca2+]mit elevations can trigger the release of pro-apoptotic factors that initiate cell death (35, 36). We show here that mitochondria are exposed to large Ca2+ loads during ischemia and demonstrate the toxicity of mitochondrial Ca2+ uptake by showing that cells overexpressing the MCU are more sensitive to ischemia-induced cell death, whereas cells depleted of MCU are protected. MCU overexpression was shown to be pro-apoptotic (17), but whether increased mitochondrial Ca2+ uptake contributes to acute toxicity during ischemia is not known. We show that MCU overexpression increases mitochondrial [Ca2+] during the ischemic insult, whereas MCU depletion has the converse effect, demonstrating that a Ca2+ increase restricted to mitochondria is sufficient to potentiate cell death. It should be noted, however, that we did not explore the impact of T-type channels and MCU manipulations on [Ca2+]cyt and [Ca2+]mit during reperfusion. We observed that, for OGD lasting up to 90 min, [Ca2+]cyt levels rapidly returned to basal levels upon reperfusion. However, for longer periods of OGD, we observed instead that [Ca2+]cyt did not regain resting levels but remained elevated for several minutes (Fig. 1A). Further experiments are needed to test whether Cav3.2 channels and the MCU also contribute to [Ca2+]cyt and [Ca2+]mit elevations during this recovery phase. Importantly, the [Ca2+]mit elevations evoked by OGD were increased by Cav3.2 overexpression and decreased by their invalidation or pharmacological inhibition, indicating that mitochondria take up Ca2+ ions flowing across T-type channels.
Subplasmalemmal mitochondria were shown previously to take up Ca2+ ions entering across voltage-gated Ca2+ channels in chromaffin cells, an uptake facilitated by the generation of high Ca2+ microdomains around the large capacity L-type channels (26). In contrast, high Ca2+ microdomains were not detected around mitochondria during the opening of store-operated Ca2+ entry channels, a finding that was explained by the exclusion of mitochondria from the contact sites between the ER and the PM where SOCE channels activate (27). Here, we show that a fraction of subplasmalemmal mitochondria is located in proximity to T-type Ca2+ channels, whose activation does not require the apposition of the ER. However, T-type Ca2+ currents are of much lower amplitude and duration than L-type Ca2+ currents, and, as discussed above, the density of T-type channels in PC12 cells is very low. The observation that mitochondria can take up the Ca2+ entering across T-type channels therefore points to a privileged communication between mitochondria and these Ca2+ channels. We could obtain evidence for this functional coupling by recording [Ca2+]mit increases evoked by membrane depolarization to voltages (∼-50 mV) that selectively activate T-type Ca2+ channels. Efficient Ca2+ transfer from PM to mitochondria is also suggested by our observation that Ni2+ specifically reduced resting [Ca2+]mit and not [Ca2+]cyt levels. Ni2+ also inhibits Ca2+ uptake by isolated mitochondria (37), but such an inhibition would require millimolar concentrations in intact cells because of the low affinity of the divalent metal transporter 1 (38, 39). Our data therefore indicate that facilitated Ca2+ transfer from T-type Ca2+ channels to subplasmalemmal mitochondria contributes significantly to the toxicity during ischemia.
Acknowledgments
We thank Drs. Paula Nunes and Maud Frieden for critical reading of the manuscript; Drs. R.Y. Tsien, A. Palmer, and L. Combettes for providing the Cameleon constructs; Dr. Rosario Rizzuto for the MCU construct; and Cyril Castelbou and Patrick Teta for expert technical assistance.
This work was supported by Swiss National Foundation Grant 310030B-133126 (to N. D.).
- [Ca2+]cyto
- cytosolic [Ca2+]
- [Ca2+]mito
- mitochondrial matrix [Ca2+]
- ER
- endoplasmic reticulum
- PM
- plasma membrane
- MCU
- mitochondrial Ca2+ uniporter
- OGD
- oxygen and glucose deprivation
- LDH
- lactate dehydrogenase.
REFERENCES
- 1. Szydlowska K., Tymianski M. (2010) Calcium, ischemia and excitotoxicity. Cell Calcium 47, 122–129 [DOI] [PubMed] [Google Scholar]
- 2. Bano D., Young K. W., Guerin C. J., Lefeuvre R., Rothwell N. J., Naldini L., Rizzuto R., Carafoli E., Nicotera P. (2005) Cleavage of the plasma membrane Na+/Ca2+ exchanger in excitotoxicity. Cell 120, 275–285 [DOI] [PubMed] [Google Scholar]
- 3. Czyz A., Kiedrowski L. (2002) In depolarized and glucose-deprived neurons, Na+ influx reverses plasmalemmal K+-dependent and K+-independent Na+/Ca2+ exchangers and contributes to NMDA excitotoxicity. J. Neurochem. 83, 1321–1328 [DOI] [PubMed] [Google Scholar]
- 4. Jeffs G. J., Meloni B. P., Bakker A. J., Knuckey N. W. (2007) The role of the Na(+)/Ca(2+) exchanger (NCX) in neurons following ischaemia. J. Clin. Neurosci. 14, 507–514 [DOI] [PubMed] [Google Scholar]
- 5. Sattler R., Charlton M. P., Hafner M., Tymianski M. (1998) Distinct influx pathways, not calcium load, determine neuronal vulnerability to calcium neurotoxicity. J. Neurochem. 71, 2349–2364 [DOI] [PubMed] [Google Scholar]
- 6. Xiong Z. G., Zhu X. M., Chu X. P., Minami M., Hey J., Wei W. L., MacDonald J. F., Wemmie J. A., Price M. P., Welsh M. J., Simon R. P. (2004) Neuroprotection in ischemia. Blocking calcium-permeable acid-sensing ion channels. Cell 118, 687–698 [DOI] [PubMed] [Google Scholar]
- 7. Aarts M., Iihara K., Wei W. L., Xiong Z. G., Arundine M., Cerwinski W., MacDonald J. F., Tymianski M. (2003) A key role for TRPM7 channels in anoxic neuronal death. Cell 115, 863–877 [DOI] [PubMed] [Google Scholar]
- 8. Sun H. S., Jackson M. F., Martin L. J., Jansen K., Teves L., Cui H., Kiyonaka S., Mori Y., Jones M., Forder J. P., Golde T. E., Orser B. A., Macdonald J. F., Tymianski M. (2009) Suppression of hippocampal TRPM7 protein prevents delayed neuronal death in brain ischemia. Nat. Neurosci. 12, 1300–1307 [DOI] [PubMed] [Google Scholar]
- 9. Demaurex N., Scorrano L. (2009) Reactive oxygen species are NOXious for neurons. Nat. Neurosci. 12, 819–820 [DOI] [PubMed] [Google Scholar]
- 10. Cheng Y. D., Al-Khoury L., Zivin J. A. (2004) Neuroprotection for ischemic stroke. Two decades of success and failure. NeuroRx 1, 36–45 [DOI] [PMC free article] [PubMed] [Google Scholar]
- 11. Nikonenko I., Bancila M., Bloc A., Muller D., Bijlenga P. (2005) Inhibition of T-type calcium channels protects neurons from delayed ischemia-induced damage. Mol. Pharmacol. 68, 84–89 [DOI] [PubMed] [Google Scholar]
- 12. Bancila M., Copin J. C., Daali Y., Schatlo B., Gasche Y., Bijlenga P. (2011) Two structurally different T-type Ca 2+ channel inhibitors, mibefradil and pimozide, protect CA1 neurons from delayed death after global ischemia in rats. Fundam. Clin. Pharmacol. 25, 469–478 [DOI] [PubMed] [Google Scholar]
- 13. Bijlenga P., Liu J. H., Espinos E., Haenggeli C. A., Fischer-Lougheed J., Bader C. R., Bernheim L. (2000) T-type α 1H Ca2+ channels are involved in Ca2+ signaling during terminal differentiation (fusion) of human myoblasts. Proc. Natl. Acad. Sci. U.S.A. 97, 7627–7632 [DOI] [PMC free article] [PubMed] [Google Scholar]
- 14. Orrenius S., Zhivotovsky B., Nicotera P. (2003) Regulation of cell death. The calcium-apoptosis link. Nat. Rev. Mol. Cell Biol. 4, 552–565 [DOI] [PubMed] [Google Scholar]
- 15. Santo-Domingo J., Demaurex N. (2010) Calcium uptake mechanisms by mitochondria. Biochim. Biophys. Acta 1797, 907–912 [DOI] [PubMed] [Google Scholar]
- 16. Baughman J. M., Perocchi F., Girgis H. S., Plovanich M., Belcher-Timme C. A., Sancak Y., Bao X. R., Strittmatter L., Goldberger O., Bogorad R. L., Koteliansky V., Mootha V. K. (2011) Integrative genomics identifies MCU as an essential component of the mitochondrial calcium uniporter. Nature 476, 341–345 [DOI] [PMC free article] [PubMed] [Google Scholar]
- 17. De Stefani D., Raffaello A., Teardo E., Szabò I., Rizzuto R. (2011) A forty-kilodalton protein of the inner membrane is the mitochondrial calcium uniporter. Nature 476, 336–340 [DOI] [PMC free article] [PubMed] [Google Scholar]
- 18. Demaurex N., Poburko D., Frieden M. (2009) Regulation of plasma membrane calcium fluxes by mitochondria. Biochim. Biophys. Acta 1787, 1383–1394 [DOI] [PubMed] [Google Scholar]
- 19. Robb-Gaspers L. D., Burnett P., Rutter G. A., Denton R. M., Rizzuto R., Thomas A. P. (1998) Integrating cytosolic calcium signals into mitochondrial metabolic responses. EMBO J. 17, 4987–5000 [DOI] [PMC free article] [PubMed] [Google Scholar]
- 20. Hajnóczky G., Robb-Gaspers L. D., Seitz M. B., Thomas A. P. (1995) Decoding of cytosolic calcium oscillations in the mitochondria. Cell 82, 415–424 [DOI] [PubMed] [Google Scholar]
- 21. Gouriou Y., Demaurex N., Bijlenga P., De Marchi U. (2011) Mitochondrial calcium handling during ischemia-induced cell death in neurons. Biochimie 93, 2060–2067 [DOI] [PubMed] [Google Scholar]
- 22. Bernardi P. (1999) Mitochondrial transport of cations. Channels, exchangers, and permeability transition. Physiol. Rev. 79, 1127–1155 [DOI] [PubMed] [Google Scholar]
- 23. Rizzuto R., Brini M., Murgia M., Pozzan T. (1993) Microdomains with high Ca2+ close to IP3-sensitive channels that are sensed by neighboring mitochondria. Science 262, 744–747 [DOI] [PubMed] [Google Scholar]
- 24. Pacher P., Thomas A. P., Hajnóczky G. (2002) Ca2+ marks. Miniature calcium signals in single mitochondria driven by ryanodine receptors. Proc. Natl. Acad. Sci. U.S.A. 99, 2380–2385 [DOI] [PMC free article] [PubMed] [Google Scholar]
- 25. Rizzuto R., Pinton P., Carrington W., Fay F. S., Fogarty K. E., Lifshitz L. M., Tuft R. A., Pozzan T. (1998) Close contacts with the endoplasmic reticulum as determinants of mitochondrial Ca2+ responses. Science 280, 1763–1766 [DOI] [PubMed] [Google Scholar]
- 26. Montero M., Alonso M. T., Carnicero E., Cuchillo-Ibáñez I., Albillos A., García A. G., García-Sancho J., Alvarez J. (2000) Chromaffin-cell stimulation triggers fast millimolar mitochondrial Ca2+ transients that modulate secretion. Nat. Cell Biol. 2, 57–61 [DOI] [PubMed] [Google Scholar]
- 27. Giacomello M., Drago I., Bortolozzi M., Scorzeto M., Gianelle A., Pizzo P., Pozzan T. (2010) Ca2+ hot spots on the mitochondrial surface are generated by Ca2+ mobilization from stores, but not by activation of store-operated Ca2+ channels. Mol. Cell 38, 280–290 [DOI] [PubMed] [Google Scholar]
- 28. Orci L., Ravazzola M., Le Coadic M., Shen W.-W., Demaurex N., Cosson P. (2009) From the Cover: STIM1-induced precortical and cortical subdomains of the endoplasmic reticulum. Proc. Natl. Acad. Sci. U.S.A. 106, 19358–19362 [DOI] [PMC free article] [PubMed] [Google Scholar]
- 29. Zhu W. H., Conforti L., Czyzyk-Krzeska M. F., Millhorn D. E. (1996) Membrane depolarization in PC-12 cells during hypoxia is regulated by an O2-sensitive K+ current. Am. J. Physiol. 271, C658–665 [DOI] [PubMed] [Google Scholar]
- 30. Garber S. S., Hoshi T., Aldrich R. W. (1989) Regulation of ionic currents in pheochromocytoma cells by nerve growth factor and dexamethasone. J. Neurosci. 9, 3976–3987 [DOI] [PMC free article] [PubMed] [Google Scholar]
- 31. Del Toro R., Levitsky K. L., López-Barneo J., Chiara M. D. (2003) Induction of T-type calcium channel gene expression by chronic hypoxia. J. Biol. Chem. 278, 22316–22324 [DOI] [PubMed] [Google Scholar]
- 32. De Marchi U., Castelbou C., Demaurex N. (2011) Uncoupling protein 3 (UCP3) modulates the activity of Sarco/endoplasmic reticulum Ca2+-ATPase (SERCA) by decreasing mitochondrial ATP production. J. Biol. Chem. 286, 32533–32541 [DOI] [PMC free article] [PubMed] [Google Scholar]
- 33. Lee J. H., Gomora J. C., Cribbs L. L., Perez-Reyes E. (1999) Nickel block of three cloned T-type calcium channels. Low concentrations selectively block α1H. Biophys. J. 77, 3034–3042 [DOI] [PMC free article] [PubMed] [Google Scholar]
- 34. Imamura H., Nhat K. P., Togawa H., Saito K., Iino R., Kato-Yamada Y., Nagai T., Noji H. (2009) Visualization of ATP levels inside single living cells with fluorescence resonance energy transfer-based genetically encoded indicators. Proc. Natl. Acad. Sci. U.S.A. 106, 15651–15656 [DOI] [PMC free article] [PubMed] [Google Scholar]
- 35. Nicholls D. G. (2009) Mitochondrial calcium function and dysfunction in the central nervous system. Biochim. Biophys. Acta 1787, 1416–1424 [DOI] [PMC free article] [PubMed] [Google Scholar]
- 36. Kristián T., Siesjö B. K. (1998) Calcium in ischemic cell death. Stroke 29, 705–718 [DOI] [PubMed] [Google Scholar]
- 37. Bragadin M., Viola E. R. (1997) Ni++ as a competitive inhibitor of calcium transport in mitochondria. J. Inorg. Biochem. 66, 227–229 [DOI] [PubMed] [Google Scholar]
- 38. Illing A. C., Shawki A., Cunningham C. L., Mackenzie B. (2012) Substrate profile and metal-ion selectivity of human divalent metal-ion transporter-1. J. Biol. Chem. 287, 30485–30496 [DOI] [PMC free article] [PubMed] [Google Scholar]
- 39. Davidson T., Chen H., Garrick M. D., D'Angelo G., Costa M. (2005) Soluble nickel interferes with cellular iron homeostasis. Mol. Cell Biochem. 279, 157–162 [DOI] [PubMed] [Google Scholar]