

Background: Mutation of a proline at the AChR transmitter-binding site causes a congenital myasthenic syndrome.
Results: This proline interacts with a glycine across subunits but only when ACh is present.
Conclusion: Proline mutations impair the establishment of a high affinity for ACh, which requires a concerted inter-subunit backbone strain.
Significance: It is possible to engineer receptors having one functional binding site.
Keywords: Cholinergic Receptor, Cys Loop Receptors, Gating, Ion Channels, Synapses
Abstract
The neuromuscular acetylcholine (ACh) receptor has two conserved prolines in loop D of the complementary subunit at each of its two transmitter-binding sites (α-ϵ and α-δ). We used single-channel electrophysiology to estimate the energy changes caused by mutations of these prolines with regard to unliganded gating (ΔG0) and the affinity change for ACh that increases the open channel probability (ΔGB). The effects of mutations of ProD2 (ϵPro-121/δPro-123) were greater than those of its neighbor (ϵPro-120/δPro-122) and were greater at α-ϵ versus α-δ. The main consequence of the congenital myasthenic syndrome mutation ϵProD2-L was to impair the establishment of a high affinity for ACh and thus make ΔGB less favorable. At both binding sites, most ProD2 mutations decreased constitutive activity (increased ΔG0). LRYHQG and RL substitutions reduced substantially the net binding energy (made ΔGBACh less favorable) by ≥2 kcal/mol at α-ϵ and α-δ, respectively. Mutant cycle analyses were used to estimate energy coupling between the two ProD2 residues and between each ProD2 and glycine residues (αGly-147 and αGly-153) on the primary (α subunit) side of each binding pocket. The distant binding site prolines interact weakly. ProD2 interacts strongly with αGly-147 but only at α-ϵ and only when ACh is present. The results suggest that in the low to-high affinity change there is a concerted inter-subunit strain in the backbones at ϵProD2 and αGly-147. It is possible to engineer receptors having a single functional binding site by using a α-ϵ or α-δ ProD2-R knock-out mutation. In adult-type ACh receptors, the energy from the affinity change for ACh is approximately the same at the two binding sites (approximately −5 kcal/mol).
Introduction
Ion channels are molecular valves that regulate the flow of water and ions across cell membranes. In the mammalian central and peripheral nervous systems, neurotransmitters bind to synaptic receptor channels to increase the probability of channel opening and transmembrane currents. Agonists are small molecules that bind with a higher affinity to the O(pen) versus C(losed) channel conformational ensemble, so when these ligands occupy their target sites the C↔ O “gating” equilibrium constant increases. We use the word gating to refer to the entire C↔ O transition rather than just the conductance-changing microscopic step within the allosteric transition.
Acetylcholine (ACh),2 the neurotransmitter at the vertebrate nerve-muscle synapse, has an ∼6000-fold higher affinity for the O conformation of the adult-type muscle nicotinic acetylcholine receptor (AChR). Hence, ACh molecules at both of the two transmitter-binding sites increase the gating equilibrium constant by a factor of ∼60002 (from ∼7 × 10⁻⁷ to ∼25). The amount of energy (kcal/mol) that each agonist molecule supplies to stabilize the O state is equal to −0.59 times the natural logarithm of the agonist affinity ratio. For adult wild-type mouse neuromuscular AChRs, the free energy from ACh at each site has been estimated to be ΔGBACh = −5.1 kcal/mol (1–3). This amount of energy from two binding sites is sufficient to overcome the +8.4 kcal/mol energy gap that separates C from O in the absence of agonists.
The neuromuscular AChR transmitter-binding sites are located in the extracellular domain of the protein at α-ϵ and α-δ subunit interfaces (Fig. 1a). These two sites are ∼5 nm from each other and from a gate region in the transmembrane domain that regulates ionic conductance (4–6). There are conserved vicinal prolines at the binding sites in the complementary ϵ/δ subunit (ProD1 and ProD2; Fig. 1b). Fig. 1c shows some of the amino acids at the ligand-binding site of the Lymnaea stagnalis acetylcholine-binding protein, a soluble homolog of the AChR extracellular domain (7). The αC atoms of the residues corresponding to the AChR loop D prolines are shown as spheres (Pro-115 and Ser-116). Here, we report the functional consequences of mutations of the AChR prolines at both the α-ϵ and α-δ transmitter-binding sites, with regard to both the energy of unliganded gating (ΔG0) and the energy from the affinity change for the transmitter (ΔGBACh). The sum of these two quantities is equal to the energy difference between A2O and A2C (where A is the agonist), and it determines the diliganded gating equilibrium constant and the maximum open channel probability (see “Experimental Procedures”).
FIGURE 1.

Prolines at the AChR transmitter-binding site. a, AChR has two transmitter-binding sites in the extracellular domain, at the α-ϵ and α-δ subunit interfaces (boxed region) (Torpedo marmorata; Protein Data Bank accession number 2bg9 (35)). b, unliganded Torpedo AChR α-δ transmitter-binding site. Pink, ProD1 and ProD2 on the complementary side of the binding site in loop D (right) and αC atoms of GlyB1 and GlyB2 in the α subunit (left). Green, energy from ACh binding is mainly from αTrp-149, αTyr-190, and αTyr-198. c, L. stagnalis acetylcholine-binding protein, ligand-binding site with carbamylcholine (CCh) (Protein Data Bank accession number 1uv6 (7)). The loop D αC atoms of Pro-115 and Ser-116 (pink) correspond to ProD1 and ProD2 in AChRs.
A leucine substitution at ϵProD2 causes a congenital myasthenic syndrome (CMS) and has been studied previously at the single-channel level in human AChRs (8). This mutation decreases the resting affinity of the α-ϵ transmitter-binding site by ∼40-fold and the diliganded gating equilibrium constant by nearly 300-fold. The effects of leucine substitutions on whole-cell current dose-response curves have been measured in mouse AChRs, and a large right-shift was apparent, only for the ϵ subunit (ϵProD2-L) mutation (9).
The results are presented in five sections. 1) We describe a method to measure the change in ΔGBACh caused by a ProD2 mutation at just one binding site. 2) The CMS mutation ϵProD2-L is analyzed according to a cyclic model of activation to estimate the high affinity equilibrium dissociation constant for ACh. 3) 25 different side chain substitutions of ProD2 at α-ϵ and α-δ are quantified with regard to their effects on ΔG0 and ΔGBACh. 4) Mutant cycle analyses reveal the degree of energy coupling between the two binding sites and between ProD2 and α subunit glycines at each binding site, both with and without ACh present. 5) We engineer AChRs to have a single functional binding site and estimate ΔGBACh from α-ϵ and α-δ, independently.
EXPERIMENTAL PROCEDURES
Mutagenesis and Expression
Human embryonic kidney cells (HEK293) cells were maintained at 37 °C (95% air and 5% CO2) and Dulbecco's minimum essential medium supplemented with 10% (v/v) fetal bovine serum plus 1% (v/v) penicillin/streptomycin (pH 7.4). The QuikChange site-directed mutagenesis kit (Stratagene) was used to introduce mutations in mouse AChR α, β, δ, and ϵ subunit cDNAs. All sequences were verified by dideoxy sequencing. The cells were transiently transfected with a mixture of cDNAs encoding WT or mutant subunits by calcium phosphate precipitation. 3.5–5 μg of DNA per 35-mm culture dish, in the ratio of 2:1:1:1 (α/β/ϵ/δ), and GFP (0.1 μg/μl, as a marker) were added for ∼16 h. The cells were washed and electrophysiological recording commenced within 24–48 h.
Electrophysiology
Single-channel currents were recorded in the cell-attached patch configuration at 23 °C. Unless noted otherwise, the bath solution (K-PBS) (mm) contained the following: 142 KCl, 5.4 NaCl, 1.8 CaCl2, 1.7 MgCl2, 10 HEPES/KOH (pH 7.4). The pipette solution was always phosphate-buffered saline (PBS) (mm) and contained the following: 137 NaCl, 0.9 CaCl2, 2.7 KCl, 1.5 KH2PO4, 0.5 MgCl2, and 8.1 Na2HPO4 (pH 7.4). ACh was sometimes added but only to the pipette solution. For the measurement of diliganded currents, the pipette potential was held at −100 mV (which corresponds to a membrane potential of +100 mV) so that the single-channel currents were outward, and there was little or no channel block by ACh. For the measurement of unliganded currents (no channel block), the bath was PBS, and the pipette potential was held at +70 mV (which corresponds to a membrane potential of approximately −100 mV; inward currents). Patch pipettes were pulled from borosilicate capillaries to a resistance of ∼10 megohms and coated with Sylgard (Dow Corning). Single-channel currents were recorded using a PC-505 amplifier (Warner instrument Corp., Hamden, CT) with low pass filtering at 20 kHz and digitized at a sampling frequency of 50 kHz using an SCB-68 data acquisition board (National Instruments).
Kinetic Analysis
QUB software was used to acquire and analyze the single-channel currents. Clusters of openings arising from the activity from a single AChR were selected by eye, and the currents were idealized into noise-free intervals (after digitally low pass filtering, 12 kHz) by using the segmental k means algorithm with a two-state C(losed)↔ O(pen) model (10) (starting rate constants, 100 s−1). Rate constants were estimated from the idealized interval durations by using a maximum log-likelihood algorithm (11) after imposing a dead time correction (applied to both open and shut intervals) of 50 μs (12). In most of the diliganded experiments, the interval durations obtained at high [ACh] concentrations were fitted by the same two-state model, but in some cases another shut state was added to the model (connected to O) to accommodate a relatively rare and short lived (∼2 ms) desensitized state. In ϵ/δProD2-GHY, an extra O state was added to accommodate an additional brief and relatively rare open component. In the unliganded experiments, an extra open state (connected to O) was added to the basic two-state scheme to accommodate a rate, long open component.
The energies arising from the affinity changes at the two binding sites were estimated by invoking a cyclic model for receptor activation (Fig. 2a) (4, 13–15). The rate and equilibrium constants for low affinity binding of ACh and the A2C↔ A2O transition were estimated using the kinetic scheme shown in Fig. 2b.
FIGURE 2.
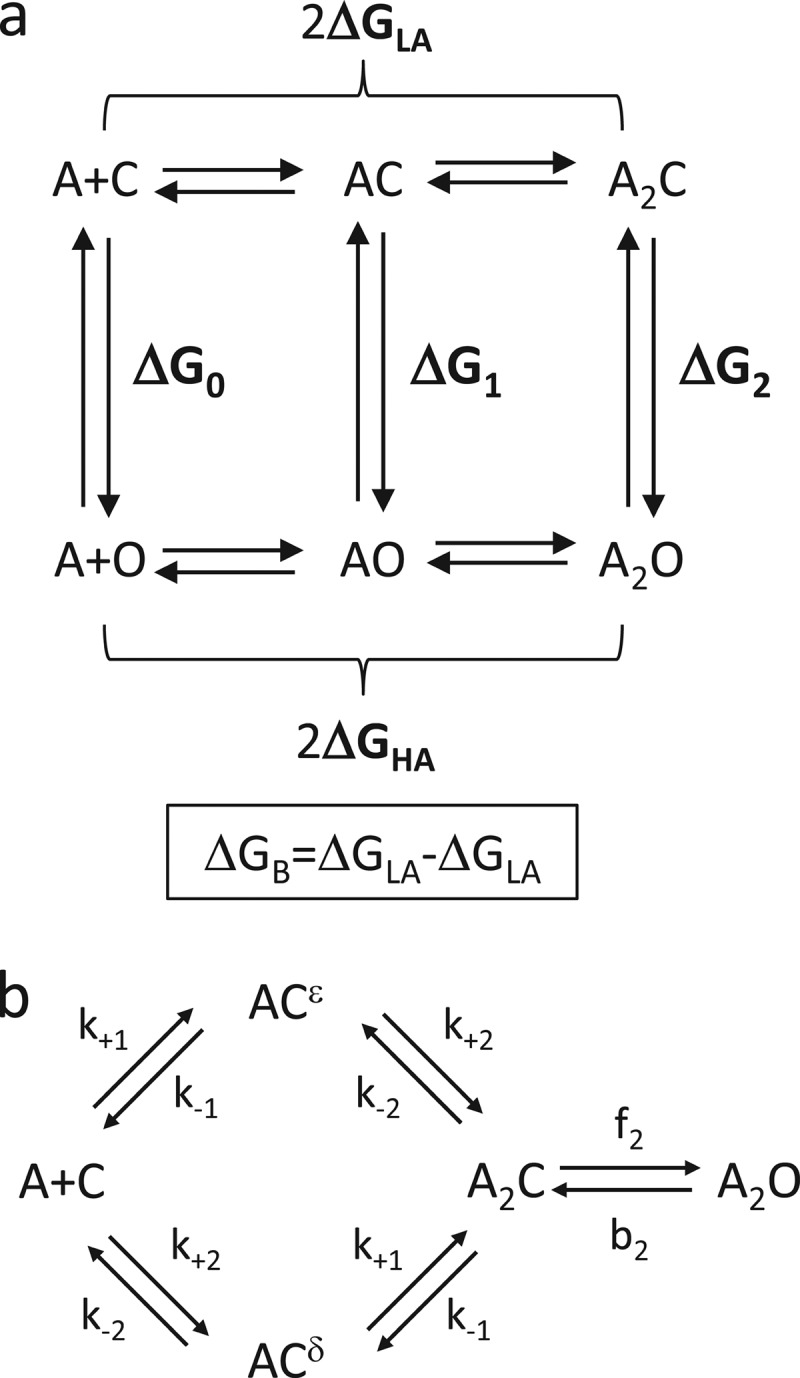
State models. a, thermodynamic cycle of the AChR activation. A is the agonist. The vertical lines are gating; C and O are the closed and open channel conformational ensembles. The horizontal arrows are binding; C is low affinity (LA) and O is high affinity (HA). The gating free energies, ΔGn (where n is the number of bound agonists) are all ΔGO − ΔGC. The binding free energies, ΔGHA and ΔGLA are bound minus free for each of two equivalent sites. Without any external energy, the net energy change, C-to-A2O, by clockwise and counterclockwise paths are equal, so 2ΔGLA + ΔG2 = ΔG0 + 2ΔGHA. Rearranging and defining ΔGB = ΔGHA − ΔGLA yields 2ΔGB = ΔG2 − ΔG0. With unequal binding sites, 2ΔGB = ΔGB1+ΔGB2 (see Equation 2). b, a two binding site scheme for AChR activation. The superscripts denote the α-ϵ or α-δ agonist-binding site. k+1 and k−1 are the α-ϵ agonist association/dissociation rate constants, and k+2 and k−1 are for the α-δ site (Kd = k−/k+). f2 and b2 are the diliganded forward and backward gating rate constants (E2 = f2/b2).
ΔG0 Estimation
To increase the frequency and clustering of unliganded openings, three different background constructs were used as follows: α(D97A + Y127F + S269I) (“DYS”), αDYS + βL269D, and αDYS + β(L269D + T456F). αAsp-97 is in loop A; αTyr-127 is in strand β6; αSer-269 is near the C terminus of M2; βLeu-269 is in M2, and βThr-456 is in M4. Individually, each of these mutations only decreases ΔG0 (is a gain-of-function) and has been shown not to affect either the resting equilibrium dissociation constant (KdACh) or the free energy from binding (ΔGBACh) (16–19). The ΔΔG0 values for each of these backgrounds are given in Table 1. Because there was no agonist in the pipette solution, there was no channel block; the inward single-channel current amplitude at −100 mV was ∼7 pA. For each ProD2 mutation + background, the unliganded forward (f0) and backward (b0) gating rate constants were measured from the single-channel current interval durations, and their ratios were computed to give E0obs. ΔΔG0 for the ProD2 mutation alone (kcal/mol) was calculated as −0.59 ln(E0obs/E0bkg).
TABLE 1.
Background constructs
bkg means background notation; Eapp means apparent equilibrium constant of the background (* indicates calculated assuming energetic independence of each mutation; all others measured experimentally); ΔΔG0, relative free energy = −0.59 ln(Eapp/EDYS, cho, or ACh), where E0DYS = 0.047, E2cho = 0.046, and E2ACh = 25.4.
| Bkg | Ligand | Construct | Eapp | ΔΔG0 | Ref. |
|---|---|---|---|---|---|
| B0 | +100 mV | 1.5 | 1 | ||
| B1 | None | DYS | 0.047 | 3 | |
| B2 | None | DYS + βL269D | 0.194 | −0.8 | |
| B3 | None | DYS + β(L269D + T456F) | 1.455 | −2.0 | |
| B4 | None | DYS + αN217K + βT464F | 11.24* | −3.2 | |
| B5 | None | α(Y127F + S269I) | 0.0003* | −5.2 | |
| B6 | None | α(D97A + S269I) | 0.0008* | −5.8 | |
| B7 | cho | αV283W | 1.28 | −1.4 | 25 |
| B8 | cho | αP272A | 10.9 | −3.2 | 30 |
| B9 | cho | αC418Y | 7.84 | −2.5 | 17 |
| B10 | cho | βT464F | 0.57 | −1.0 | 17 |
| B11 | ACh | α(P272G + V283W), +100 mV | 0.77 | 2.1 | |
| B12 | ACh | α(Y127C + P272G + V283W),+ 100 mV | 0.0042* | 5.1 | |
| B13 | None | DYS + δV269C | 1.65 | −2.1 | 3 |
| B14 | None | DYS + ϵV265M | 1.77 | −2.1 | 3 |
For example, for the ϵProD2-A, the observed values were f0/b0 = 102 s−1/5818 s−1 = 0.018 (Table 3), obtained using the B2 background (αDYS + βL269D) (see Table 1). E0 for just the background was 0.19 (Table 1), so ΔΔG0ϵProD2-A = −0.59 ln(0.018/0.19) = +1.4 kcal/mol. Table 3 shows ΔΔG0 values for all of the ProD2 mutants. In Fig. 4, these energy differences have been added to the WT unliganded gating free energy (+8.4 kcal/mol (2)) to give a ΔG0 value for the mutant construct.
TABLE 3.
Effect of ϵ/δProD2 mutations on unliganded gating rate and equilibrium constants
The abbreviations used are as follows: bkg, background (see Table 1); f0, observed unliganded opening rate constant (all rate constants are s−1); b0, observed unliganded closing rate constant; E0, observed unliganded gating equilibrium constant (= f0/b0). Values are mean ± S.E., n patches. ΔΔG0, unliganded gating free energy change, kcal/mol (= −0.59 ln E0obs/E0bkg). All non-zero values are positive, indicating that these mutations reduced constitutive activity.
| Mutant | bkg | Observed |
ΔΔG0 | n | ||
|---|---|---|---|---|---|---|
| f0 | b0 | E0 | ||||
| ϵProD2-L | B1 | 229 ± 17 | 5068 ± 284 | 0.045 ± 4.0E-03 | 0.0 | 5 |
| -Y | B1 | 69 ± 9 | 3100 ± 620 | 0.022 ± 2.0E-04 | 0.4 | 3 |
| -Q | B1 | 32 ± 7 | 3481 ± 451 | 0.009 ± 1.1E-03 | 1.0 | 3 |
| -C | B2 | 95 ± 8 | 2819 ± 307 | 0.034 ± 4.0E-03 | 1.1 | 5 |
| -V | B2 | 75 ± 6 | 2392 ± 272 | 0.031 ± 4.0E-03 | 1.1 | 5 |
| -T | B1 | 18 ± 5 | 2878 ± 488 | 0.006 ± 8.0E-04 | 1.2 | 3 |
| -H | B3 | 174 ± 32 | 1136 ± 83 | 0.153 ± 4.2E-02 | 1.3 | 3 |
| -R | B2 | 66 ± 11 | 3859 ± 175 | 0.017 ± 3.5E-03 | 1.4 | 4 |
| -K | B3 | 109 ± 7 | 2581 ± 108 | 0.042 ± 4.3E-03 | 2.1 | 5 |
| -G | B3 | 123 ± 6 | 3258 ± 109 | 0.038 ± 1.7E-03 | 2.2 | 4 |
| -S | B3 | 72 ± 13 | 2231 ± 238 | 0.032 ± 1.0E-02 | 2.2 | 3 |
| -A | B2 | 102 ± 30 | 5818 ± 1093 | 0.018 ± 6.0E-03 | 1.4 | 3 |
| δProD2-L | B2 | 265 ± 65 | 1359 ± 206 | 0.195 ± 1.7E-02 | 0.0 | 3 |
| -K | B1 | 155 ± 17 | 4330 ± 289 | 0.036 ± 6.0E-03 | 0.2 | 5 |
| -A | B2 | 168 ± 72 | 4945 ± 1669 | 0.034 ± 8.4E-02 | 1.0 | 3 |
| -V | B3 | 327 ± 13 | 855.3 ± 68 | 0.382 ± 4.3E-02 | 0.8 | 3 |
| -R | B2 | 123 ± 31 | 2766 ± 169 | 0.044 ± 1.4E-02 | 0.9 | 3 |
| -S | B3 | 236 ± 10 | 1240 ± 118 | 0.190 ± 1.9E-02 | 1.2 | 3 |
| -Y | B2 | 34 ± 3 | 2164 ± 455 | 0.016 ± 4.1E-02 | 1.5 | 3 |
| -C | B2 | 37 ± 1 | 2313 ± 202 | 0.016 ± 1.8E-03 | 1.5 | 2 |
| -G | B3 | 41 ± 11 | 371.3 ± 129 | 0.110 ± 6.9E-02 | 1.5 | 3 |
| -H | B3 | 70 ± 24 | 718 ± 57 | 0.097 ± 4.3E-02 | 1.6 | 3 |
| -D | B3 | 63 ± 15 | 1325 ± 50 | 0.048 ± 1.0E-02 | 2.0 | 3 |
| -T | B3 | 172 ± 26 | 4191 ± 438 | 0.041 ± 3.0E-03 | 2.1 | 6 |
| -Q | B3 | 40 ± 3 | 1821 ± 57 | 0.022 ± 1.0E-03 | 2.5 | 3 |
FIGURE 4.

Gating and binding energies of AChRs with ProD2 mutations. a, energy of unliganded gating (ΔG0). Arrow marks the WT value (+8.4 kcal/mol). In ϵ, the Ser mutation caused the largest loss in constitutive gating activity. Inset, differences in ΔG0, ϵ versus δ. b, energy from the affinity change for ACh (ΔGBACh). Arrow marks the WT value (−5.1 kcal/mol). In ϵ, the Leu mutation caused the largest reduction in binding energy. Inset, difference in ΔGBACh, ϵ versus δ. Energy losses were in general larger in ϵ. ΔΔG0 and ΔGBACh values for each ProD2 mutation are given in Tables 3 and 4.
The net ΔG0 of AChRs having all three perturbations (voltage, background mutation(s), and a ProD2 mutation) was calculated using Equation 1,
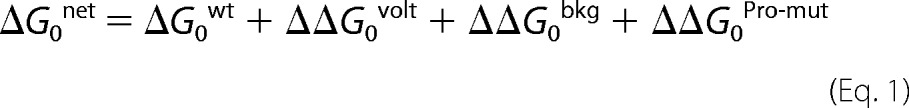 |
ΔGBACh Estimation
At low agonist concentrations, the interval durations within clusters reflect both binding and gating. To estimate E2, high [ACh] was used to eliminate delays associated with agonist binding. The membrane potential was held at +100 mV to reduce channel block. Depolarization from −100 to +100 mV decreases E0 by ∼12.5-fold or ΔΔG0+200 mV = +1.5 kcal/mol (1). To compensate for the effect of depolarization on gating, and to place the experimental rate constants into a range that is easily measured by the patch clamp, we added background mutation(s) (1). The ΔΔG0 values for these background mutations are given in Table 1. We assumed that the voltage and background mutations were energetically independent. The diliganded opening (f2) and closing rate constants (b2) of the construct were measured using either 30 mm ACh (∼180 times larger than KdWT) or 100 mm ACh. The cluster Po did not change with this increase in [ACh], signifying that the binding delays had been eliminated. Using the observed rate constant, we calculated E2 = f2/b2, and ΔG2ACh (kcal/mol) = −0.59 lnE2 (Table 4).
TABLE 4.
Effect of ϵ/δProD1 and ProD2 mutations on diliganded gating rate and equilibrium constants and ΔGBAch
The abbreviations are as follows: bkg, background (see Table 1); f2, diliganded opening rate constant (all rate constants are observed and at s−1); b2, diliganded closing rate constant; E2, diliganded gating equilibrium constant (= f2/b2); ΔG2, diliganded free energy change (= −0.59 lnE2); ΔG0net, net unliganded gating free energy (see Equation 1); ΔGB, energy from the affinity change for ACh (see Equation 3). Values are mean ± S.E., n patches.
| Mutant | bkg | Observed |
ΔG2 | ΔG0net | ΔGB | n | ||
|---|---|---|---|---|---|---|---|---|
| f2 | b2 | E2 | ||||||
| ϵProD2-A | B0+B4 | 5459 ± 118 | 3321 ± 55 | 1.60 ± 0.4 | −0.3 ± 0.0 | 11.1 ± 0.3 | −6.3 ± 0.3 | 2 |
| -V | B0+B4 | 5111 ± 283 | 2920 ± 452 | 1.75 ± 0.5 | −0.3 ± 0.1 | 9.6 ± 0.2 | −4.8 ± 0.2 | 3 |
| -S | B0+B4 | 2809 ± 134 | 3701 ± 121 | 0.83 ± 0.011 | 0.1 ± 0.0 | 10.8 ± 0.2 | −5.5 ± 0.2 | 3 |
| -C | B0+B4 | 1506 ± 47 | 2042 ± 26 | 0.74 ± 0.05 | 0.2 ± 0.0 | 9.5 ± 0.2 | −4.2 ± 0.2 | 2 |
| -T | B0+B4 | 2339 ± 331 | 3915 ± 602 | 0.6 ± 0.1 | 0.3 ± 0.1 | 9.7 ± 0.3 | −4.3 ± 0.3 | 3 |
| -D | B0+B4 | 834 ± 89 | 1760 ± 300 | 0.47 ± 0.08 | 0.4 ± 0.1 | 3 | ||
| -K | B0+B4 | 561 ± 25 | 3491 ± 321 | 0.16 ± 0.02 | 1.1 ± 0.1 | 10.6 ± 0.2 | −4.4 ± 0.2 | 3 |
| -L | B0+B4 | 326 ± 30 | 4639 ± 420 | 0.07 ± 0.008 | 1.6 ± 0.1 | 8.5 ± 0.2 | −1.9 ± 0.2 | 3 |
| -Q | B0+B4 | 276 ± 27 | 4178 ± 499 | 0.07 ± 0.007 | 1.6 ± 0.1 | 9.5 ± 0.3 | −2.8 ± 0.3 | 4 |
| -Y | B0+B4 | 84 ± 8 | 1752 ± 279 | 0.05 ± 0.01 | 1.8 ± 0.1 | 7.8 ± 0.2 | −0.9 ± 0.3 | 3 |
| -H | B0+B5 | 216 ± 2 | 1159 ± 44 | 0.19 ± 0.03 | 1.0 ± 0.0 | 8.7 ± 0.2 | −2.6 ± 0.2 | 4 |
| -G | B0+B5 | 149 ± 21 | 2086 ± 294 | 0.07 ± 0.006 | 1.6 ± 0.1 | 9.6 ± 0.2 | −2.9 ± 0.2 | 3 |
| -R | B0+B5 | 211 ± 38 | 4175 ± 356 | 0.05 ± 0.009 | 1.8 ± 0.1 | 8.8 ± 0.2 | −1.9 ± 0.3 | 4 |
| δProD2-C | B0+B6 | 1522 ± 76 | 5850 ± 572 | 0.26 ± 0.01 | 0.8 ± 0.1 | 10.8 ± 0.2 | −4.9 ± 0.2 | 3 |
| -V | B0+B6 | 1366 ± 149 | 7387 ± 247 | 0.19 ± 0.02 | 1.0 ± 0.1 | 10.1 ± 0.2 | −4.0 ± 0.2 | 3 |
| -A | B0+B6 | 1080 ± 170 | 10,610 ± 935 | 0.1 ± 0.01 | 1.4 ± 0.1 | 10.3 ± 0.4 | −3.9 ± 0.4 | 3 |
| -Y | B0+B6 | 2163 ± 199 | 899 ± 185 | 2.6 ± 0.7 | −0.6 ± 0.1 | 10.8 ± 0.2 | −6.3 ± 0.3 | 3 |
| -T | B0+B6 | 2451 ± 39 | 1271 ± 114 | 1.9 ± 0.14 | −0.4 ± 0.1 | 11.4 ± 0.2 | −6.7 ± 0.2 | 4 |
| -H | B0+B6 | 1015 ± 29 | 943 ± 60 | 1.1 ± 0.03 | −0.1 ± 0.0 | 10.9 ± 0.3 | −5.9 ± 0.3 | 3 |
| -S | B0+B6 | 225 ± 82 | 7449 ± 630 | 0.03 ± 0.01 | 2.1 ± 0.2 | 10.5 ± 0.2 | −3.3 ± 0.3 | 4 |
| -M | B0+B4 | 2572 ± 187 | 3061 ± 373 | 0.87 ± 0.07 | 0.1 ± 0.1 | 2 | ||
| -L | B0+B6 | 289 ± 32 | 9696 ± 129 | 0.03 ± 0.003 | 2.1 ± 0.1 | 9.3 ± 0.3 | −2.1 ± 0.3 | 3 |
| -K | B0+B5 | 5409 ± 290 | 1414 ± 95 | 3.9 ± 0.4 | −0.8 ± 0.1 | 7.6 ± 0.2 | −3.3 ± 0.2 | 4 |
| -Q | B0+B4 | 685 ± 126 | 1183 ± 23 | 0.58 ± 0.1 | 0.3 ± 0.1 | 11.0 ± 0.2 | −5.5 ± 0.2 | 2 |
| -G | B0+B4 | 432 ± 59 | 3239 ± 555 | 0.15 ± 0.04 | 1.1 ± 0.1 | 10.0 ± 0.3 | −3.8 ± 0.4 | 3 |
| -D | B0+B4 | 252 ± 12 | 1419 ± 115 | 0.19 ± 0.02 | 1.0 ± 0.1 | 10.5 ± 0.2 | −4.4 ± 0.3 | 3 |
| -R | B0+B5 | 269 ± 51 | 3007 ± 187 | 0.09 ± 0.003 | 1.4 ± 0.1 | 8.3 ± 0.3 | −1.8 ± 0.3 | 4 |
| ϵProD1-A | B0+B6 | 817 ± 34 | 6867 ± 365 | 0.12 ± 0.012 | 1.3 | 3 | ||
| -F | B0+B6 | 1570 ± 314 | 4237 ± 446 | 0.37 ± 0.064 | 0.6 | 3 | ||
| -L | B0+B6 | 1308 ± 132 | 6449 ± 554 | 0.20 ± 0.005 | 0.9 | 3 | ||
| -R | B0+B6 | 1259 ± 60 | 3203 ± 64 | 0.39 ± 0.012 | 0.6 | 3 | ||
| δProD1-A | B0+B6 | 1504 ± 39 | 5064 ± 205 | 0.3 ± 0.01 | 0.7 | 3 | ||
| -F | B0+B6 | 2170 ± 457 | 3592 ± 824 | 0.6 ± 0.03 | 0.3 | 3 | ||
| -L | B0+B6 | 1072 ± 162 | 3175 ± 149 | 0.3 ± 0.04 | 0.7 | 3 | ||
| -R | B0+B6 | 1776 ± 175 | 4516 ± 443 | 0.4 ± 0.02 | 0.5 | 3 | ||
The difference in binding energy, higher versus lower affinity, is an energy source that increases the channel open probability. We call this energy difference at each transmitter-binding site ΔGB1 (α-ϵ site) and ΔGB2 (α-δ site). From detailed balance, we get Equation 2,
In the experiments described below, ACh was the only agonist used to activate the AChRs. Studies of mono-liganded gating indicate that in WT adult mouse AChRs, the energy from the neurotransmitter is approximately −5.1 kcal/mol at each site (ΔGB1ACh ≈ ΔGB2ACh) (20). In AChRs having a substitution of just one ProD2 (at either α-ϵ or α-δ), the energy from the affinity change at the mutated binding site is as shown in Equation 3,
For example, for the ϵProD-R mutation, the measured f2/b2 was 211 s−1/4175 s−1, or E2obs = 0.05 (+100 mV, αC418Y background; Table 4). Taking the natural log and multiplying by −0.59, we calculate ΔG2ACh = +1.8 kcal/mol. The ΔG0net (Equation 1) for this background was +8.4(WT) + 1.5(+100 mV) − 2.5(αC418Y) + 1.4(ProD2-R; Table 3) = +8.8 kcal/mol. From Equation 3, for ϵProD2-R ΔGBACh = 1.8–8.8 + 5.1 = −1.9 kcal/mol (Table 4).
Error Estimates
The error limits for E0 and E2 are given in Tables 3 and 4 and were calculated from the forward/backward rate constant ratio measured for each patch. The errors in ΔG were estimated as sΔG = 0.59(sE/E)2, where sE is the S.E. of the equilibrium constant. We then estimated the error in ΔG0net (Equation 1) as sΔG0net = ¯√((sΔG0WT)2 + (sΔΔG0Pro-mut)2) using sΔG0WT = 0.2 kcal/mol (2). We did not have an estimate for the error associated with depolarization, so we assumed it to be negligible. ΔGBACh, WT = −5.1 + 0.02 kcal/mol (1), so total error associated with ΔGBACh, mut is sΔGB = ¯√((sΔG2WT)2 + (sΔG0net)2 + (0.02)2) (see Equation 3). These errors are shown for each mutant in Table 4.
Coupling Energy Estimation
ΔG0 and ΔGBACh were estimated for single- and double-mutant constructs, as described above. For unliganded gating, the coupling free energy was estimated as ΔG0(observed) − ΔG0(predicted), where ΔG0(predicted) is the sum of the ΔG0 values of each mutation alone.
For example, for the ϵProD-S and αGlyB1-S combination E0 = 0.016 (Table 5), so ΔG0 = +2.4 kcal/mol. This result was obtained using the B13 background (ΔG0 = −0.3 kcal/mol; Table 1), so the mutation-only ΔG0(observed) = +2.4 −(−0.3) = +2.7 kcal/mol. The ΔG0 values for each mutation alone were +1.2 kcal/mol (Table 3) and +2.2 kcal/mol (21); hence, ΔG0(predicted) = +3.4 kcal/mol. Thus, coupling free energy for unliganded gating in the ϵProD-S + αGlyB1-S pair was 2.7–3.4 = −0.7 kcal/mol (Table 5).
TABLE 5.
Interaction energies, ΔG0
The abbreviations used are as follows: m1, mutant 1;m2, mutant 2; f0, unliganded opening rate constant (all rate constants are observed (Obs) and at s−1); b0, unliganded closing rate constant; E0, unliganded gating equilibrium constant (= f0/b0). Values are mean ± S.E. from ≥3 patches. All energies are in kcal/mol. ΔG0m1+m2+bkg = −0.59 lnE0obs; ΔG0bkg = −0.59 lnE0app) (see Table 1); ΔΔG0dbl (observed) = ΔG0m1+m2+bkg − ΔG0bkg; ΔG0mut predicted (Pred), sum of individual mutations ΔG0 values (Table 3 or Ref. 21 for αGlyB1 and -2). Coupling energy, ΔΔG0dbl(observed) − ΔΔG0dbl(predicted).
| m1 | m2 | bkg | f0 | b0 | E0 | ΔG0m1+m2+bkg | ΔG0bkg | ΔΔG0dbl |
Coupling energy | |
|---|---|---|---|---|---|---|---|---|---|---|
| Obs | Pred | |||||||||
| ϵProD2-S | αGlyB1-S | B13 | 61 ± 6 | 3932 ± 476 | 0.016 ± 0.003 | 2.4 | −0.3 | 2.75 | 3.4 | −0.7 |
| ϵProD2-A | αGlyB1-A | B13 | 177 ± 111 | 2608 ± 199 | 0.068 ± 0.001 | 1.6 | −0.3 | 1.88 | 2.8 | −0.9 |
| δProD2-S | αGlyB1-S | B14 | 218 ± 22 | 7017 ± 138 | 0.031 ± 0.002 | 2.0 | −0.3 | 2.39 | 2.4 | 0.0 |
| δProD2-A | αGlyB1-A | B14 | 217 ± 16 | 7306 ± 372 | 0.030 ± 0.002 | 2.1 | −0.3 | 2.41 | 2.4 | 0.0 |
| δProD2-S | αGlyB2-S | B1 | 237 ± 32 | 2118 ± 78 | 0.112 ± 0.01 | 1.3 | 1.8 | -0.51 | −0.8 | 0.2 |
| δProD2-A | αGlyB2-A | B1 | 307 ± - | 1824 ± - | 0.168 ± - | 1.1 | 1.8 | -0.75 | −1.4 | 0.6 |
| ϵProD2-S | δProD2-S | B4 | 53 ± 3 | 1476 ± 69 | 0.036 ± 0.003 | 2.0. | −1.4 | 3.39 | 3.5 | −0.1 |
| ϵProD2-A | δProD2-A | B4 | 273 ± 477 | 1110 ± 20 | 0.246 ± 0.04 | 0.8 | −1.4 | 2.26 | 2.5 | −0.2 |
To calculate the ΔGB coupling energy for the ϵ/δProD2 and αGlyB pairs, we first estimated the observed total energy from ACh at two binding sites as shown in Equation 4,
The predicted total ΔGBACh energy is the sum of the energies from the two binding sites. One of the binding sites had only the αGlyB mutation, and this energy is known (21), ΔGB2GlyB. The other binding site had both the ProD2 mutation and the αGlyB mutation, with ΔΔGBACh values for each having been measured separately. Assuming independence, we achieve Equation 5,
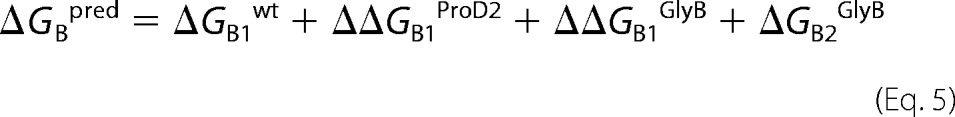 |
For example, for the same mutant pair discussed above, E2ACh = 0.005 or ΔG2ACh = +3.1 kcal/mol (Table 6). This was obtained using the B5 + B0 background, so the net ΔG0 (Equation 1) was +8.4(WT) + 1.5 (+100 mV) − 5.2(αY127F + αS269I) + 2.7(double mutant) = +7.4 kcal/mol (Table 6). The observed total energy from ACh at two binding sites (Equation 4) was −4.4 kcal/mol. The predicted total energy (Equation 5) was −5.1(WT) −0.4(ϵProD2-S) + 1.7(αGlyB1-S) − 3.3(αGlyB1-S) = −7.1 kcal/mol (Table 6). We can now compute the ΔGBACh coupling free energy for the ϵProD-S and GlyB1S pair as −4.4−(−7.1) = +2.7 kcal/mol. We assume that the coupling energy is between the GlyB1 residue that is close to the mutated ProD2 residue, rather than the GlyB2 residue at the other transmitter-binding site.
TABLE 6.
Interaction energies, ΔGBACh
The abbreviations used are as follows: m1, mutant 1;m2, mutant 2; f2, diliganded opening rate constant (all rate constant are observed and at s−1); b2, diliganded closing rate constant; E2, diliganded gating equilibrium constant (= f2/b2). Values are mean ± S.E. from ≥3 patches. All energies are in kcal/mol. ΔG2m1+m2+bkg = −0.59 ln(E2); ΔG0net, net unliganded free energy (see Equation 1). ΔGB1 + ΔGB2 (observed) = ΔG2m1+m2+bkg − ΔG0net. ΔGB1 + ΔGB2 (predicted) = ΔGB1WT + ΔΔGB1m1 + ΔΔGB1m2 + ΔΔGB2m2 (see Equation 5 and “Experimental Procedures”). The ΔGBm2 values are from either Table 4 (ProD2) or see Ref. 21 (αGlyB1 and -2). Coupling energy, ΔGB1+ΔGB2 (observed) − ΔGB1 + ΔGB2 (predicted).
| m1 | M2 | bkg | f2 | b2 | E2 | ΔG2m1+m2+bkg | ΔG0net | ΔGB]1+Δ GB]2 |
Coupling energy | |
|---|---|---|---|---|---|---|---|---|---|---|
| Obs | Pred | |||||||||
| ϵProD2-S | αGlyB1-S | B5+B0 | 35 ± 1 | 6597 ± 157 | 0.005 ± 0.0001 | 3.1 | 7.4 | −4.4 | −7.1 | 2.7 |
| ϵProD2-A | αGlyB1-A | B5+B0 | 25 ± 5 | 5286 ± 686 | 0.005 ± 0.002 | 3.1 | 6.6 | −3.4 | −6.0 | 2.6 |
| δProD2-S | αGlyB1-S | B11+B0 | 385 ± 17 | 3274 ± 284 | 0.12 ± 0.016 | 1.3 | 6.5 | −5.2 | −5.9 | 0.7 |
| δProD2-A | αGlyB1-A | B11 | 57 ± 13 | 2181 ± 164 | 0.026 ± 0.004 | 2.2 | 7.1 | −5.0 | −6.3 | 1.4 |
| δProD2-S | αGlyB2-S | B6+B0 | 2068 ± 83 | 4908 ± 186 | 0.42 ± 0.01 | 0.5 | 10.0 | −9.5 | −8.3 | −1.1 |
| δProD2-A | αGlyB2-A | B12 | 47 ± 1 | 7474 ± 848 | 0.006 ± 0.0005 | 3.0 | 12.8 | −9.8 | -10.3 | 0.5 |
| ϵProD2-S | δProD2-S | B8+B0 | 2000 ± 197 | 983 ± 112 | 2.04 ± 0.014 | −0.4 | 8.7 | −9.1 | −9.8 | 0.7 |
| ϵProD2-A | δProD2-A | B10+B0 | 249 ± 18 | 1155 ± 120 | 0.22 ± 0.013 | 0.9 | 11.2 | −10.3 | −9.9 | −0.4 |
Kd Estimation
The low affinity ACh association (kon) and dissociation (koff) rate constants for ϵProD2-L were estimated by fitting globally intra-cluster open and shut interval durations obtained at three different ACh concentrations (Fig. 3d). Because the leucine substitution influences only the α-ϵ-binding site, a model having two nonequivalent binding sites was used to fit the interval durations (Fig. 2b). The background mutation was αC418Y (in αM4), and the membrane potential was +100 mV. f2 was fixed to the value determined at 30 mm ACh, and one association and the corresponding dissociation rate constant were fixed to the wild-type values. Three free parameters were optimized as follows: k+, k−, and b2 (Table 2). The Kd value was calculated as the ratio k−/k+.
FIGURE 3.

CMS mutation ϵProD2-L. a, unliganded openings (no agonist) at low time resolution (−100 mV). Each cluster of openings (downward; displayed at 2 kHz filtering) arises from the activity of one AChR. Silent periods between clusters are when all AChRs in the patch are desensitized. B1 is the background (Table 1). b, ϵProD2-L had no effect on cluster Po in the absence of agonists (left, −100 mV) but a large inhibitory effect on diliganded gating (right, +100 mV). c, with ϵProD2-L, the effective opening rate asymptotes at ∼30 mm ACh, signifying saturation of the binding sites (+100 mV, background B8; inset, example clusters). d, left, interval duration histograms (background, B9). Solid lines calculated from the rate constants estimated by a global cross-concentration fit by the two binding site scheme (Table 2). Right, top, example of single-channel currents at different [ACh]. Bottom, fold-changes in the binding and gating equilibrium constants (WT/mutant) as follows: E0, E2, unliganded, and diliganded gating equilibrium constants; Ka, Ja, low and high affinity equilibrium association constants. e, example clusters from AChRs with a ProD2-L substitution in the δ subunit. There was little effect on unliganded gating (left, −100 mV) and a smaller effect on diliganded gating (right, +100 mV) compared with the ϵ subunit (see b). For all panels, background constructs are given in Table 1.
TABLE 2.
Rate and equilibrium constants for wt and ϵProD2-L (ACh)
The abbreviations used are as follows: f0, unliganded opening rate constant; b0, unliganded closing rate constant; E0, unliganded gating equilibrium constant (= f0/b0); f2, diliganded opening rate constant; b2, diliganded closing rate constant; E2, diliganded gating equilibrium constant (= f2/b2); k+, low affinity ACh association rate constant; k−, low affinity ACh dissociation rate constant; Kd, low affinity equilibrium dissociation constant (= k−/k+); Jd, calculated high affinity equilibrium dissociation constant. Values estimated by cross-concentration fitting (mean ± S.D.): 100, 200, and 500 μm (one patch at each [ACh]; 16,400 intervals total). WT values are from Ref. 3 (f0, b0, and E0), Ref. 1 (f2, b2, and E2), and Ref. 26 (k+, k−, and Kd).
| WT | ϵProD2-L | |
|---|---|---|
| f0a (s−1) | 187 | 229 ± 17 |
| b0a (s−1) | 3994 | 5068 ± 284 |
| E0a | 0.047 | 0.046 ± 0.004 |
| f2b (s−1) | 65,850 | 245 ± 22 |
| b2b (s−1) | 2595 | 2962 ± 268 |
| E2b | 25.4 | 0.08 ± 0.008 |
| k+ (μm−1s−1) | 106 | 6.0 ± 1.5 |
| k− (s−1) | 17,614 | 3049 ± 775 |
| Kd (μm) | 166 | 508 ± 181 |
| Jd(μm) | 0.028 | 27- |
| Kd/Jd | 6024 | 19- |
a The observed values used the DYS background.
b The WT values are after correction for the background mutation (αV283W) and depolarization.
One-site AChRs
The apparent forward rate constant (f1) and an apparent backward (b1) rate constant were quantified in AChRs having only one functional binding, using 500 μm ACh, −100 mV, and either of two different background mutations (αS269I and αP272A). Because the WT-binding site was not saturated at this [ACh], f1 was less than the true opening rate constant by the factor ([ACh]/Kd)/(1 + [ACh]/Kd) = 0.75 (Kd = 166 μm). Likewise, b1 was less than the true channel closing rate constant because of channel block by the factor 1/(1 + [ACh]/KB), where KB is the equilibrium dissociation constant for channel block by ACh (∼1.2 mm at −100 mV). These two effects cancel, so E2ACh, −100 mV = f1/b1, and ΔG1ACh = −0.59 ln(E1) −ΔΔG0bkg (Table 7).
TABLE 7.
Mono-ligand gating rate and equilibrium (ACh)
The abbreviations used are as follows: m1, mutant 1;m2, mutant 2; f2, diliganded opening rate constant (all rate constant are observed and at s−1); b2, diliganded closing rate constant; E2, diliganded gating equilibrium constant (= f2/b2). Values are mean ± S.E. from ≥3 patches. All energies are in kcal/mol. ΔG2m1+m2+bkg = −0.59 ln(E2); ΔG0net, net unliganded free energy (see Equation 1). ΔGB1 + ΔGB2 (observed) = ΔG2m1+m2+bkg-ΔG0net. ΔGB1+ ΔGB2 (predicted) = ΔGB1WT + ΔΔGB1m1 + ΔΔGB1m2 + ΔΔGB2m2 (see Equation 5 and see “Experimental Procedures”). The ΔGBm2 values are from either Table 4 (ProD2) or Ref. 21 (αGlyB1 and -2). Coupling energy, ΔGB1 + ΔGB2 (observed) − ΔGB1 + ΔGB2 (predicted).
| Construct | f1 | b1 | E1 | ΔG1 | ΔG0net | ΔGB | n |
|---|---|---|---|---|---|---|---|
| ϵProD2-R + αS269I | 76 ± 10 | 1765 ± 48 | 0.043 ± 0.008 | 1.9 | 7.0 | −5.1 | 3 |
| ϵProD2-R + αP272A | 91 ± 8 | 1549 ± 72 | 0.059 ± 0.008 | 1.7 | 6.6 | −4.9 | 3 |
| δProD2-R + αS269I | 377 ± 28 | 8078 ± 74 | 0.047 ± 0.004 | 1.8 | 6.5 | −4.7 | 3 |
| δProD2-R + αP272A | 397 ± 21 | 6172 ± 82 | 0.064 ± 0.005 | 1.6 | 6.1 | −4.5 | 2 |
RESULTS
Energy Measurements
In neuromuscular AChRs, desensitization is much slower than binding and gating, so in steady-state, single-channel recordings, openings occur in isolated clusters that are generated by the activity of just one AChR (Fig. 3a). The rate constants for agonist binding and A2C↔ A2O gating were estimated from the durations of intervals within clusters at different [ACh]. The opening/closing rate constant ratio is the gating equilibrium constant, which we measured both in the absence (E0) or presence of ACh at one (E1) or both (E2) transmitter-binding sites. The natural logs of these experimentally determined constants are proportional to the free energy differences, O versus C, in a receptor having zero (ΔG0), one (ΔG1ACh), or two (ΔG2ACh) bound ACh molecules.
The measured equilibrium constants and calculated energies pertain to the full isomerization of the AChR and not just the molecular rearrangements of the gate region that regulate ionic conductance. There are brief intermediate states between C and O (22, 23). We did not detect these directly, so the gating equilibrium constants (energies) we report are the products (sums) of those connecting these intermediates. For example, if the expanded gating model is C↔ F↔ O (where F is an undetected intermediate), then the E0 value we measure is the product of the C↔ F and F↔ O equilibrium constants, and the ΔG0 value is the sum of the energy changes for the two steps.
ΔG0 is the intrinsic free energy difference between the C and O ground states when there is only water at the binding sites (= −0.59 lnE0). Ignoring desensitization, this energy sets the minimum cluster open probability (Po), which pertains to activity in the complete absence of agonists. ΔG2ACh is the free energy difference between the ground states when ACh is present at both sites (= −0.59 lnE2). This energy sets the maximum Po. In WT AChRs under a reference condition (−100 mV, 23 °C), ΔG0 = +8.4 kcal/mol and ΔG2ACh = −1.9 kcal/mol, with minimum and maximum Po values of ∼0.0000007 and ∼0.96.
In brief, we measure E0 and E2ACh for each mutant and take the logs to compute ΔG0 and ΔG2ACh. We then use Equation 3 to estimate ΔGBACh at the single mutated binding site. Measuring E0 is an essential part of the process because mutations of binding site residues can have a significant effect on unliganded gating (24).
To estimate E0 and E2ACh, it was necessary to use background mutations and depolarization to place the gating rate constants into a measurable range (Table 1). These perturbations, alone or in combination, only changed ΔG0 and had no effect on ΔGBACh. An example analysis is provided below.
Leucine Substitutions
Fig. 3b shows unliganded and diliganded single-channel current clusters from AChRs having a ϵProD2-L substitution, the CMS mutation. The unliganded currents were recorded at a membrane potential of −100 mV, with the ϵProD2-L mutation expressed on a background construct that increased constitutive activity exclusively by reducing (making less positive) ΔG0. The E0 of unliganded clusters was approximately the same with or without the ProD2-L mutation (Table 2). This indicates that the Leu substitution did not change ΔG0. The effect of the ϵProD2 mutant on gating without agonists was ΔΔG0ProD2-L = +0.0 kcal/mol (Table 3).
Diliganded currents (30 mm ACh) were recorded at +100 mV to reduce channel block by the agonist. Relative to −100 mV, this depolarization increases the intrinsic energy of gating by ΔΔG0+200 mV = +1.5 kcal/mol (1). Depolarization shortens the open channel lifetime making it difficult to estimate accurately the channel closing rate constant, so we added a background mutation (αV283W, in M3) that slowed independently the closing rate constant. This background mutation increases E0 by ∼10-fold (ΔΔG0αV283W = −1.4 kcal/mol) (25). ΔGBACh at either binding site was not altered by voltage or the αM3 background mutation. From Equation 1, ΔG0net = +8.5 kcal/mol. E2ACh for this construct was estimated from the ratio of the forward/backward isomerization rate constants at 30 mm ACh, a concentration that fully saturates the transmitter-binding sites (Fig. 3c). The results were: 326 s−1/4639 s−1 = 0.07 (Table 2). Taking the log, we estimate that for this construct ΔG2ACh = +1.5 kcal/mol. Because we had estimates for both ΔG0net and ΔG2ACh, we could compute for the CMS mutant ΔGBACh = −1.9 kcal/mol (Equation 3; Table 4). We conclude that the CMS mutation reduces the energy from the neurotransmitter at the α-ϵ site by ∼63% (from −5.1 to −1.9 kcal/mol), or ΔΔGB1ProD2-L = +3.2 kcal/mol.
We also measured the ACh equilibrium dissociation constant for the resting low affinity conformation of the binding site (KdACh) by fitting intra-cluster current interval durations across several different concentrations (Fig. 3d). KdACh was calculated from the dissociation/association rate constant ratio (Table 2). The result was KdACh, ProD2-L ≈510 μm, which is only ∼3 times larger than at the WT α-ϵ-binding site (16, 26). Based on cluster frequency and duration, there was no qualitative effect of the ϵProD-L mutation on desensitization, either with or without ACh at the transmitter-binding sites.
Fig. 3e shows the effects of a Leu substitution at the α-δ-binding site (δProD2-L). Unliganded gating was unaffected (ΔΔG0 = 0.0 kcal/mol), and the binding energy from ACh was reduced only by ∼37% (ΔΔGB = +1.9 kcal/mol), which is about half of the effect of this mutation at the α-ϵ site (Table 4).
We also investigated the effects of a Leu substitution at ProD1 in the ϵ or δ subunit, but only with regard to the diliganded gating equilibrium constant E2ACh (Table 4). In both subunits, the reduction in E2 was much smaller at ProD1 compared with ProD2.
Other Mutations
We examined other side chain substitutions at the ProD2 position in the ϵ and δ subunits. The ΔG0 values for each binding site mutation are shown in Fig. 4a (Table 3). All of the mutations except for Leu made ΔG0 more positive (reduced constitutive activity). In ϵ, the largest changes were for Ser, Gly, and Lys substitutions (approximately +2 kcal/mol, which corresponds to an ∼30-fold reduction in E0). In δ, Gln, Thr, and Asp caused the largest increases in ΔG0 (again, by approximately +2 kcal/mol). The inset of Fig. 4a compares the effect of mutations on ΔG0 in the ϵ versus δ subunits. The biggest differences (>1.5 kcal/mol) were for Lys and Gln substitutions.
The effects of these and other ProD2 mutations on ΔGBACh are shown in Fig. 4b (Table 4). In ϵ, large reductions in ΔGBACh (>2 kcal/mol) were apparent with LRYHQG. In δ, the only large reduction was with Arg and Leu. The inset of Fig. 4b compares the effects of the various ProD2 mutations at the two binding sites with regard to ΔGBACh. In most cases, the loss in energy from ACh was larger in the ϵ subunit compared with δ. However, the Arg substitution had nearly the same effect in ϵ and δ.
We also measured the effect of an Ala, Phe, or Arg mutation on E2 (but not E0) at ProD1, at both the α-ϵ- and α-δ-binding sites (Table 4). All of the mutations reduced E2 but only to small extents (<7-fold).
Because we measured the opening and closing rate constants for each mutant, we could estimate a φ value for ProD2 in ϵ and δ (Fig. 5). φ is the slope of the rate versus equilibrium constant relationship (on a log-log scale) and gives the relative position in the gating isomerization at which the mutated side chain changes energy on a scale from 1 (early) to 0 (late). For diliganded gating, the φ value for ProD2 was high (≥0.9) in both subunits, although perhaps higher in α-ϵ compared with α-δ. This indicates that these prolines, like many other residues in the vicinity of the transmitter-binding sites, change energy relatively early, and nearly synchronously, in the opening isomerization when ACh is present (27). In the absence of agonists, the ProD2 residues at both ϵ and δ had slightly lower φ values, suggesting relatively later energy changes. Other binding site residues also show lower φ values for gating in the absence of agonists (24). Also, there was more scatter without agonists than with ACh present. Some of this variance may be from measurement noise, but some may also reflect the “catalytic” effects of the ProD2 mutations that are more apparent without ACh present.
FIGURE 5.

Rate equilibrium plots for ProD2 mutants. Φ is the slope of the log-log relationship and gives the relative position in the opening isomerization when ProD2 changes energy, on a scale from 1 (early) to 0 (late). With ACh present at the binding sites, both ϵProD2 and δProD2 change energy near the onset of channel opening (solid circles). With only water present at the binding sites, both prolines change energy somewhat later than with ACh present. Rate and equilibrium constants have been corrected for the background and are normalized to the WT value. Each symbol is the mean of ≥3 patches for one side chain substitution; Φ values are mean ± S.D.
Interactions between Residues
In the next series of experiments, we used mutant cycle analysis (28) to probe the extent to which the ProD2 residues in the ϵ and δ subunits interact energetically with each other and with two loop B glycine residues in the α subunit, αGlyB1 (αGly-147) and αGlyB2 (αGly-153) (see Fig. 1c). We chose these glycines because we were interested in the ProD2 backbone (rather than side chain) cross-subunit interactions and because they had been well characterized previously (21, 29). These two glycines have opposing effects on AChR activation, with mutations of αGlyB1 reducing and mutations of αGlyB2 increasing Po (21). We measured both E0 and E2ACh in Ser-Ser or Ala-Ala double mutant pairs, and we compared the calculated ΔG0 (Table 5) and ΔGBACh (Table 6) values with the sums for single Ser or Ala mutants. A positive interaction energy indicates that the effect of the mutant pair was greater than the sum of the energy changes generated by the individual mutations.
With regard to ϵProD2-δProD2 coupling, the unliganded ΔG0 interaction energy was small (≤0.2 kcal/mol) for both Ser and Ala mutations. With ACh present, the ΔGBACh interaction energy was slightly larger, ∼+0.7 kcal/mol for the Ser-Ser pair and −0.4 kcal/mol for the Ala-Ala pair. These energies are close to our resolution limit, so we conclude that the two distant binding-site ProD2 residues interact weakly, if at all, regardless of whether or not ACh is present.
With regard to ProD2-αGlyB1 coupling, there was only a small ΔG0 interaction at α-ϵ and none at all at α-δ, for both Ser and Ala pairs. With only water at the binding site, these residues on the primary and complementary sides of the binding pocket hardly communicate. However, the situation was different in the presence of ACh. The ΔGBACh coupling energy was substantial at α-ϵ, where ProD2 and αGlyB1 interact by approximately +2.6 kcal/mol with Ser or Ala pairs. The degree of positive interaction energy at α-ϵ indicates that the fold-change in E2ACh for the mutant pair was ∼30-fold larger than the product of the fold-changes for the individual mutations. The ΔGBACh interaction energy was smaller at the α-δ interface.
We attempted to carry out similar analyses for interaction energies for ProD2-αGlyB2 interactions at both binding sites, but we could do so only at α-δ. At α-ϵ, the ProD2 + αGlyB2 pairs (both Ser and Ala) produced unliganded clusters having a wide distribution of open probabilities. This suggests that there is some interaction between these residues in the unliganded binding site, but a clear ΔG0 value could not be estimated. The clusters for δProD2-αGlyB2 mutant pairs did not show this variance, and ΔG0 and ΔGBACh coupling estimates could be obtained (Tables 5 and 6). At α-δ, these two residues interact weakly, either with or without ACh present.
In summary, the only significant energy coupling we could measure was with regard to ΔGBACh, between ϵProD2 and αGlyB1, and only when ACh is present.
Construction of One-site AChRs
In WT AChRs, each neurotransmitter molecule increases the gating equilibrium constant by ∼6000-fold (ΔGBACh = −5.1 kcal/mol). However, with a ProD2-R mutation at either α-ϵ or α-δ, the gating equilibrium constant increases only by ∼285-fold (average ΔGBmut = −3.4 kcal/mol). We sought to use these substitutions to engineer AChRs having only one functional binding site, either α-ϵ (by using the δProD2-R knock-out) or α-δ (by using the ϵProD2-R knock-out). Although we did not measure the resting affinity of the Arg mutants, it is likely that these substitutions also increases KdACh, further lowering activation by ACh.
Fig. 6a shows single-channel activity in 500 μm ACh (∼3 times KdACh, WT) in WT, single-site, and double-site knock-outs. As expected, activity was greatly reduced when either of the two binding sites was incapacitated by the Arg substitution, and there was almost no activity in the double mutant combination. The infrequent openings apparent in the double knock-out can be attributed to the residual ΔGBACh energies at the two binding sites.
FIGURE 6.

Engineering AChRs having only one functional transmitter-binding site. a, single-channel currents from AChRs having two (top), one (middle traces), or zero (bottom) WT transmitter-binding sites. The sites were made nonfunctional by using either a ϵProD2-R or δProD2-R knock-out mutation. b, gating properties of one-site AChRs. Each panel shows a low time resolution trace, a single cluster, and interval duration histograms (500 μm ACh, −100 mV). In addition to the ProD2-R mutation, a background mutation (αS269I) was added that decreased ΔG0 to enhance cluster formation. From the gating equilibrium constants, ΔGBACh = −5.1 and −4.7 kcal/mol at the α-δ and α-ϵ transmitter-binding sites.
In the single-site knock-outs, the activity generated by the lone WT-binding site was insufficient to cause openings to occur in clusters. To allow cluster analysis, we added a distant gain-of-function background mutation that decreased ΔG0 but had no effect on either ΔGBACh or KdACh, either αS269I in M2 (ΔΔG0 = −2.8 kcal/mol (18) or αP272A in the M2-M3 linker (ΔΔG0 = −3.2 kcal/mol (30)). With either background, the gating activity of the double knock-out in 500 μm ACh was too low to generate clusters (data not shown), perhaps because binding was reduced by the two Arg substitutions.
Fig. 6b shows clusters of openings in 500 μm ACh from AChRs having just one functional WT transmitter-binding site (αS269I background). The mono-liganded shut and open intracluster interval durations apparent with ACh activating only the α-δ site (top) were described by single exponentials, so a clear estimate of E1ACh and ΔG1ACh could be obtained (+1.9 kcal/mol). Using Equation 1, we calculated a ΔG0net for each construct. For αS269I + ϵProD2R (−100 mV), ΔG0net = +8.4 − 2.8 + 1.4 = +7.0 kcal/mol. From the relationship ΔGB2ACh = ΔG1ACh − ΔG0net, we now calculate that the agonist energy from the functional α-δ site was ΔGB2ACh = +1.9 − 7.0 = −5.1 kcal/mol (Table 7).
The mono-liganded shut and open intracluster interval durations apparent with ACh activating only the α-ϵ site were each described by two exponentials, with both backgrounds (Fig. 6b, bottom panel). We used the inverse time constant of the predominant component to estimate E1ACh and ΔG1ACh = +1.8 kcal/mol. Using the method described above, we estimate that with the αS269I background the agonist energy from the functional α-ϵ site was −4.7 kcal/mol.
Using the same approaches and the αP272A background mutation, we estimate that ΔGBACh is −4.9 and −4.5 kcal/mol at the WT α-δ and α-ϵ transmitter-binding sites. The agreement between the ΔGBACh values using two backgrounds is evidence that the αS269I and αP272A mutations only change ΔG0 (and not ΔGBACh) and do not interact energetically with either ProD2-R.
DISCUSSION
CMS Mutation
The CMS mutation (ϵProD2-L) has a similar functional effect in mouse AChRs as in human AChRs, which is to reduce both the resting affinity for ACh and the diliganded gating equilibrium constant. Because we measured the effect of this mutation on ΔG0, we could also calculate its effect on ΔGB1ACh, which is the energy provided by the neurotransmitter for gating at the α-ϵ-binding site. The reduction in this energy, from −5.1 to −1.9 kcal/mol, was substantial. In effect, the CMS mutation turns the AChR from a two-site to a one-site receptor. The primary effect of many other CMS mutations is to decrease ΔG0 (31). The ϵProD2-L is an exception to this pattern because it has no effect on ΔG0 but a large one on ΔGBACh.
Because we measured both KdACh (≈510 μm) and the affinity ratio (≈19) for the CMS mutation, we could calculate, using the thermodynamic cycle (Fig. 2a), the equilibrium dissociation constant for ACh binding to the high affinity open channel conformation of the α-ϵ transmitter binding site. The estimate, Jd1ACh = 27 μm, is 1000-fold higher than the WT value of 28 nm (32). With regard to mechanism, the large reduction in the affinity of the O-conformation of the α-ϵ transmitter-binding site, a +4.1 kcal/mol loss in energy, is by far the main effect of the CMS mutation with regard to AChR activation.
Recently, evidence was presented suggesting that low and high affinity binding of agonists occurs by an integrated process called “catch-and-hold” (26). The results with ϵProD2-L indicate that this substitution has a much smaller effect on the low affinity “catch” phase (∼3-fold) than on low to high affinity “hold” (∼1000-fold). This indicates that the energy change at ϵProD2 occurs late in catch-and-hold, because most of the energy (structure) change takes place when the binding site switches from low to high affinity. Apparently, with Leu at this position, ACh can bind reasonably well with a low affinity, but a high affinity cannot be established.
The leucine substitution of ProD2 at the α-δ-binding site had a much smaller effect on ΔGBACh, and mutation of ProD1 at either binding site had very little effect. Of the side chains we examined, only the ProD2-R substitutions reduced ΔGBACh to similar extents as the leucine, at both binding sites.
Transmitter-binding Sites
So far, eight positions in the vicinity of the AChR-binding sites have been probed in detail regarding the effects of mutations on ΔG0 and ΔGBACh (see Fig. 1c). These include four aromatic amino acids in the α subunit αTyr-93 (TyrA), αTrp-149 (TrpB), αTyr-190 (TyrC1), and αTyr-198 (TyrC2), two glycines in loop B αGly-147 (GlyB1) and αGly-153 (GlyB2), a tryptophan on the complementary D surface ϵTrp-55/δTrp-57 (TrpD), and now ϵ/δProD2 (21, 24, 27, 33). In WT AChRs, most of the ΔGBACh energy comes from an “aromatic triad” composed of αTrp-149, αTyr-190, and αTyr-198 (27).
At α-ϵ, AChRs having the WT Pro or the CMS mutation Leu have the same ΔG0 value (+8.4 kcal/mol). All other substitutions increased ΔG0, with the largest increase (biggest loss of function) being for Ser, Gly, and Lys (Fig. 3a). Overall, the range of intrinsic gating energy values, smallest (WT) to largest (δProD2-Q), was <2.5 kcal/mol, which indicates that as a rule the ϵProD2 side chain does not change energy to a great extent when the unliganded binding site switches its conformation in gating. This energy range is similar to the ΔG0 range energies of some other residues at the binding site for which unliganded gating has been measured (TyrC1, TyrC2, GlyB1, TrpD, and TyrA). So far, only GlyB2 and TrpB show more substantial (≥4 kcal/mol) unliganded gating range energies (21, 24).
Large side chains can adopt alternate rotamers and, without structures, it is difficult to speculate about the structural basis of the energetic consequences of such substitutions. Although we tested many different side chains at ϵProD2, below we consider the effects on ΔGBACh for only the small amino acids GASV. Of these, at α-ϵ only the Gly substitution had a large effect on ΔGBACh, decreasing the energy from the transmitter by +2.5 kcal/mol. The other three small side chains hardly affected this energy (<+0.3 kcal/mol). The ϵProD2-Gly change in ΔGBACh is large and approximately equivalent to that observed by replacing the central loop B tryptophan (αTrp-149) with an Ala (+2.3 kcal/mol (27)). So far, for the small side chain substitutions only the mutation TyrC2-A has been shown to have a greater effect on ΔGBACh than ϵProD2-G. Recall that the Gly substitution also had a large effect on ΔG0, suggesting that the gating conformational change at ϵProD2 may be similar in unliganded and liganded conditions.
The energy coupling estimates obtained by using mutant cycle analyses were informative. There was little or no ΔG0 coupling between ϵProD2 and αGlyB1 in the absence of ACh, but with ACh present a strong ΔGBACh interaction was apparent (+2.7 kcal/mol). Although this coupling estimate does not distinguish between the two mutated αGlyB1 residues, we assume that the interaction was exclusively between ϵProD2 and the αGlyB1 at the α-ϵ site. It appears that these two residues on different sides of the binding pocket act in concert (are effectively “cross-linked”) when the binding site switches from low to high affinity, but only when ACh is present. It is noteworthy that the αGlyB1-A mutation alone decreases substantially the energy from ACh (by +2.4 kcal/mol; see Ref. 21). So far, αGlyB1 and ϵProD2 are the only binding site elements outside of the aromatic triad where GASV mutations have been found to change significantly ΔGBACh.
The mutation and coupling studies together indicate that ϵProD2 plays an important role in AChR gating. (i) ϵProD2 changes energy mainly in the low to high affinity conformational switch. (ii) Of the small amino acids, only a Gly substitution causes a large reduction in ΔGBACh. (iii) The energy changes of ϵProD2 and αGlyB1 are tightly coupled when ACh is present. Our interpretation of these results is that there is a concerted strain in the backbones at the ϵProD2 and αGlyB1 positions when the liganded binding site switches from low to high affinity. A Pro does not appear to be critical for maintaining the appropriate backbone architecture on the complementary surface because Ala, Ser, and Val all have WT-like ΔGBACh values. We speculate that when ACh is in the binding pocket, during the affinity switch a force, perhaps initiated by the movement of loop B residue αGlyB1, is applied across subunits to the ProD2 backbone. With a Gly here, the binding pocket is deformed (relative to the WT) so as to reduce the high affinity of the O conformation and, hence, the energy for gating arising from ACh.
At α-δ, the effects of ProD2 mutations were more muted than at α-ϵ. The ΔG0 and ΔGBACh energy changes with a Gly were about half those at α-ϵ. Also, there was less apparent δProD2-αGlyB1 coupling with ACh present. This highlights that the two AChR binding sites are different even though they supply about the same ΔGBACh energies for gating. Further evidence is that the YQH substitutions had large effects at α-ϵ but only small effects at α-δ. The reduction in agonist energy consequent to these larger amino acid substitutions (including the CMS mutation) may not be from a change in the ϵ/δ backbone but rather from unfavorable interactions of the larger side chains with other structural elements at the binding site. Still, the ProD2-G substitution at α-δ had the largest effect on ΔGBACh among the small side chains, so perhaps the above hypothesis of a backbone strain here applies to α-δ as well as α-ϵ.
The loss of agonist energy is probably not from unfavorable direct interactions between the ProD2 backbone and the neurotransmitter. Rather, it may be that a puckering of the complementary subunit backbone in the low to high affinity rearrangement affects JdACh indirectly, for example by generating an overall shape of the pocket that is sub-optimal for establishing a high affinity from one or more elements of the aromatic triad. Our understanding of the AChR transmitter-binding sites is in its infancy. It will be interesting to learn the magnitudes of the ligand energy arising from the aromatic triad in the ϵProD2-G mutant, and whether ϵProD2 is coupled energetically to other residues at the α-ϵ-binding site.
Although the ϵProD2-G substitution had a large effect on both ΔG0 and ΔGBACh, the quantitative effects of the substitutions were different with water versus ACh present in the binding site. For example, the Ser substitution reduced unliganded gating but had little effect on ΔGBACh, with the opposite result for the Leu substitution. This suggests that the conformational changes at the binding site are not identical without versus with ACh present. The lower φ values for unliganded gating, and the absence of energy coupling between ProD2 and αGlyB1 in water-only, support this hypothesis. The thermodynamic cycle is useful for estimating energies, but it is only an approximation. Although most residue energy changes in many regions of the AChR are approximately the same without versus with ligands (3, 34), it appears that the structural changes of the few residues that provide ΔGBACh energy are different in the two conditions.
Engineering
Using the single-site knock-outs (ϵ-δ), we confirmed the previous finding that each binding site provides approximately the same ΔGBACh energy, but our measurements are not sufficiently precise to allow us to distinguish −5.1 (α-δ) versus −4.7 kcal/mol (α-ϵ) (values obtained using the αS269I background). The sources of this energy, and the net binding energy from agonists other than ACh and choline, have not been measured at the two sites separately. However, the observation that there is little if any communication between the ProD2 side chains α-ϵ and α-δ suggests that the binding sites operate almost independently.
The knock-outs were not perfect because there was a residual ΔGBACh energy (approximately −1.7 kcal/mol) with the Arg substitution. However, we have demonstrated that by using [ACh] that causes a high occupancy probability of the WT-binding sites, it is possible to study AChRs that have only one functional binding site, either α-ϵ or α-δ. This ability to engineer single-site AChRs may prove valuable in probing further the differences between the two transmitter-binding sites.
Acknowledgments
We thank M. Merritt, M. Shero, and M. Teeling for technical assistance.
This work was supported, in whole or in part, by National Institutes of Health Grants NS-23513 and NS-064969.
- ACh
- acetylcholine
- AChR
- acetylcholine receptor
- CMS
- congenital myasthenic syndrome.
REFERENCES
- 1. Jadey S. V., Purohit P., Bruhova I., Gregg T. M., Auerbach A. (2011) Design and control of acetylcholine receptor conformational change. Proc. Natl. Acad. Sci. U.S.A. 108, 4328–4333 [DOI] [PMC free article] [PubMed] [Google Scholar]
- 2. Nayak T. K., Purohit P. G., Auerbach A. (2012) The intrinsic energy of the gating isomerization of a neuromuscular acetylcholine receptor channel. J. Gen. Physiol. 139, 349–358 [DOI] [PMC free article] [PubMed] [Google Scholar]
- 3. Purohit P., Auerbach A. (2009) Unliganded gating of acetylcholine receptor channels. Proc. Natl. Acad. Sci. U.S.A. 106, 115–120 [DOI] [PMC free article] [PubMed] [Google Scholar]
- 4. Auerbach A. (2010) The gating isomerization of neuromuscular acetylcholine receptors. J. Physiol. 588, 573–586 [DOI] [PMC free article] [PubMed] [Google Scholar]
- 5. Lester H. A., Dibas M. I., Dahan D. S., Leite J. F., Dougherty D. A. (2004) Cys-loop receptors: new twists and turns. Trends Neurosci. 27, 329–336 [DOI] [PubMed] [Google Scholar]
- 6. Sine S. M., Engel A. G. (2006) Recent advances in Cys-loop receptor structure and function. Nature 440, 448–455 [DOI] [PubMed] [Google Scholar]
- 7. Celie P. H., van Rossum-Fikkert S. E., van Dijk W. J., Brejc K., Smit A. B., Sixma T. K. (2004) Nicotine and carbamylcholine binding to nicotinic acetylcholine receptors as studied in AChBP crystal structures. Neuron 41, 907–914 [DOI] [PubMed] [Google Scholar]
- 8. Ohno K., Wang H. L., Milone M., Bren N., Brengman J. M., Nakano S., Quiram P., Pruitt J. N., Sine S. M., Engel A. G. (1996) Congenital myasthenic syndrome caused by decreased agonist binding affinity due to a mutation in the acetylcholine receptor ϵ subunit. Neuron 17, 157–170 [DOI] [PubMed] [Google Scholar]
- 9. Peter C., Korngreen A., Witzemann V. (2005) Mutation of single murine acetylcholine receptor subunits reveals differential contribution of P121 to acetylcholine binding and channel opening. Pflugers Arch. 450, 178–184 [DOI] [PubMed] [Google Scholar]
- 10. Qin F. (2004) Restoration of single-channel currents using the segmental k-means method based on hidden Markov modeling. Biophys. J. 86, 1488–1501 [DOI] [PMC free article] [PubMed] [Google Scholar]
- 11. Qin F., Auerbach A., Sachs F. (1997) Maximum likelihood estimation of aggregated Markov processes. Proc. Biol. Sci. 264, 375–383 [DOI] [PMC free article] [PubMed] [Google Scholar]
- 12. Qin F., Auerbach A., Sachs F. (1996) Estimating single-channel kinetic parameters from idealized patch-clamp data containing missed events. Biophys. J. 70, 264–280 [DOI] [PMC free article] [PubMed] [Google Scholar]
- 13. Auerbach A. (2013) The energy and work of a ligand-gated ion channel. J. Mol. Biol., in press [DOI] [PMC free article] [PubMed] [Google Scholar]
- 14. Karlin A. (1967) On the application of “a plausible model” of allosteric proteins to the receptor for acetylcholine. J. Theor. Biol. 16, 306–320 [DOI] [PubMed] [Google Scholar]
- 15. Monod J., Wyman J., Changeux J. P. (1965) On the nature of allosteric transitions: a plausible model. J. Mol. Biol. 12, 88–118 [DOI] [PubMed] [Google Scholar]
- 16. Chakrapani S., Bailey T. D., Auerbach A. (2003) The role of loop 5 in acetylcholine receptor channel gating. J. Gen. Physiol. 122, 521–539 [DOI] [PMC free article] [PubMed] [Google Scholar]
- 17. Mitra A., Bailey T. D., Auerbach A. L. (2004) Structural dynamics of the M4 transmembrane segment during acetylcholine receptor gating. Structure 12, 1909–1918 [DOI] [PubMed] [Google Scholar]
- 18. Mitra A., Cymes G. D., Auerbach A. (2005) Dynamics of the acetylcholine receptor pore at the gating transition state. Proc. Natl. Acad. Sci. U.S.A. 102, 15069–15074 [DOI] [PMC free article] [PubMed] [Google Scholar]
- 19. Purohit P., Auerbach A. (2007) Acetylcholine receptor gating: movement in the α-subunit extracellular domain. J. Gen. Physiol. 130, 569–579 [DOI] [PMC free article] [PubMed] [Google Scholar]
- 20. Jha A., Auerbach A. (2010) Acetylcholine receptor channels activated by a single agonist molecule. Biophys. J. 98, 1840–1846 [DOI] [PMC free article] [PubMed] [Google Scholar]
- 21. Purohit P., Auerbach A. (2011) Glycine hinges with opposing actions at the acetylcholine receptor-channel transmitter-binding site. Mol. Pharmacol. 79, 351–359 [DOI] [PMC free article] [PubMed] [Google Scholar]
- 22. Auerbach A. (2005) Gating of acetylcholine receptor channels: Brownian motion across a broad transition state. Proc. Natl. Acad. Sci. U.S.A. 102, 1408–1412 [DOI] [PMC free article] [PubMed] [Google Scholar]
- 23. Lape R., Colquhoun D., Sivilotti L. G. (2008) On the nature of partial agonism in the nicotinic receptor superfamily. Nature 454, 722–727 [DOI] [PMC free article] [PubMed] [Google Scholar]
- 24. Purohit P., Auerbach A. (2010) Energetics of gating at the apo-acetylcholine receptor transmitter-binding site. J. Gen. Physiol. 135, 321–331 [DOI] [PMC free article] [PubMed] [Google Scholar]
- 25. Cadugan D. J., Auerbach A. (2007) Conformational dynamics of the αM3 transmembrane helix during acetylcholine receptor channel gating. Biophys. J. 93, 859–865 [DOI] [PMC free article] [PubMed] [Google Scholar]
- 26. Jadey S., Auerbach A. (2012) An integrated catch-and-hold mechanism activates nicotinic acetylcholine receptors. J. Gen. Physiol. 140, 17–28 [DOI] [PMC free article] [PubMed] [Google Scholar]
- 27. Purohit P., Bruhova I., Auerbach A. (2012) Sources of energy for gating by neurotransmitters in acetylcholine receptor channels. Proc. Natl. Acad. Sci. U.S.A. 109, 9384–9389 [DOI] [PMC free article] [PubMed] [Google Scholar]
- 28. Horovitz A., Fersht A. R. (1990) Strategy for analysing the co-operativity of intramolecular interactions in peptides and proteins. J. Mol. Biol. 214, 613–617 [DOI] [PubMed] [Google Scholar]
- 29. Jadey S., Purohit P., Auerbach A. (2013) Action of nicotine and analogs on acetylcholine receptors having mutations of transmitter-binding site residue αG153. J. Gen. Physiol. 141, 95–104 [DOI] [PMC free article] [PubMed] [Google Scholar]
- 30. Jha A., Cadugan D. J., Purohit P., Auerbach A. (2007) Acetylcholine receptor gating at extracellular transmembrane domain interface: the Cys-loop and M2-M3 linker. J. Gen. Physiol. 130, 547–558 [DOI] [PMC free article] [PubMed] [Google Scholar]
- 31. Zhou M., Engel A. G., Auerbach A. (1999) Serum choline activates mutant acetylcholine receptors that cause slow channel congenital myasthenic syndromes. Proc. Natl. Acad. Sci. U.S.A. 96, 10466–10471 [DOI] [PMC free article] [PubMed] [Google Scholar]
- 32. Grosman C., Auerbach A. (2001) The dissociation of acetylcholine from open nicotinic receptor channels. Proc. Natl. Acad. Sci. U.S.A. 98, 14102–14107 [DOI] [PMC free article] [PubMed] [Google Scholar]
- 33. Bafna P. A., Jha A., Auerbach A. (2009) Aromatic residues ϵTrp-55 and δTrp-57 and the activation of acetylcholine receptor channels. J. Biol. Chem. 284, 8582–8588 [DOI] [PMC free article] [PubMed] [Google Scholar]
- 34. Gupta S., Auerbach A. (2011) Mapping heat exchange in an allosteric protein. Biophys. J. 100, 904–911 [DOI] [PMC free article] [PubMed] [Google Scholar]
- 35. Unwin N. (2005) Refined structure of the nicotinic acetylcholine receptor at 4A resolution. J. Mol. Biol. 346, 967–989 [DOI] [PubMed] [Google Scholar]