

Background: Calmodulin and calcium-binding protein 1 (CaBP1) oppositely regulate inactivation of CaV1.2 channels.
Results: Quantitative titration of purified proteins in intact cells suggests competition between CaM and CaBP1 for the CaV1.2 C terminus and an additional non-competitive action of CaBP1.
Conclusion: CaBP1 counteracts CaM actions by a dual mechanism.
Significance: Our approach provides new insights into mechanisms of Ca2+ channel inactivation.
Keywords: Calcium-binding Proteins, Calcium Channels, Calmodulin, Electrophysiology, Fret, Inactivation
Abstract
CaV1.2 interacts with the Ca2+ sensor proteins, calmodulin (CaM) and calcium-binding protein 1 (CaBP1), via multiple, partially overlapping sites in the main subunit of CaV1.2, α1C. Ca2+/CaM mediates a negative feedback regulation of Cav1.2 by incoming Ca2+ ions (Ca2+-dependent inactivation (CDI)). CaBP1 eliminates this action of CaM through a poorly understood mechanism. We examined the hypothesis that CaBP1 acts by competing with CaM for common interaction sites in the α1C- subunit using Förster resonance energy transfer (FRET) and recording of Cav1.2 currents in Xenopus oocytes. FRET detected interactions between fluorescently labeled CaM or CaBP1 with the membrane-attached proximal C terminus (pCT) and the N terminus (NT) of α1C. However, mutual overexpression of CaM and CaBP1 proved inadequate to quantitatively assess competition between these proteins for α1C. Therefore, we utilized titrated injection of purified CaM and CaBP1 to analyze their mutual effects. CaM reduced FRET between CaBP1 and pCT, but not NT, suggesting competition between CaBP1 and CaM for pCT only. Titrated injection of CaBP1 and CaM altered the kinetics of CDI, allowing analysis of their opposite regulation of CaV1.2. The CaBP1-induced slowing of CDI was largely eliminated by CaM, corroborating a competition mechanism, but 15–20% of the effect of CaBP1 was CaM-resistant. Both components of CaBP1 action were present in a truncated α1C where N-terminal CaM- and CaBP1-binding sites have been deleted, suggesting that the NT is not essential for the functional effects of CaBP1. We propose that CaBP1 acts via interaction(s) with the pCT and possibly additional sites in α1C.
Introduction
Regulation of calcium entry is an essential process in the activity of the heart and the brain. Cav1.2 is a ubiquitous L-type voltage-gated Ca2+ channel (VGCC)3 and a major route for Ca2+ entry into excitable cells. α1C, the pore-forming subunit of Cav1.2, is organized in four homologous domains, cytosolic N terminus (NT), C terminus (CT) (see Fig. 1A), and three interdomain linkers. The cytosolic elements participate in gating and serve for docking of the auxiliary subunit β and various regulatory proteins in a modular complex that controls the function of the channel (1–3). All CaV channels undergo inactivation, which prevents excessive Ca2+ entry. High voltage activated CaV1 and CaV2 channels inactivate via two mechanisms: voltage-dependent inactivation, VDI, and Ca2 +-dependent inactivation (CDI). Multiple molecular determinants for inactivation have been identified. However, unlike for some voltage-dependent K+ and Na+ channels (4), the dynamics of conformational changes that culminate in VDI and CDI are controversial and remain the subject of intense research (5–10).
FIGURE 1.

Two-hybrid FRET reveals interactions of CaBP1 and CaM with the N or C termini of CaV1.2. A, shown is a schematic representing the Cav1.2 α1C subunit with the plasma membrane (blue) and the cytosolic termini: NT (amino acids 1–154) and CT (amino acids 1505–2171) with the pre-IQ and IQ motifs. Numbering refers to the rabbit α1C isoform. B, imaging of exogenously expressed fluorescent proteins in representative Xenopus oocytes is shown. Excitation wavelengths are indicated. Direct excitation of YFP with the 405-nm laser (b) produced an ∼4–5% emission reading compared with excitation with the 514-nm laser line (a). A change in emulated color from blue (CFP emission alone; c) to turquoise in cells expressing both YFP and CFP-labeled proteins and excited with the 405 nm laser (d) indicates the presence of FRET. C–E, shown are FRET measurements. The top panels illustrate the experimental paradigms. Circles represent the fluorophores, YFP in green and CFP in blue. The metric for FRET (Eapp) was obtained for each experimental condition, binned, and presented as the mean ± S.E. for each bin (see “Experimental Procedures”). FRET was measured between fluorescently labeled CaBP1 (C) or CaM (D) and the membrane-attached cytosolic termini segments YFP-NT (amino acids 1–154) and pCT-CFP (amino acids 1505–1671). In control experiments there was no FRET between CaM-CFP and CaM-YFP or between CaBP1-CFP and CaM-YFP in the presence and absence of the channel CaV1.2 (E). In all plots the number of cells (n) is indicated in the figure caption. The number of experiments (N) was as follows: C, N = 5; D, N = 1; E, CaM + CaBP1 N = 3, CaM + CaM N = 5.
CaM and CaBP1 are members of a large family of Ca2+ sensors and regulators that diversify Ca2+ signaling and neuronal activity through VGCCs and other pathways (11). Specifically, Ca2+-binding proteins regulate the inactivation, activation gating, and surface expression of VGCCs (12–17). CaBP1 regulates the currents of CaV1 and CaV2 channels in neurons, photoreceptors, and auditory hair cells. CaBP interactions with Cav1 channels may be required for hearing and vision, as mutations that disrupt these interactions cause blindness and deafness (17, 18). Although CaBP1 is structurally similar to CaM, with two Ca2+ binding lobes, it has a low sensitivity to Ca2+ in the N-lobe and a myristoylation motif at its NT (19–21).
CaM is an integral component of the Cav1 and Cav2 channel complex (for review, see Ref. 22). Both Ca2+-free (apoCaM) and Ca2+-bound CaM (Ca2+/CaM) bind the α1C subunit of CaV1.2. CDI occurs when apoCaM, presumably anchored at α1C, binds Ca2+ that enters the cell through the open channel and promotes a fast inactivation process via a conformational change of a yet unclear nature in CaV1.2 (23–31). A structural element in α1C that is essential for CDI is the proximal CT (pCT), which contains three CaM binding structural elements: two in the pre-IQ and a high affinity site under elevated Ca2+ conditions in the IQ domain (see Fig. 1A) (26, 29, 30, 32–41).
In contrast to CaM, CaBP1 eliminates CDI but accelerates VDI of Cav1.2 (42–44). The mechanism by which CaBP1 counteracts the CDI-promoting action of CaM is unclear. Like CaM, CaBP1 interacts with the IQ domain and the pre-IQ domain of the α1C subunit (42). Mutations in IQ reduce the apparent affinity of both CaM and CaBP1, and direct competition of CaBP1 and CaM for IQ has been demonstrated (37, 42, 45). Therefore, it has been proposed that at least part of the functional CaBP1 action occurs through a competition mechanism whereby CaBP1 displaces CaM at the overlapping pCT binding site(s) in the α1C subunit (42, 45).
Furthermore, both CaM and CaBP1 interact with the NT of α1C. CaM binds at the N-terminal spatial Ca2+ transforming element in the presence of Ca2+ (28, 46, 47). In contrast, the binding of CaBP1 to the NT of α1C is Ca2+-independent (43) and upstream of the CaM binding site (44). Deletion of the first half of the NT of α1C, which removes the CaM binding site but spares the CaBP1 site, weakened the regulation of CDI by CaBP1 in CaV1.2 expressed in a mammalian cell line (43), but the structural mechanism behind this effect is not known. Because the α1C NT binding sites for CaM and CaBP1 are not overlapping, regulation of CDI by CaBP1 via the NT, which does not involve competition with CaM, is plausible. In all, it is not well understood whether competition of CaBP1 and CaM at the CT is a major mechanism of suppression of CDI by CaBP1 and what the relative roles of CaBP1 and CaM binding sites in the N and C termini of α1C are.
In this paper we show that the effect of CaBP1 on CDI in CaV1.2 expressed in Xenopus oocytes is largely determined by a competition with CaM, probably at the pCT binding site(s). Förster resonance energy transfer (FRET) shows that CaM can displace CaBP1 from pCT but not the NT of α1C. Titrated injection of recombinant purified CaM and CaBP1 proteins into the oocytes reveals a functional competition that determines the extent of CDI and does not require the NT of α1C. A residual 15–20% effect of CaBP1 cannot be reversed by excess CaM and may rely on a mechanism that does not involve competition with CaM.
EXPERIMENTAL PROCEDURES
Oocyte Culture and cRNA
Experiments were approved by Tel Aviv University Institutional Animal Care and Use Committee (permit #M-08-081). Maintenance of female frogs (Xenopus laevis), operation, preparation of oocytes, and in vitro RNA synthesis were carried out using standard methods (44). cRNA of α1C, β2b, and α2δ1 and the segments (NT and pCT) are in pGEM-HE (48) or pGEMHJ expression vectors, which contain 5′- and 3′-untranslated regions from Xenopus β-globin. Oocytes were injected with 6.25 ng (see Fig. 3) or 5 ng (see Figs. 4–6) of cRNA of each of the 3 channel subunits constructs (α1C (GenBankTM accession number X15539), β2b (GenBankTM accession number X64297), and α2δ1 (GenBankTM accession number P13806)) and incubated for 3–5 days at 20–22 °C in NDE96 solution: 96 mm NaCl, 2 mm KCl, 1 mm MgCl2, 1 mm CaCl2, 2.5 mm sodium pyruvate, 50 μg/ml gentamycin, and 5 mm HEPES titrated to pH 7.5.
FIGURE 3.

Titration of CaM-YFP RNA reduces the expression of CaBP1-CFP. A, shown is a schematic illustration of the experiment. CaV1.2 and xFP-labeled CaM and CaBP1 were co-expressed by injection of oocytes with the corresponding RNAs. Ca2+ currents and expression levels of the fluorescent proteins were measured in oocytes of the same batch. B, representative currents elicited by 400-ms pulses from −80 to 20 mV in oocytes injected with RNA corresponding to the channel alone (green) or co-injected with RNA encoding CaBP1-CFP (1 ng, red), or CaBP1-CFP (1 ng) + CaM-YFP (20 ng, black). Currents were normalized to the peak current to allow a comparison of the inactivation kinetics. C, increasing the amount of RNA for CaM-YFP apparently eliminates the CDI slowing caused by coexpressed CaBP1-CFP. Oocytes were injected with CaV1.2 RNA (6.25 ng) with or without CaBP1-CFP RNA (1 ng) and with increasing amounts of CaM-YFP RNA. Currents were elicited by 400-ms pulses from −80 to 20 mV. Results are from one experiment; the numbers of cells tested are indicated in the vertical bars (n). Statistical significance was determined by one way analysis of variance followed by Bonferroni test versus control (oocytes with no CaBP1 or CaM). ***, p < 0.001; **, p < 0.01; *, p < 0.05; ns, not significant. D, shown are representative images of oocytes expressing CaV1.2 with different ratios of CaBP1-CFP and CaM-YFP RNA as indicated. Excitation wavelengths were 405 nm (for CFP on the left) and 514 nm (for YFP on the right). E, shown is a summary of expression levels from oocytes expressing CaV1.2 with CaBP1-CFP and/or CaM-YFP. The determination of expression levels from fluorescence and calculation of molar ratios of CaBP1-CFP/CaM-YFP (shown above the corresponding bars) using dl-IRK1 as calipers are explained under “Experimental Procedures.” n = 10–17, N = 1. A.U., arbitrary units.
FIGURE 4.

Opposite regulation of CDI by purified rCaM and rCaM1234. Oocytes expressing CaV1.2 were injected with 50 nl of control BAPTA-containing solution or with the same solution containing recombinant proteins rCaM1234 and rCaM 0.5–1 h before recording. A, left, shown is ICa (normalized to peak in each cell), elicited by depolarizing steps from −80 to 20 mV, averaged from 4–6 oocytes (N = 1). S.E. are shown at every 100th point. B, shown is dose-dependent slowing of CDI by CaM1234 and its inhibition by 350 μm rCaM. Bars show the r400 values of ICa at 20 mV. Intracellular concentrations of rCaM and rCaM1234, calculated as explained under “Experimental Procedures,” are indicated at the x axis. Representative ICa traces are shown above the bars. The maximal effect (referred as 100%) of CaM1234 is indicated by the red arrow. Statistical significance was determined by one way analysis of variance followed by Bonferroni test versus the control group. ***, p < 0.001; **, p < 0.01; ns, not significant. C, shown is a dose-response curve for rCaM1234, shown as fractional effect of titrated rCaM1234 on r400 values relative to maximal effect defined in B. Fit to one-site binding isotherm (Equation 1, gray line) and to the Hill equation (Equation 2; black line) are shown. The fit yielded: for one-site model, Kd,app = 9.6 μm; for the Hill equation, Kd,app = 8.8 μm, n- (Hill coefficient) = 0.93.
FIGURE 5.

rCaBP1 and rCaM protein titration reveals two mechanisms for regulation of CDI by CaBP1. Oocytes expressing CaV1.2 were injected 0.5–1 h before recording with 50 nl of BAPTA-containing solution alone (control) or the same solution with mixtures of the recombinant proteins rCaM and rCaBP1. Aa, shown are normalized averaged ICa values elicited by 400-ms pulses from −80 to 20 mV. Intracellular protein concentrations were 2.6 μm for rCaBP1 and 400 μm for rCaM. n = 14–21, N = 4 experiments. S.E. are shown every 100th point. b, shown is r400 of ICa elicited by steps from −80 mV to different voltages in the presence (i) or absence (l) of 26 mm rCaBP1. n = 9–11, N = 4. Mean ± S.E. values are shown; note that in some cases the size of S.E. bars is smaller than of the symbols. Ba, shown is dose-dependent slowing of CDI by rCaBP1. r400 was measured at 20 mV. Bars show the r400 values; representative ICa records are shown above the bars. b, a dose-response relationship shows the fractional effect rCaBP1 on r400 as a function of CaBP1 concentration in the oocyte. Full (100%) effect was calculated as shown by the red arrow in a. Fits to one-site binding isotherm (Equation 1; purple line) and to the Hill equation (Equation 2, black line) are shown. The fit yielded: for one-site model, Kd,app = 0.8 μm; Hill equation, Kd,app = 0.8 μm, n- (Hill coefficient) = 1.9. C, changes in r400 resulting from titration of injected rCaM in the presence of a constant (2.6 μm) concentration of rCaBP1 reveals two components of CaBP1 regulation of CDI. The full (100%) effect of rCaBP1 was calculated with 26 μm CaBP1, as shown by the red arrow. Representative ICa records are shown above the bars. D, shown is a dose-response curve for rCaM titrated in the presence of 2.6 μm rCaBP1. The experimental data (black circles) show the fractional effect of rCaBP1 on CDI and its reduction by increasing doses of rCaM. Kd,app for CaBP1 was taken as 0.8 μm. The one-site competition model fit without a non-competing fraction (Equation 3; red line) gave Kd,app of 10.2 μm with the following parameters of the fit: R2 = 0.8778; S.E. of estimate = 0.0899. The one-site fit with non-competing fraction (Equation 4; black line) gave Kd,app = 6.28 and fr = 0.15, with the following fitting parameters: R2 = 0.9344; S.E. of estimate = 0.0712. The blue line presents a simulation of the rCaM dose-effect curve (using Equation 4) for the case when the concentration of rCaBP1 would be 26 μm, 10-fold higher than in the experiment. E, titration of rCaM in the presence of 2.6 μm rCaBP1 restores CDI. r50 represents the residual current after 50 ms. In C and E, statistical significance was determined by one way analysis of variance followed by the Bonferroni test, referring to the leftmost bar as the control group. **, p < 0.01; ***, p < 0.001; ns, not significant.
FIGURE 6.

Functional competition of CaBP1 and CaM does not require the NT of α1C. Xenopus oocytes expressed the deletion mutant Δ139-α1C together with β2b and α2δ1. Oocytes were injected 0.5–1 h before measurement with 50 nl of BAPTA-containing solution with different concentrations of rCaM and rCaBP1. Aa, shown is normalized averaged ICa elicited by 400-ms pulses from −80 to 20 mV. The intracellular concentrations were rCaBP1 = 2.6 μm and rCaM = 400 μm. n = 4–9, N = 3 experiments. S.E. are shown every 100th point. b, r400 of ICa elicited by steps from −80 mV to different voltages in the presence (○) or absence (●) of 26 μm rCaBP1 is shown. n = 6–9, N = 3. Mean ± S.E. r400 values are shown; note that in some cases the sizes of S.E. bars are smaller than of the symbols. B, titration of injected rCaM in the presence of a constant (2.6 μm) concentration of rCaBP1 reveals two components of CaBP1 regulation of CDI in Δ139-α1C. Shown are changes in r400 measured at 20 mV, with the indicated calculated intracellular concentrations of rCaM and rCaBP1. The full (100%) effect of rCaBP1 was calculated with 26 μm CaBP1, as shown by the red arrow. Representative IBa records are shown above the bars. C, the dose-response curve for rCaM, expressed as fractional effect of 2.6 μm CaBP1, is presented in the same way as for WT-α1C (see the legend to Fig. 5D). The one-site fit without a non-competing fraction (Equation 3; red line) gave a Kd,app of 14.7 μm with the following parameters: R2 = 0.8458; S.E. of estimate = 0.0919. The one-site fit with non-competing fraction (Equation 4; black line) gave a Kd,app = 7.88 and fr = 0.2, with the following fitting parameters: R2 = 0.9382; S.E. of estimate = 0.0628. Note that both in WT (Fig. 5) and Δ139 channels the quality of fit was substantially better with the assumption of non-competing fraction. The blue line presents a simulation of the rCaM dose-effect with 26 μm CaBP1. D, titration of rCaM in the presence of 2.6 μm rCaBP1 restores r50. In B and D, statistical significance was determined by one way analysis of variance followed by the Bonferroni test. **, p < 0.01; ***, p < 0.001.
DNA Constructs
cDNA constructs for the labeled proteins were obtained using standard PCR procedures. cDNA constructs for oocyte expression were inserted into the pGEMHJ vector. Enhanced yellow fluorescent protein (YFP) and cerulean (CFP) were as in Ref. 49. Both carried the A206K mutation to avoid dimerization, and YFP carried the Q69M mutation reducing its environmental sensitivity. To create Myr-pCT-CFP, the coding sequence of the myristoylation signal derived from the Src protein (ATGGGGAGTAGCAAGAGCAAGCCTAAGGACCCCAGCCAGCGCCGG) was inserted between SmaI and EcoRI of pGEM-HJ followed by the coding sequence of pCT, which was inserted between EcoRI and XbaI, and CFP (with stop codon), which was inserted between XbaI and HindIII. To create YFP-NT-CAAX, the coding sequence of YFP was inserted between BamHI and EcoRI of pGEM-HJ followed by the NT (amino acids 1–154), which was inserted between EcoRI and XbaI. The CAAX box was inserted after an adenine to avoid a frameshift, and a three-glycine linker was inserted between HindIII and BstEII. To create CaM-xFP (where xFP stands for either CFP or YFP), the coding sequence of CaM was inserted between BamHI and XbaI (the stop codon was canceled) followed by YFP or CFP with a stop codon between XbaI and HindIII. To create CaBP1-xFP, the coding sequence of CaBP1 was inserted into a EcoRI site (the stop codon was canceled) followed by YFP or CFP with a stop codon between EcoRI and HindIII.
Purified Recombinant Protein Injection
All recombinant proteins were expressed in Escherichia coli Tuner (DE3) Codon Plus cells grown in standard media at 37 °C (CaM, CaM1234) or 16 °C (CaBP1) after induction with isopropyl 1-thio-β-d-galactopyranoside. For CaM purification, the procedure described by Hayashi et al. (50) was used with slight modifications. After lysis by a microfluidizer (Microfluidics), cell debris was removed by a 1-h centrifugation at 38,700 × g. The supernatant was heated to 90 °C for 5 min and then centrifuged for an additional 30 min before loading on a phenyl-Sepharose column. Subsequently, an additional Q-Sepharose chromatography step was added where the protein was eluted by a linear salt gradient (0–0.5 m NaCl). Protein was dialyzed against deionized water and lyophilized. For CaM1234 purification, cells were suspended in lysis buffer (100 mm NaCl, 50 mm Tris, pH 7.5, 1 mm phenylmethylsulfonyl fluoride). After lysis, the soluble fraction was heated to 70 °C for 5 min and then centrifuged. Soluble fraction was diluted with 1 volume of 50 mm Tris, pH 7.5, 10% glycerol before loading onto a Q-Sepharose (GE Healthcare) column. The protein was eluted by a linear salt gradient (50–1000 mm NaCl). Selected fractions were loaded onto a hydroxyapatite column pre-equilibrated with 50 mm Tris, pH 7.5, 200 mm NaCl. The protein was eluted by a linear phosphate gradient to 500 mm potassium phosphate, pH 7.5, 100 mm NaCl. Relevant fractions were then loaded onto a HiLoad 16/60 Superdex 75 gel filtration column (GE Healthcare) in 20 mm Tris, pH 7.5, 200 mm NaCl. Finally, CaM1234 was desalted by a HiTrap 26/10 desalting column (GE Healthcare) in water, lyophilized, and stored at −20 °C.
For CaBP1 purification, all steps were performed on ice or at 4 °C. Cell paste was suspended in PBS with a ratio of 10 ml of buffer to 1 g of paste. Triton X-100 (0.1%), 1000 units of DNase, 10 mg of lysozyme, and 1 mm PMSF were added to the suspension. The cells were homogenized and lysed by microfluidizer (Microfluidic). Lysate was centrifuged for 1 h to pellet. The supernatant was loaded onto a glutathione column pre-equilibrated with PBS buffer. After the cell extract was loaded, the column was extensively washed with PBS buffer. Protein was eluted with buffer containing 50 mm Tris, pH 8.0, 100 mm NaCl, and 10 mm glutathione. The eluted protein was digested overnight with thrombin at a ratio of 1 mg of protease to 30 mg of protein. After thrombin digestion, the protein solution was diluted 2-fold in 50 mm MES (pH 6.0), 10% glycerol. Buffer solution was subsequently loaded onto a Q-Sepharose (Amersham Biosciences) column pre-equilibrated with 25 mm MES (pH 6.0), 50 mm NaCl. The protein was eluted by a gradient of 50–600 mm NaCl (10 column volumes). The final step used a Superdex 200 Hi-prep gel-filtration column pre-equilibrated with 20 mm Tris, pH 7.5, 150 mm NaCl, 1 mm DTT. The fractions containing the protein were collected and concentrated to 15 mg/ml using a Vivaspin concentrator with a 5000-Da cutoff. Final protein concentration was determined by absorbance spectroscopy at 280 nm. The protein was aliquoted, flash-frozen in liquid nitrogen, and stored at −80 °C. Circular dichroism spectroscopy showed that purified recombinant CaM, CaM1234, and CaBP1 displayed spectra characteristic of α-helical proteins and CaM. All proteins showed essentially 100% monodispersity as shown with size exclusion chromatography-multi-angle light scattering, and the molecular masses were completely consistent with calculated masses based on their sequences (data not shown).
For injection into oocytes, proteins were diluted in water (rCaM and rCaM1234 stock solutions, 12 mm; rCaBP1 stock solution, 700 μm), aliquoted, and stored at −80 °C. BAPTA (1,2-bis(o-aminophenoxy)ethane-N,N,N′,N′-tetraacetic acid) was kept in 200 mm stock solution in 0.3 n sodium bicarbonate at −20 °C. BAPTA mixed with H2O or with the purified proteins was injected in a 50-nl drop into each oocyte 0.5–1 h before measurement. Calculations of final concentration in the oocyte of BAPTA and the purified proteins have been done assuming a homogenous distribution within an oocyte volume of 1 μl.
Electrophysiology and Data Analysis
Xenopus oocytes were injected with BAPTA to a final concentration of 1.5–2.5 mm, and Ca2+ currents were measured at 22–25 °C essentially as described (44). In brief, the two-electrode voltage clamp technique was used to measure whole cell currents using Gene-Clamp 500 amplifier (Axon Instruments). The external solutions contained 40 mm Ca(OH)2, 50 mm NaOH, and 2 mm KOH titrated to pH 7.5 with methanesulfonic acid. All current protocols were routinely repeated in the presence of 200 μm Cd2+. Net Ca2+ current was obtained by subtracting the currents recorded in Cd2+-containing solution from the currents in control Ca2+ solution to eliminate endogenous non-Ca2+ and leak currents. All recordings were obtained by a 400-ms step pulse from −80 mV (holding potential) to several test pulses from −30 mV up to 60 mV in a 10-mV step. Maximal current amplitude was usually reached at 20 mV. Data acquisition and analysis were done using the pCLAMP10 software (Axon Instruments). Graph design and fit were done by SigmaPlot 11 software. r400 and r50 denote the fractional residual current left after 400 and 50 ms, respectively, after the peak of ICa divided by the maximal current. r400 and r50 are numbers between 0 and 1, corresponding to full and no inactivation, respectively.
Dose-effect relationships for rCaM1234 (see Fig. 4C) and rCaBP1 (see Fig. 5B) were fit to a one-site saturation isotherm,
or the Hill equation
where E is the fractional effect of CaBP1 or CaM1234, C is the concentration of the injected protein, Kd,app is the apparent dissociation constant, and n is the Hill coefficient (51).
The curves describing the dose-dependent attenuation of CaBP1 effect by the injected rCaM were obtained by fitting the data to a one-site competition model,
or a one-site model with non-competing fraction
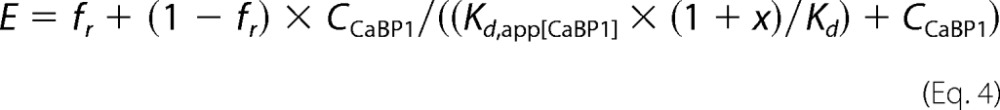 |
where Kd stands for the apparent dissociation constant of rCaM, and fr is the CaM-resistant fraction of CaBP1 regulation of CDI.
Imaging and FRET assays in oocytes were performed essentially as described (49, 52). Oocytes were imaged in ND96 solution in a 0.7-mm glass-bottom dish. Fluorescence emissions from CFP and YFP-tagged proteins were collected from the animal hemisphere of the oocyte with a Zeiss inverted confocal microscope (Zeiss Axiovert LSM 510META) using a 20 × 0.75 NA air objective and laser excitations of 405 and 514 nm, respectively. To construct FRET titration curves using data from different experiments, molar ratios of donor and acceptor have been calculated in each oocyte as described (52). In brief, we imaged a double-labeled protein expressing both CFP and YFP at a 1:1 stoichiometry (YFP-IRK1-CFP, dl-IRK1) in each experiment and converted the fluorescence of CFP and YFP into their molar ratio by calculating the slope of the CFP to YFP fluorescence of dl-IRK1. Then this slope was used as a reference to convert CFP and YFP fluorescence in all other experimental groups into a molar ratio. To measure FRET, we used a spectrum-based method (53). Briefly, two emission spectra were collected from each oocyte, one with 405-nm excitation and the other with 514-nm excitation. A scaled CFP spectrum, collected from control oocytes expressing CFP-tagged proteins only, was used to normalize the CFP emissions from the spectrum taken from oocytes expressing both fluorophores at 405-nm excitation. This procedure allows one to dissect the YFP emission spectrum, termed F405. F405 has two components: one due to direct excitation of YFP (F405direct) and one due to FRET (F405FRET). F405 is normalized to the total YFP emission with 514-nm excitation at the same oocyte, F514. The resulting ratio, termed Ratio A, can be expressed as
 |
The direct excitation component in the calculated Ratio A, termed Ratio A0, is experimentally determined from a large population of oocytes expressing only YFP-tagged proteins. This allows an accurate calculation of the bleed-through of direct excitation of YFP by the 405-nm laser. The difference between Ratio A and Ratio A0 (Ratio A − Ratio A0) is directly proportional to FRET efficiency,
 |
The apparent FRET efficiency in an individual cell, Eapp, can be calculated as (54),
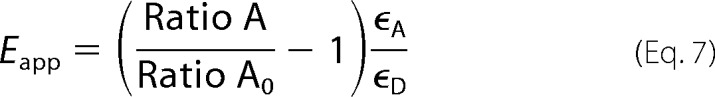 |
where ϵD and ϵA are molar extinction coefficients for the donor and acceptor, respectively, at the donor excitation wavelength (55).
FRET data in Fig. 1, C–E, were binned by grouping Eapp of all cells within consecutive donor/acceptor ratio ranges of 0.5, except for the last bin where there were too few points, and all data in this variable bin were pooled together. Both S.E. for both donor/acceptor ratio (horizontal S.E. bars) and for Eapp (vertical S.E. bars) are shown for this point in all plots.
RESULTS
CaBP1 and CaM Interactions with the NT and the CT of α1C
We first addressed the interactions of CaM and CaBP1 with NT and CT separately. It has been proposed that in the presence of Ca2+, CaM may “bridge” between NT and CT in L-type VGCCs (28, 46) forming a triple complex, which could complicate the interpretation of the results. However, a later study demonstrated that no such bridge is formed in the α1C subunit of CaV1.2 (47), supporting the approach taken here.
To study the possible competition between CaM and CaBP1 in an intact cell, we first used the FRET two-hybrid method (34) in Xenopus oocytes (Fig. 1B). We constructed RNAs corresponding to the following fluorescently labeled proteins: cytosolic NT domain (amino acids 1–154), the proximal part of the CT from the boundary with the plasma membrane up to the end of IQ domain, pCT (amino acids 1505–1671) (Fig. 1A), CaBP1, and CaM. An important modification of the FRET two-hybrid method was the introduction of a plasma membrane anchor in the NT and pCT in order to imitate their proximity to the membrane in the full channel (Figs. 1, C and D, upper panel schematic). To accomplish this we added a prenylation signal element to the carboxyl end of the NT (CAAX box originating from K-Ras) (56). For pCT, we added a myristoylation signal from Src (57) at the N-terminal end. The fluorophores in these constructs are located distally to the membrane anchor, YFP in the NT (YFP-NT) and CFP in the pCT (pCT-CFP). To assess actual molar ratios of CFP and YFP, in a separate group of oocytes we expressed a double-labeled protein containing both CFP and YFP at a 1:1 stoichiometry (dl-IRK1; see “Experimental Procedures”). FRET was quantitated as apparent FRET efficiency (Eapp) for a range of donor/acceptor molar ratios to verify saturation of the signal and to avoid underestimation of FRET at low donor/acceptor ratios (52, 58). The value of Eapp at saturation reflects proximity among fluorophores within a FRET pair (53).
We observed FRET between fluorescently labeled CaBP1 and both YFP-NT and pCT-CFP (Fig. 1C). The FRET signal saturated at high donor/acceptor ratios, which indicates a specific interaction. We also observed FRET between CaM-YFP and pCT-CFP, but not between CaM-CFP and YFP-NT (Fig. 1D). The latter is in line with the known Ca2+ dependence of this interaction (see “Discussion”). Our FRET experiments also show that there is no FRET between CaM-CFP and CaBP1-YFP or between CaM-YFP and CaM-CFP (Fig. 1E).
If CaM and CaBP1 could simultaneously interact with separate sites in the channel, the coexpression of the channel with CaM and CaBP1 should strengthen the FRET signal between CaM and CaBP1. However, there was no difference in the FRET signal in oocytes expressing CaM and CaBP1 and those expressing α1C, CaM, and CaBP1 (Fig. 1E). This result suggests that CaM and CaBP1 do not simultaneously bind to α1C. However, because of the limitations of FRET methodology, which only applies to distances less than 10 nm (59), the possibility of such a simultaneous binding cannot be ruled out.
CaM Reduces FRET of CaBP1 with CT but Not with NT
If CaBP1 inhibits CDI by competing with CaM for a shared binding site in α1C, then CaM should antagonize the interaction of CaBP1 with the channel and reverse the effect of CaBP1 on CDI. To examine whether excess CaM reduces the interaction between CaBP1 with NT or pCT, we injected purified recombinant CaM protein produced in E. coli (rCaM) to an approximate final concentration of 350 μm in the oocyte and monitored changes in FRET between YFP-NT and CaBP1-CFP or between pCT-CFP and CaBP1-YFP. FRET was monitored in individual oocytes before and after the injection of rCaM. rCaM did not change the FRET between YFP-NT and CaBP1-CFP (Fig. 2A), but it significantly reduced the FRET between the pCT-CFP and CaBP1-YFP (Fig. 2B). Thus, CaM interferes with the interaction of CaBP1 with the pCT, but not with the NT, under the same experimental conditions.
FIGURE 2.

CaM inhibits CaBP1 interactions with pCT but not NT. Each point represents FRET measurements taken before and 30–60 min after the injection of purified rCaM (350 μm final concentration) in oocytes expressing YFP-NT and CaBP1-CFP (A) or pCT-CFP and CaBP1-YFP (B). rCaM was injected, and FRET was measured again in the same oocyte. Data from all oocytes are shown. Boundaries of the box plot represent 25th/75th percentiles, the line within the box marks the median, and error bars indicate the 10th/90th percentile. Because FRET measurements have been done in the same cells before and after treatment, the statistical significance was evaluated using paired t test. n = 25–43, N = 2 experiments.
Overexpression of CaM Attenuates the Functional Effect but Also the Expression Level of CaBP1
Next, we coexpressed CaV1.2 with CaBP1-CFP (Fig. 3A) and observed the typical slowing of current decay, manifested in the increase in r400 value (% of current remaining after 400 ms pulse (24)) (Fig. 3, B and C), which is due to inhibition of CDI. Coexpression of increasing the amounts of CaM-YFP RNA while maintaining constant RNA amounts of CaBP1-CFP and CaV1.2 and caused a reduction in r400 value in an RNA dose-dependent manner (Fig. 3, A–C). This result appears compatible with a competition between CaM and CaBP1. However, careful examination of expression levels revealed that coexpression of CaM-YFP caused a decrease in the level of expressed CaBP1-CFP protein (Fig. 3, D and E). We did not succeed in preventing the reduction in CaBP1-CFP levels by widely varying RNA doses of both proteins and by switching the fluorophores (using CaM-CFP and CaBP1-YFP; data not shown). The decrease in the amount of CaBP1 protein might well underlie the apparent disappearance of the effect of CaBP1 on CDI. Such a decrease may reflect saturation of the protein synthesis machinery (e.g. Ref. 60) or a process of mutual regulation of biogenesis of these proteins, which may deserve further study. Furthermore, we could not achieve a molar excess of expressed CaM protein over CaBP1. Even with a 20:1 ratio of RNA, the actual amount of expressed CaM did not exceed that of CaBP1 (Fig. 3E and data not shown). We conclude that the overexpression strategy is inadequate to assess competition between CaBP1 and CaM both because of insufficient expression of CaM and because of a decrease in CaBP1 levels after coexpression of CaM.
Injection of Purified CaM Protein Removes the Effect of CaM1234 on CDI
We next attempted to use injection of purified proteins as an assay for functional competition between CaM and CaBP1. First, we tested whether injection of the purified rCaM will alleviate the effect of CaM1234. CaM1234 is a CaM mutant devoid of Ca2+ binding to its four EF-hands (61), which mimics apoCaM. CaM1234 binds to pCT of α1C but cannot bind Ca2+. Heterologously expressed CaM1234 suppresses CDI, presumably by replacing the endogenous apoCaM anchored to the pCT and thus preventing CDI when Ca2+ enters the cell via the channel (24, 27, 41, 62). Because both CaM1234 and CaM bind to the same site(s) in the CT at low basal levels of Ca2+ (29), we expected that injected rCaM protein will compete for the binding site and replace the rCaM1234.
Injection of purified rCaM1234 to an approximate final concentration of 450 μm in the oocyte (see “Experimental Procedures”) resulted in a robust inhibition of CDI; r400 changed from 0.18 ± 0.02 to 0.84 ± 0.03 (Fig. 4, A and B). rCaM alone did not affect CDI in the same concentration range (see Fig. 5A). For the following calculations, the net change in r400 caused by CaM1234 (Δr400 = 0.84–0.18 = 0.66) was taken as 100% effect of CaM1234 (Fig. 4B). Injection of rCaM1234 to 26 and 75 μm produced 74 and 86% of maximum effect, respectively (Fig. 4, B and C). Data were fit to the Hill equation (Equation 2, “Experimental Procedures”), yielding an apparent dissociation constant of rCaM1234 protein, Kd,app, of about 8.8 μm (Fig. 4C, black curve). The Hill coefficient was about 0.93, indicating a probable occupancy of one site. A one-site binding isotherm fit (Fig. 4C, gray curve), which can be viewed as a specific case of the Hill equation with a Hill coefficient equal to one (Equation 1, “Experimental Procedures”), gave a Kd,app of 9.7 μm.
Note that at 26 μm, CaM1234 protein produces ∼74% of its maximal effect, placing this concentration below saturation and within the dynamic range where a reduction of its binding by a competitor will result in a visible reduction in functional effect. Injection of 350 μm rCaM protein together with 75 or 26 μm rCaM1234 protein abolished 86 and 99% of the CaM1234 effect on CDI, respectively (Fig. 4B). We assume that the final concentration of CaM after injection might be slightly higher than 350 μm because of the presence of freely diffusible unbound endogenous CaM in the oocyte, although the latter is not expected to be substantial as most of CaM is probably restricted by interactions with its intracellular targets (63).
Injection of rCaM Protein Reduces but Does Not Abolish the Effect of CaBP1
Fig. 5A shows that although injection of rCaM did not affect CDI, the injection of the purified protein rCaBP1 decreased CDI. Using the same methodology as with rCaM1234, we injected increasing amounts of rCaBP1 into oocytes expressing CaV1.2. rCaBP1 caused a dose-dependent attenuation of CDI (Fig. 5Ba) with a Kd,app of 0.78 μm when fit to a standard one-site binding isotherm (Fig. 5Bb, purple line). Interestingly, fitting to the Hill equation gave a better fit with a Kd,app of 0.81 μm and a Hill coefficient of 1.9 (Fig. 5Bb, black line), implying an interaction of CaBP1 with two or more binding sites in Cav1.2. Injection of 26 μm rCaBP1 into oocytes expressing CaV1.2 maximally increased the r400 value to 0.72 ± 0.16, whereas 2.6 μm produced ∼90% of the maximal effect (Fig. 5B). Notably, the purified CaBP1 was produced in E. coli with no endogenous myristoyl transferase activity and thus lacked N-terminal myristoylation (64). This indicates that myristoylation of CaBP1 is not essential for the regulation of CDI in CaV1.2 under our experimental conditions.
Next, we examined whether rCaM abolishes the effect of rCaBP1. Like with CaM1234, we chose to titrate rCaM in the presence of a concentration of CaBP1, which is ∼3-fold the Kd,app (2.6 μm for CaBP1, 26 μm for CaM1234) and produces less than a maximal effect, which should be within the dynamic range suitable to study a competition mechanism. We mixed increasing amounts of rCaM with 2.6 μm rCaBP1 protein and injected the protein mixtures into oocytes expressing CaV1.2. rCaM attenuated the effect of 2.6 μm rCaBP1 (measured as r400) in a dose-dependent manner (Fig. 5C). However, rCaM did not fully abolish the effect of rCaBP1. The dose-dependent inhibition by rCaM of the effect of rCaBP1 on CDI was not adequately fit to a simple competition model (Fig. 5D, red line). Rather, there was a fraction (∼15%) of the CaBP1 effect that could not be eliminated even with a 154-fold molar excess (400 μm) of rCaM over rCaBP1 (Fig. 5, C and D, black line). This finding is in contrast to the effect of CaM1234, which was fully abolished by a 13-fold excess of rCaM. This result indicates that the effect of rCaBP1 is largely (∼85%) due to competition with CaM, but a residual action of CaBP1 is mediated by another mechanism. The Kd,app for rCaM, calculated for the competitive fraction of its inhibition of rCaBP1 effect, was 6.3 μm, very close to the 8.8 μm estimated for CaM1234 from the experiments of Fig. 4, A–C. This latter result supports the notion that, in its competition with CaBP1, CaM binds to the same site as apoCaM (CaM1234).
CDI usually shows two kinetic components, a fast phase and a slower phase, with time constants in the 10s and 100s-ms ranges, respectively (5, 65). An effect of CaBP1 on the faster component may be overlooked when using only the r400 parameter. In the current traces of Fig. 5A, rCaM successfully eliminates the inhibitory effect of rCaBP1 on the fast component of CDI, and the effect of CaBP1 that is not suppressed by excess rCaM appears only in the slower component. To analyze this quantitatively, we measured changes in inactivation at the 50 ms time point, r50. As shown in Fig. 5E, 200–400 μm rCaM fully restored the fast component of CDI to a value seen in the absence of CaBP1.
139 N-terminal Amino Acids of α1C Are Not Involved in the Effect of CaBP1 on CDI
Previous reports showed the importance of the NT in the CaBP1-induced slowing of CDI; partial deletion of NT attenuated the action of CaBP1 on CDI in HEK 293 cells (37, 43). We injected rCaBP1 protein into oocytes expressing CaV1.2 containing an α1C mutant, Δ139-α1C, which lacks the first 139 amino acids and thus most of the CaBP1 binding site in the NT (44). rCaBP1 significantly reduced the CDI of Δ139-α1C, as in the wild-type channel (Fig. 6A). Moreover, coinjection of rCaM protein with 2.6 μm rCaBP1 showed a similar dose-dependent effect of rCaM as for the wild-type channel, with a Kd,app of 7.9 μm and a residual CaBP1 effect on r400 of 20%, which remained even at 400 μm rCaM (Fig. 6, B and C, black line). As with WT-α1C, the dose-dependent inhibition by rCaM was not adequately fit to a simple competition model (Fig. 6C, red line). Analysis of the CaBP1 effect after 50 ms showed a complete removal of the CaBP1 effect by 200–400 μm rCaM (Fig. 6D). These data indicate that in Xenopus oocytes the α1C NT is dispensable for CaBP1 regulation of CDI and that competition with CaM likely takes place at another site(s) in α1C.
DISCUSSION
To date full-length Ca2+ channels are not yet available for quantitative in vitro studies. Only partial information on the structural and thermodynamic aspects of interactions of segments of the pCT with CaM and CaBP1 is available for VGCCs (35, 45, 66–69). Accordingly, heterologous expression has been the leading strategy to study the molecular regulation of VGCCs by CaM- and Ca2+-binding proteins. In this work we have exploited the advantages of the oocyte expression system for a quantitative analysis of the opposing regulation of CaV1.2 by CaBP1 and CaM in a living cell.
CaBP1 and CaM Interact with NT and pCT of α1C but Compete Only for pCT
Overlap of CaBP1 and CaM pCT binding sites in α1C and their physical competition for these sites have been demonstrated in vitro with purified α1C protein segments (42, 45), but this has not been tested in living cells. We have addressed the possibility of competition using FRET with membrane-attached, xFP-labeled α1C NT and pCT segments. The use of membrane-attached cytosolic parts of a transmembrane protein for FRET two-hybrid testing ensures proper orientation of NT and CT relative to the plasma membrane and limits the possibility of artifactual interactions with cytosolic proteins such as CaM and CaBP1. The FRET data suggest that under low-Ca2+ conditions of the resting cell, both CaM and CaBP1 interact with the pCT, corroborating the in vitro studies (26, 29, 30, 32–42, 45). In contrast, the NT interacts only with CaBP1 but not CaM under low-Ca2+ conditions (Fig. 1). This is again in line with in vitro results, which showed that CaBP1 binding to NT is Ca2+-independent (43, 44), whereas binding of CaM requires Ca2+, with a half-maximal effective dose of above 1 μm (28, 46). We conclude that in resting cells the pCT of α1C is a potential site for physical competition between CaBP1 and CaM.
Furthermore, our FRET experiments suggest that such competition takes place under resting conditions with low Ca2+ levels. CaM, injected in excess into oocytes in the form of purified protein, greatly reduced FRET between pCT and CaBP1 (Fig. 2). Because there was no direct interaction between CaM and CaBP1, the simplest interpretation is a direct competition between CaM and CaBP1 for a binding site in the pCT. At present, however, an allosteric effect cannot be excluded. The absence of any effect of CaM on FRET between CaBP1 and NT serves as a control and suggests that there is no competition between CaM and CaBP1 for NT in the quiescent cell.
Two Mechanisms of Regulation of CDI by CaBP1
Our results strongly suggest that competition with CaM for a common binding site underlies a major part of the effect of CaBP1 on CDI in CaV1.2. Control experiments were done with CaM1234, which inhibits CDI, and this effect has been unanimously interpreted as the result of competition between the native CaM and the expressed CaM1234 and the replacement of the former by the latter at the anchoring site in pCT (8, 24, 27, 70). Our experiments directly tested this theory using purified proteins, for the first time in a living cell. The injection of purified proteins and all electrophysiological measurements were done in the presence of BAPTA. Under these conditions, the global resting concentration of Ca2+ in the cell remains low, and only the local Ca2+ concentration in the nanodomain adjacent to the channel inner mouth rises transiently during the depolarization and channel opening (31). The results corroborate the single-site competition model for the following reasons. First, the injected CaM1234 dose-dependently attenuated CDI with a Hill coefficient close to 1 (Fig. 4). This is expected if the injected CaM1234 replaces the endogenous apoCaM anchored at the pCT of α1C in the absence of Ca2+. When Ca2+ enters through the channel, the anchored CaM1234 is unable to confer CDI. Second, an excess of injected Ca2+-free CaM fully restored the normal CDI, presumably by competing with the injected CaM1234.
We then demonstrated that injection of purified CaBP1 strongly suppresses CDI (Fig. 5) and went on to address the mechanism of CaBP1 action by titration of purified CaM and CaBP1. The main new insight suggested by our data is that CaBP1 acts by two mechanisms, probably via two separate sites. The main mechanism is a competition with CaM for a single site. The second mechanism appears to involve CaBP1 binding to a site from which CaBP1 cannot be removed by CaM. The notion of two sites of action is supported by two lines of evidence. First, the dose dependence of CDI suppression by CaBP1 exhibits a Hill coefficient close to 2, which supports more than one site of binding or action (51). Second, titration of CaM in the presence of a constant concentration of CaBP1 showed that up to 85% of the CaBP1 effect on CDI is reversible in the presence of high CaM concentrations. This result was clearly visible and model-independent. The dose dependence of this CaM effect is compatible with a competition with CaBP1 for a common binding site. However, 15–20% of the CaBP1 effect could not be reversed even by a vast molar excess of CaM, supporting a notion of an additional site of action of CaBP1 that is not affected by excess CaM. Partial kinetic analysis of CDI showed that high doses of CaM fully reversed the CaBP1-induced slowing of the first (fast) phase of CDI, but slowing of the second (slow) phase of CDI persisted; the latter actually accounted for the overall remaining effect of CaBP1. It is unlikely that the CaBP1-induced, CaM-resistant slowing of the second phase of CDI reflects a change in a Ca2+-independent component of inactivation (VDI), because CaBP1 accelerates VDI rather than slows it down (44). A likely possibility is that the CaM-resistant effect on CDI is mediated through binding of CaBP1 to a site in α1C where it does not compete with CaM. This is in agreement with previous findings that an N-lobe/linker module of CaBP1 exerts an inhibitory effect on CDI that is independent of IQ-domain residues required for CaM binding (45).
CaBP1 interacts with α1C at multiple sites in the NT, CT, and L3 (the cytosolic linker between domains III and IV of α1C) (42–44), and at present we can only speculate which interactions underlie the two CaBP1 effects. In our assays the injected CaM protein similarly opposed CaBP1-induced slowing of CDI both in wild-type α1C and Δ139-α1C, a mutant lacking a major part of the NT CaBP1-binding site (44), although we cannot fully rule out some binding to the last remaining 15 cytosolic residues preceding the first transmembrane segment (Fig. 1A). Both in wild-type α1C and Δ139-α1C, the CaM-reversed and CaM-resistant components and the Kd,app for CaM effect were almost identical. This result indicates that neither of the two effects of rCaBP1 is mediated by its binding to the NT site. Although this might seem contradictory to previous findings that a deletion in the NT of the rat brain Cav1.2 α1 subunit (rbcII) inhibited the effect of CaBP1 on CDI (43), it is possible that the NT plays a tethering role for CaBP1 that is important at physiological (low) expression levels of CaBP1. This role could be bypassed by high CaBP1 protein levels accomplished by overexpression with RNA or injection of purified protein. Nevertheless, our current findings indicate that the NT is unlikely to be the site where CaBP1 regulation of CDI cannot be eliminated by CaM, which implicates a potential role for the pCT or the L3 linker in this process.
CaM and CaBP1 have overlapping interaction sites on the pCT of α1C. CaBP1 and CaM interact with the distal pre-IQ and the IQ domains. The latter binds the C-lobes of CaM and CaBP1, and this is where CaBP1 competes with CaM (42, 45). Thus, the IQ domain seems to be a plausible candidate site for mutual competitive effects of CaBP1 and CaM. However, as discussed above, the competition between injected CaM and expressed or injected CaBP1, revealed by our FRET and functional experiments, takes place under low-Ca2+ conditions. This consideration points to the apoCaM anchoring site(s), which may be located mainly in the pre-IQ segment (71), as a plausible site(s) of competition. In sum, further studies are necessary to pinpoint the interactions through which CaBP1 exerts its two effects on CDI.
CaM-CaBP1 Competition in a Living Cell; Quantitative Aspects and Limitations
Calibrated heterologous protein expression was instrumental in studying the interactions between α1C subdomains and CaM or CaBP1, but it failed to provide the molar excess of one of the competing proteins over the other, essential for any comprehensive analysis of competitive regulation. We have overcome this limitation by injecting purified recombinant proteins, which fully recapitulated the known effects of their heterologous expression. Both protein and overexpression still share the drawback of a possible non-homogenous distribution within the cell and buffering by endogenous proteins. Nevertheless, for the injected proteins, the strict dose dependence and saturability of the effects of CaM1234 and CaBP1 indicate proportionality between total injected protein and its concentration in the vicinity of the channel.
We note that analysis of protein interactions in terms of the Hill equation, or a “standard” binding isotherm, is a simplification for two reasons. First, it assumes that molar amount of the “ligand” (e.g. CaM) is significantly higher than that of the “receptor” (α1C) (51). Reassuringly, with the injected protein strategy this is probably justified given our ability to vary the amount of the injected protein in a very wide range. Second, the initial CDI slowing by the injected CaM1234 or CaBP1 is a result of competition with the endogenous CaV1.2-associated CaM. Under these conditions, the dose of the competitor that will produce a 50% maximal effect (EC50) and, correspondingly, its Kd,app, depends on the concentration of endogenous CaM, which is unknown (in general, the effective dose of a competing protein depends on its own Kd but also on the concentration and Kd of the other competitor). This is illustrated in Figs. 5D and 6C for the case of titration of CaM over a constant amount of CaBP1; compare the black lines, which show a fit to data with 2.6 μm CaBP1, and the blue lines, showing simulated data with 26 μm CaBP1. Therefore, the calculated Kd,app values cannot be taken as estimates of real absolute values of Kd.
Notwithstanding these caveats, for a constant level of endogenous CaM, the values of Kd,app for different proteins, which compete with the endogenous CaM for the same site, provide a measure of their relative affinity for this site. Our results show that, with respect to the regulation of kinetics of CDI, CaBP1 has a higher affinity to Cav1.2 than CaM1234 in low-Ca2+ conditions (1.5–2.5 mm intracellular BAPTA). The Kd,app calculated from the direct dose-effect curves was ∼0.8 μm for CaBP1 and about 9 μm for CaM1234. Moreover, Kd,app calculated for CaM from a different set of experiments (the competition with CaBP1 under low-Ca2+ conditions (the apoCaM case)) was 6–8 μm both for the wild-type α1C and the Δ139-α1C mutant (for the CaM-sensitive fraction of CaBP1 effect). The similarity of α1C Kd,app values for apoCaM and the CaM1234 mutant, obtained from different types of measurement, supports the validity of these estimates. In all, our data suggest that the affinity of CaBP1 for Cav1.2 in a living cells is greater than that of apoCaM, enabling regulation of CDI by CaBP1 despite the high cellular levels of CaM and the high affinity of CaM for its binding sites in the pCT (7, 66).
This work was supported by the Fields Center for Cardiovascular Research (to N. D.), United States-Israel Binational Science Foundation Grant 2005340 (to N. D. and A. L.), the Israel Science Foundation (1201/04), and the Deutsch-Israelische Projektkooperation (to J. H.).
- VGCC
- voltage-gated Ca2+ channel
- CaBP1
- Ca2+-binding protein 1
- CaM
- calmodulin
- rCaM
- recombinant CaM
- NT
- N terminus
- CT
- C terminus
- pCT
- proximal C terminus
- CDI
- Ca2+-dependent inactivation
- VDI
- voltage-dependent inactivation
- BAPTA
- 1,2-bis(o-aminophenoxy)ethane-N,N,N′,N′-tetraacetic acid.
REFERENCES
- 1. Walker D., De Waard M. (1998) Subunit interaction sites in voltage-dependent Ca2+ channels. Role in channel function. Trends Neurosci. 21, 148–154 [DOI] [PubMed] [Google Scholar]
- 2. Catterall W. A. (2000) Structure and regulation of voltage-gated Ca2+ channels. Annu. Rev. Cell Dev. Biol. 16, 521–555 [DOI] [PubMed] [Google Scholar]
- 3. Dai S., Hall D. D., Hell J. W. (2009) Supramolecular assemblies and localized regulation of voltage-gated ion channels. Physiol. Rev. 89, 411–452 [DOI] [PMC free article] [PubMed] [Google Scholar]
- 4. Patton D. E., West J. W., Catterall W. A., Goldin A. L. (1993) A peptide segment critical for sodium channel inactivation functions as an inactivation gate in a potassium channel. Neuron 11, 967–974 [DOI] [PubMed] [Google Scholar]
- 5. Cens T., Restituito S., Galas S., Charnet P. (1999) Voltage and calcium use the same molecular determinants to inactivate calcium channels. J. Biol. Chem. 274, 5483–5490 [DOI] [PubMed] [Google Scholar]
- 6. Hering S., Berjukow S., Aczél S., Timin E. N. (1998) Ca2+ channel block and inactivation. Common molecular determinants. Trends Pharmacol. Sci. 19, 439–443 [DOI] [PubMed] [Google Scholar]
- 7. Minor D. L., Jr., Findeisen F. (2010) Progress in the structural understanding of voltage-gated calcium channel (CaV) function and modulation. Channels 4, 459–474 [DOI] [PMC free article] [PubMed] [Google Scholar]
- 8. Soldatov N. M. (2003) Ca2+ channel moving tail. link between Ca2+-induced inactivation and Ca2+ signal transduction. Trends Pharmacol. Sci. 24, 167–171 [DOI] [PubMed] [Google Scholar]
- 9. Tadross M. R., Ben Johny M., Yue D. T. (2010) Molecular endpoints of Ca2+/calmodulin- and voltage-dependent inactivation of CaV1.3 channels. J. Gen. Physiol. 135, 197–215 [DOI] [PMC free article] [PubMed] [Google Scholar]
- 10. Almagor L., Chomsky-Hecht O., Ben-Mocha A., Hendin-Barak D., Dascal N., Hirsch J. A. (2012) The role of a voltage-dependent Ca2+ channel intracellular linker. A structure-function analysis. J. Neurosci. 32, 7602–7613 [DOI] [PMC free article] [PubMed] [Google Scholar]
- 11. Haynes L. P., McCue H. V., Burgoyne R. D. (2012) Evolution and functional diversity of the calcium-binding proteins (CaBPs). Front. Mol. Neurosci. 5, 9. [DOI] [PMC free article] [PubMed] [Google Scholar]
- 12. Lee A., Westenbroek R. E., Haeseleer F., Palczewski K., Scheuer T., Catterall W. A. (2002) Differential modulation of Cav2.1 channels by calmodulin and Ca2+-binding protein 1. Nat. Neurosci. 5, 210–217 [DOI] [PMC free article] [PubMed] [Google Scholar]
- 13. Lautermilch N. J., Few A. P., Scheuer T., Catterall W. A. (2005) Modulation of CaV2.1 channels by the neuronal calcium-binding protein visinin-like protein-2. J. Neurosci. 25, 7062–7070 [DOI] [PMC free article] [PubMed] [Google Scholar]
- 14. Rieke F., Lee A., Haeseleer F. (2008) Characterization of Ca2+-binding protein 5 knockout mouse retina. Invest. Ophthalmol. Vis. Sci. 49, 5126–5135 [DOI] [PMC free article] [PubMed] [Google Scholar]
- 15. Thomsen M. B., Wang C., Ozgen N., Wang H. G., Rosen M. R., Pitt G. S. (2009) Accessory subunit KChIP2 modulates the cardiac L-type calcium current. Circ. Res. 104, 1382–1389 [DOI] [PMC free article] [PubMed] [Google Scholar]
- 16. Fowler M. R., Colotti G., Chiancone E., Higuchi Y., Seidler T., Smith G. L. (2009) Complex modulation of L-type Ca2+ current inactivation by sorcin in isolated rabbit cardiomyocytes. Pflugers Arch. 457, 1049–1060 [DOI] [PubMed] [Google Scholar]
- 17. Shaltiel L., Paparizos C., Fenske S., Hassan S., Gruner C., Rötzer K., Biel M., Wahl-Schott C. A. (2012) Complex regulation of voltage-dependent activation and inactivation properties of retinal voltage-gated CaV1.4 L-type Ca2+ channels by Ca2+-binding protein 4 (CaBP4). J. Biol. Chem. 287, 36312–36321 [DOI] [PMC free article] [PubMed] [Google Scholar]
- 18. Schrauwen I., Helfmann S., Inagaki A., Predoehl F., Tabatabaiefar M. A., Picher M. M., Sommen M., Seco C. Z., Oostrik J., Kremer H., Dheedene A., Claes C., Fransen E., Chaleshtori M. H., Coucke P., Lee A., Moser T., Van Camp G. (2012) A mutation in CaBP2, expressed in cochlear hair cells, causes autosomal-recessive hearing impairment. Am. J. Hum. Genet. 91, 636–645 [DOI] [PMC free article] [PubMed] [Google Scholar]
- 19. Haeseleer F., Sokal I., Verlinde C. L., Erdjument-Bromage H., Tempst P., Pronin A. N., Benovic J. L., Fariss R. N., Palczewski K. (2000) Five members of a novel Ca2+-binding protein (CABP) subfamily with similarity to calmodulin. J. Biol. Chem. 275, 1247–1260 [DOI] [PMC free article] [PubMed] [Google Scholar]
- 20. Wingard J. N., Chan J., Bosanac I., Haeseleer F., Palczewski K., Ikura M., Ames J. B. (2005) Structural analysis of Mg2+ and Ca2+ binding to calcium-binding protein 1 (CaBP1), a neuron-specific regulator of calcium channels. J. Biol. Chem. 280, 37461–37470 [DOI] [PMC free article] [PubMed] [Google Scholar]
- 21. Park S., Li C., Ames J. B. (2011) NMR structure of CaBP1 in a Ca2+-bound closed state. Implications for target recognition. Protein Sci. 20, 1356–1366 [DOI] [PMC free article] [PubMed] [Google Scholar]
- 22. Christel C., Lee A. (2012) Ca2+-dependent modulation of voltage-gated Ca2+ channels. Biochim. Biophys. Acta 1820, 1243–1252 [DOI] [PMC free article] [PubMed] [Google Scholar]
- 23. Qin N., Olcese R., Bransby M., Lin T., Birnbaumer L. (1999) Ca2+-induced inhibition of the cardiac Ca2+ channel depends on calmodulin. Proc. Natl. Acad. Sci. U.S.A. 96, 2435–2438 [DOI] [PMC free article] [PubMed] [Google Scholar]
- 24. Zühlke R. D., Pitt G. S., Deisseroth K., Tsien R. W., Reuter H. (1999) Calmodulin supports both inactivation and facilitation of L-type calcium channels. Nature 399, 159–162 [DOI] [PubMed] [Google Scholar]
- 25. Lee A., Wong S. T., Gallagher D., Li B., Storm D. R., Scheuer T., Catterall W. A. (1999) Ca2+/calmodulin binds to and modulates P/Q-type calcium channels. Nature 399, 155–159 [DOI] [PubMed] [Google Scholar]
- 26. Pate P., Mochca-Morales J., Wu Y., Zhang J. Z., Rodney G. G., Serysheva I. I., Williams B. Y., Anderson M. E., Hamilton S. L. (2000) Determinants for calmodulin binding on voltage dependent calcium channels. J. Biol. Chem. 275, 39786–39792 [DOI] [PubMed] [Google Scholar]
- 27. Peterson B. Z., DeMaria C. D., Adelman J. P., Yue D. T. (1999) Calmodulin is the Ca2+ sensor for Ca2+ -dependent inactivation of L- type calcium channels. Neuron 22, 549–558 [DOI] [PubMed] [Google Scholar]
- 28. Ivanina T., Blumenstein Y., Shistik E., Barzilai R., Dascal N. (2000) Modulation of L-type Ca2+ channels by Gβγ and calmodulin via interactions with N and C termini of α1C. J. Biol. Chem. 275, 39846–39854 [DOI] [PubMed] [Google Scholar]
- 29. Pitt G. S., Zühlke R. D., Hudmon A., Schulman H., Reuter H., Tsien R. W. (2001) Molecular basis of CaM tethering and Ca2+-dependent inactivation of L-type Ca2+ channels. J. Biol. Chem. 276, 30794–30802 [DOI] [PubMed] [Google Scholar]
- 30. Tang W., Halling D. B., Black D. J., Pate P., Zhang J.-Z., Pedersen S., Altschuld R. A., Hamilton S. L. (2003) Apocalmodulin and Ca2+ calmodulin-binding sites on the CaV1.2 channel. Biophys. J. 85, 1538–1547 [DOI] [PMC free article] [PubMed] [Google Scholar]
- 31. Tadross M. R., Dick I. E., Yue D. T. (2008) Mechanism of local and global Ca2+ sensing by calmodulin in complex with a Ca2+ channel. Cell 133, 1228–1240 [DOI] [PMC free article] [PubMed] [Google Scholar]
- 32. Mouton J., Feltz A., Maulet Y. (2001) Interactions of calmodulin with two peptides derived from the C-terminal cytoplasmic domain of the CaV1.2 Ca2+ channel provide evidence for a molecular switch involved in Ca2+-induced inactivation. J. Biol. Chem. 276, 22359–22367 [DOI] [PubMed] [Google Scholar]
- 33. Zühlke R. D., Pitt G. S., Tsien R. W., Reuter H. (2000) Ca2+-sensitive inactivation and facilitation of L-type Ca2+ channels both depend on specific amino acid residues in a consensus calmodulin-binding motif in α1C. J. Biol. Chem. 275, 21121–21129 [DOI] [PubMed] [Google Scholar]
- 34. Erickson M. G., Liang H., Mori M. X., Yue D. T. (2003) FRET two-hybrid mapping reveals function and location of L-type Ca2+ channel CaM preassociation. Neuron 39, 97–107 [DOI] [PubMed] [Google Scholar]
- 35. Kim E. Y., Rumpf C. H., Van Petegem F., Arant R. J., Findeisen F., Cooley E. S., Isacoff E. Y., Minor D. L. (2010) Multiple C-terminal tail Ca2+/CaMs regulate CaV1.2 function but do not mediate channel dimerization. EMBO J. 29, 3924–3938 [DOI] [PMC free article] [PubMed] [Google Scholar]
- 36. Halling D. B., Georgiou D. K., Black D. J., Yang G., Fallon J. L., Quiocho F. A., Pedersen S. E., Hamilton S. L. (2009) Determinants in CaV1 channels that regulate the Ca2+ sensitivity of bound calmodulin. J. Biol. Chem. 284, 20041–20051 [DOI] [PMC free article] [PubMed] [Google Scholar]
- 37. Tippens A. L., Lee A. (2007) Caldendrin, a neuron-specific modulator of Cav1.2 (L-type) Ca2+ channels. J. Biol. Chem. 282, 8464–8473 [DOI] [PubMed] [Google Scholar]
- 38. Romanin C., Gamsjaeger R., Kahr H., Schaufler D., Carlson O., Abernethy D. R., Soldatov N. M. (2000) Ca2+ sensors of L-type Ca2+ channel. FEBS Lett. 487, 301–306 [DOI] [PubMed] [Google Scholar]
- 39. Mori M. X., Erickson M. G., Yue D. T. (2004) Functional stoichiometry and local enrichment of calmodulin interacting with Ca2+ channels. Science 304, 432–435 [DOI] [PubMed] [Google Scholar]
- 40. Peterson B. Z., Lee J. S., Mulle J. G., Wang Y., de Leon M., Yue D. T. (2000) Critical determinants of Ca2+-dependent inactivation within an EF-hand motif of L-type Ca2+ channels. Biophys. J. 78, 1906–1920 [DOI] [PMC free article] [PubMed] [Google Scholar]
- 41. Kim J., Ghosh S., Nunziato D. A., Pitt G. S. (2004) Identification of the components controlling inactivation of voltage-gated Ca2+ channels. Neuron 41, 745–754 [DOI] [PubMed] [Google Scholar]
- 42. Zhou H., Kim S. A., Kirk E. A., Tippens A. L., Sun H., Haeseleer F., Lee A. (2004) Ca2+-binding protein-1 facilitates and forms a postsynaptic complex with Cav1.2 (L-type) Ca2+ channels. J. Neurosci. 24, 4698–4708 [DOI] [PMC free article] [PubMed] [Google Scholar]
- 43. Zhou H., Yu K., McCoy K. L., Lee A. (2005) Molecular mechanism for divergent regulation of Cav1.2 Ca2+ channels by calmodulin and Ca2+-binding protein 1. J. Biol. Chem. 280, 29612–29619 [DOI] [PubMed] [Google Scholar]
- 44. Oz S., Tsemakhovich V., Christel C. J., Lee A., Dascal N. (2011) CaBP1 regulates voltage dependent inactivation and activation of CaV1.2 (L-type) calcium channels. J. Biol. Chem. 286, 13945–13953 [DOI] [PMC free article] [PubMed] [Google Scholar]
- 45. Findeisen F., Minor D. L., Jr. (2010) Structural basis for the differential effects of CaBP1 and calmodulin on CaV1.2 calcium-dependent inactivation. Structure 18, 1617–1631 [DOI] [PMC free article] [PubMed] [Google Scholar]
- 46. Dick I. E., Tadross M. R., Liang H., Tay L. H., Yang W., Yue D. T. (2008) A modular switch for spatial Ca2+ selectivity in the calmodulin regulation of Cav channels. Nature 451, 830–834 [DOI] [PMC free article] [PubMed] [Google Scholar]
- 47. Benmocha A., Almagor L., Oz S., Hirsch J. A., Dascal N. (2009) Characterization of the calmodulin-binding site in the N terminus of CaV1.2. Channels 3, 337–342 [DOI] [PubMed] [Google Scholar]
- 48. Liman E. R., Tytgat J., Hess P. (1992) Subunit stoichiometry of a mammalian K+ channel determined by construction of multimeric cDNAs. Neuron 9, 861–871 [DOI] [PubMed] [Google Scholar]
- 49. Berlin S., Keren-Raifman T., Castel R., Rubinstein M., Dessauer C. W., Ivanina T., Dascal N. (2010) Gαi and Gβγ jointly regulate the conformations of a Gβγ effector, the neuronal G-protein activated K+ channel (GIRK). J. Biol. Chem. 285, 6179–6185 [DOI] [PMC free article] [PubMed] [Google Scholar]
- 50. Hayashi N., Matsubara M., Takasaki A., Titani K., Taniguchi H. (1998) An expression system of rat calmodulin using T7 phage promoter in Escherichia coli. Protein Expr. Purif. 12, 25–28 [DOI] [PubMed] [Google Scholar]
- 51. Weiss J. N. (1997) The Hill equation revisited. Uses and misuses. FASEB J. 11, 835–841 [PubMed] [Google Scholar]
- 52. Berlin S., Tsemakhovich V. A., Castel R., Ivanina T., Dessauer C. W., Keren-Raifman T., Dascal N. (2011) Two distinct aspects of coupling between Gαi and G protein-activated K+ channel (GIRK) revealed by fluorescently labeled Gαi3 subunits. J. Biol. Chem. 286, 33223–33235 [DOI] [PMC free article] [PubMed] [Google Scholar]
- 53. Zheng J., Zagotta W. N. (2004) Stoichiometry and assembly of olfactory cyclic nucleotide-gated channels. Neuron 42, 411–421 [DOI] [PubMed] [Google Scholar]
- 54. Zheng J. (2006) Spectroscopy-based quantitative fluorescence resonance energy transfer analysis. Methods Mol. Biol. 337, 65–77 [DOI] [PubMed] [Google Scholar]
- 55. Takanishi C. L., Bykova E. A., Cheng W., Zheng J. (2006) GFP-based FRET analysis in live cells. Brain Res. 1091, 132–139 [DOI] [PubMed] [Google Scholar]
- 56. Philips M. R. (2005) Compartmentalized signalling of Ras. Biochem. Soc. Trans. 33, 657–661 [DOI] [PubMed] [Google Scholar]
- 57. Pellman D., Garber E. A., Cross F. R., Hanafusa H. (1985) An N-terminal peptide from p60src can direct myristylation and plasma membrane localization when fused to heterologous proteins. Nature 314, 374–377 [DOI] [PubMed] [Google Scholar]
- 58. James J. R., Oliveira M. I., Carmo A. M., Iaboni A., Davis S. J. (2006) A rigorous experimental framework for detecting protein oligomerization using bioluminescence resonance energy transfer. Nat. Methods 3, 1001–1006 [DOI] [PubMed] [Google Scholar]
- 59. Lakowicz J. R. (2006) Principles of Fluorescence Spectroscopy, 3d Ed., Chapter 13, Springer-Verlag New York Inc., New York [Google Scholar]
- 60. Richter J. D., Smith L. D. (1981) Differential capacity for translation and lack of competition between mRNAs that segregate to free and membrane-bound polysomes. Cell 27, 183–191 [DOI] [PubMed] [Google Scholar]
- 61. Xia X. M., Fakler B., Rivard A., Wayman G., Johnson-Pais T., Keen J. E., Ishii T., Hirschberg B., Bond C. T., Lutsenko S., Maylie J., Adelman J. P. (1998) Mechanism of calcium gating in small-conductance calcium-activated potassium channels. Nature 395, 503–507 [DOI] [PubMed] [Google Scholar]
- 62. DeMaria C. D., Soong T. W., Alseikhan B. A., Alvania R. S., Yue D. T. (2001) Calmodulin bifurcates the local Ca2+ signal that modulates P/Q-type Ca2+ channels. Nature 411, 484–489 [DOI] [PubMed] [Google Scholar]
- 63. Sanabria H., Digman M. A., Gratton E., Waxham M. N. (2008) Spatial diffusivity and availability of intracellular calmodulin. Biophys. J. 95, 6002–6015 [DOI] [PMC free article] [PubMed] [Google Scholar]
- 64. Few A. P., Lautermilch N. J., Westenbroek R. E., Scheuer T., Catterall W. A. (2005) Differential regulation of CaV2.1 channels by calcium-binding protein 1 and visinin-like protein-2 requires N-terminal myristoylation. J. Neurosci. 25, 7071–7080 [DOI] [PMC free article] [PubMed] [Google Scholar]
- 65. Soldatov N. M., Zühlke R. D., Bouron A., Reuter H. (1997) Molecular structures involved in L-type calcium channel inactivation. Role of the carboxyl-terminal region encoded by exons 40–42 in α1C subunit in the kinetics and Ca2+ dependence of inactivation. J. Biol. Chem. 272, 3560–3566 [DOI] [PubMed] [Google Scholar]
- 66. Van Petegem F., Chatelain F. C., Minor D. L., Jr. (2005) Insights into voltage-gated calcium channel regulation from the structure of the CaV1.2 IQ domain-Ca2+/calmodulin complex. Nat. Struct. Mol. Biol. 12, 1108–1115 [DOI] [PMC free article] [PubMed] [Google Scholar]
- 67. Fallon J. L., Halling D. B., Hamilton S. L., Quiocho F. A. (2005) Structure of calmodulin bound to the hydrophobic IQ domain of the cardiac CaV1.2 calcium channel. Structure 13, 1881–1886 [DOI] [PubMed] [Google Scholar]
- 68. Mori M. X., Vander Kooi C. W., Leahy D. J., Yue D. T. (2008) Crystal structure of the CaV2 IQ domain in complex with Ca2+/calmodulin. High-resolution mechanistic implications for channel regulation by Ca2+. Structure 16, 607–620 [DOI] [PMC free article] [PubMed] [Google Scholar]
- 69. Fallon J. L., Baker M. R., Xiong L., Loy R. E., Yang G., Dirksen R. T., Hamilton S. L., Quiocho F. A. (2009) Crystal structure of dimeric cardiac L-type calcium channel regulatory domains bridged by Ca2+-calmodulins. Proc. Natl. Acad. Sci. U.S.A. 106, 5135–5140 [DOI] [PMC free article] [PubMed] [Google Scholar]
- 70. Lee A., Zhou H., Scheuer T., Catterall W. A. (2003) Molecular determinants of Ca2+/calmodulin-dependent regulation of Cav2.1 channels. Proc. Natl. Acad. Sci. U.S.A. 100, 16059–16064 [DOI] [PMC free article] [PubMed] [Google Scholar]
- 71. Halling D. B., Aracena-Parks P., Hamilton S. L. (2006) Regulation of voltage-gated Ca2+ channels by calmodulin. Sci. STKE 2006, er1. [DOI] [PubMed] [Google Scholar]