

Abstract
AIM: To compare lymphocyte subsets between healthy controls and alcoholics with liver disease.
METHODS: The patient cohort for this study included individuals who were suspected to have alcoholic liver disease (ALD) and who had undergone liver biopsy (for disease grading and staging, doubts about diagnosis, or concurrent liver disease; n = 56). Normal controls included patients who were admitted for elective cholecystectomy due to non-complicated gallstones (n = 27). Formalin-fixed, paraffin-embedded liver biopsy specimens were sectioned and stained with hematoxylin and eosin and Perls’ Prussian blue. The non-alcoholic steatohepatitis score was used to assess markers of ALD. Lymphocyte population subsets were determined by flow cytometry. T lymphocytes were identified (CD3+), and then further subdivided into CD4+ or CD8+ populations. B lymphocytes (CD19+) and natural killer (NK) cell numbers were also measured. In addition to assessing lymphocyte subpopulation differences between ALD patients and controls, we also compared subsets of alcoholic patients without cirrhosis or abstinent cirrhotic patients to normal controls.
RESULTS: The patient cohort primarily consisted of older men. Active alcoholism was present in 66.1%. Reported average daily alcohol intake was 164.9 g and the average lifetime cumulative intake was 2211.6 kg. Cirrhosis was present in 39.3% of the patients and 66.1% had significant fibrosis (perisinusoidal and portal/periportal fibrosis, bridging fibrosis, or cirrhosis) in their liver samples. The average Mayo end-stage liver disease score was 7.6. No hereditary hemochromatosis genotypes were found. ALD patients (n = 56) presented with significant lymphopenia (1.5 × 10⁹/L ± 0.5 × 10⁹/L vs 2.1 × 10⁹/L ± 0.5 × 10⁹/L, P < 0.0001), due to a decrease in all lymphocyte subpopulations, except for NK lymphocytes: CD3+ (1013.0 ± 406.2/mm3 vs 1523.0 ± 364.6/mm3, P < 0.0001), CD4+ (713.5 ± 284.7/mm3 vs 992.4 ± 274.7/mm3, P < 0.0001), CD8+ (262.3 ± 140.4/mm3 vs 478.9 ± 164.6/mm3, P < 0.0001), and CD19+ (120.6 ± 76.1/mm3 vs 264.6 ± 88.0/mm3, P < 0.0001). CD8+ lymphocytes suffered the greatest reduction, as evidenced by an increase in the CD4+/CD8+ ratio (3.1 ± 1.3 vs 2.3 ± 0.9, P = 0.013). This ratio was associated with the stage of fibrosis on liver biopsy (rs = 0.342, P = 0.01) and with Child-Pugh score (rs = 0.482, P = 0.02). The number of CD8+ lymphocytes also had a positive association with serum ferritin levels (rs = 0.345, P = 0.009). Considering only patients with active alcoholism but not cirrhosis (n = 27), we found similar reductions in total lymphocyte counts (1.8 × 10⁹/L ± 0.3 × 10⁹/L vs 2.1 × 10⁹/L ± 0.5 × 10⁹/L, P = 0.018), and in populations of CD3+ (1164.7 ± 376.6/mm3 vs 1523.0 ± 364.6/mm3, P = 0.001), CD4+ (759.8 ± 265.0/mm3 vs 992.4 ± 274.7/mm3, P = 0.003), CD8+ (330.9 ± 156.3/mm3 vs 478.9 ± 164.6/mm3, P = 0.002), and CD19+ (108.8 ± 64.2/mm3 vs 264.6 ± 88.0/mm3, P < 0.0001). In these patients, the CD4+/CD8+ ratio and the number of NK lymphocytes was not significantly different, compared to controls. Comparing patients with liver cirrhosis but without active alcohol consumption (n = 11), we also found significant lymphopenia (1.3 × 10⁹/L ± 0.6 × 10⁹/L vs 2.1 × 10⁹/L ± 0.5 × 10⁹/L, P < 0.0001) and decreases in populations of CD3+ (945.5 ± 547.4/mm3 vs 1523.0 ± 364.6/mm3, P = 0.003), CD4+ (745.2 ± 389.0/mm3 vs 992.4 ± 274.7/mm3, P = 0.032), CD8+ (233.9 ± 120.0/mm3 vs 478.9 ± 164.6/mm3, P < 0.0001), and CD19+ (150.8 ± 76.1/mm3 vs 264.6 ± 88.0/mm3, P = 0.001). The NK lymphocyte count was not significantly different, but, in this group, there was a significant increase in the CD4+/CD8+ ratio (3.5 ± 1.3 vs 2.3 ± 0.9, P = 0.01).
CONCLUSION: All patient subsets presented with decreased lymphocyte counts, but only patients with advanced fibrosis presented with a significant increase in the CD4+/CD8+ ratio.
Keywords: Lymphocyte subsets, Flow cytometry, Alcoholism, Alcoholic liver disease, Liver fibrosis, Liver biopsy, HFE gene
INTRODUCTION
Alcohol is the third highest cause of disease burden, worldwide, and the second highest cause in Europe. Alcohol abuse is inseparable from several social problems (e.g., violence, abuse, children negligence, unemployment, and lost workdays)[1,2]. The World Health Organization estimates that worldwide alcohol ingestion is responsible for approximately 2.5 million deaths per year. Of those, 320 000 deaths are among young people aged 15 to 29 years old[1].
Despite alcoholism being frequently associated with cirrhosis and liver failure, only 30%-35% of chronic alcoholics develop liver disease (steatohepatitis and/or cirrhosis)[3,4] and only 10%-15% have documented cirrhosis on post mortem examination[5]. It is still not clear why this is, but certainly alcohol is a necessary factor for alcoholic liver cirrhosis[6].
It is usual to consider classical alcoholic liver disease (ALD) using various histological sub-types: steatosis, steatohepatitis, cirrhosis, and possibly hepatocellular carcinoma. Normally, two or more such sub-types coexist, representing the spectrum of liver response to alcohol injury. This division is useful for understanding ALD as a continuous evolution and, above all, to understand its spectrum of reversibility, as the disease is highly treatable at the point of pure steatosis but almost impossible at the point of cirrhosis[7-9].
As a disease involving liver inflammation, the role of lymphocytes in ALD has been the subject for different lines of research. Lymphocytes (together with neutrophils, macrophages, and plasma cells) are present in alcoholic steatohepatitis lobular inflammatory infiltrate[10]. It is widely accepted that immune system activation is relevant for alcoholic steatohepatitis pathogenesis and ALD progression. The causative endotoxins are likely lipopolysaccharides (LPS) secreted from Gram-negative bacteria, as LPS blood levels are increased in ALD. The increase has been attributed to jejunal bacterial overgrowth and to increased intestinal wall permeability caused by alcohol[11].
Portal blood LPS has been shown to stimulate liver Kupffer cells, by the direct activation of two cellular receptors, TLR-4 and CD14[12,13]. This activation leads to a downstream cascade of intracellular events, namely the activation of nuclear factor kappa B, activator protein 1, and interferon regulatory factors, and the alteration of pro-caspases 3 and 8 and c-Jun N-terminal kinase. Those events lead to a local immune response and the production of tumor necrosis factor alpha, interleukins 1β, 6, 8, 12 and 18, prostaglandins E2 and D, transforming growth factor β, and leukotrienes. All of these changes cause polymorphonuclear neutrophil recruitment, increased production of cellular adhesion molecules, increased oxidative stress, and activation of hepatic stellate cells (HSC), leading to increased collagen deposition[13-16]. Humoral immunity may also play a role in ALD pathogenesis. Several autoantibodies, mostly antiphospholipid but also anti-nuclear, anti- double or -single stranded DNA (anti-dsDNA/ssDNA), and anti-lymphocytes, can be detected in 25%-60% of ALD patients[17-21].
The oxidative stress caused by alcohol metabolism can damage several cellular structures and trigger a process similar to idiosyncratic toxic hepatitis. In this process, a toxic metabolite forms haptens, which are presented by antigen-presenting cells to lymphocytes. These modified protein fragments can induce T cell clones, which then recognize self and non-self modified proteins and activate B cells. The newly activated B cells are then also able to produce immunoglobulins directed both to haptens and to native proteins[22].
Despite this immune deregulation, T lymphocyte activation and antigen-presenting cells are impaired in chronic alcoholism, leading to a subdued response to bacterial and viral infections. There is often an increased incidence of tuberculosis, pneumonia, and an increased susceptibility to human immunodeficiency virus and hepatitis c virus (HCV) infections in alcoholic patients. Alcohol also alters serum immunoglobulin levels, quantitative relations between the several lymphocyte populations, endocytic activity, and cytokine production by phagocytic polymorphonuclear cells[23,24].
The human hemochromatosis, or HFE, protein and its encoding gene were uncovered in 1996, after researchers noticed that the mutation 845G→A in HFE (then named HLA-H) was homozygous in 80% of patients with hereditary hemochromatosis. This mutation caused the replacement of a cysteine by a tyrosine in position 282 of the HFE protein, then named HFE-C282Y[25]. Other common HFE mutations are H63D and S65C. Interpreting the presence of these mutations requires some caution. For instance, H63D homozygotes are not at risk for iron overload and the S65C allele only seems to have relevance when it is inherited with a heterozygous C282Y mutation. In these instances, it appears to worsen iron overload[26]. Consequently, the relationship between HFE mutations and iron overload/ALD progression has been controversial[27,28].
The aim of this study was to compare the lymphocyte subsets between ALD patients and healthy controls. We also compared lymphocyte populations between ALD patient subgroups, namely those with or without active alcoholism and with or without significant fibrosis.
MATERIALS AND METHODS
Both Tondela-Viseu Hospital Centre and the Ethics Committee of the Faculty of Medicine of University of Coimbra approved the study design, which conformed to the ethical guidelines of the 1975 Declaration of Helsinki.
Study population
Patients were recruited from the Liver Diseases Outpatient Consultation at Tondela-Viseu Hospital Centre. The cohort consisted of those patients with suspected ALD who had undergone liver biopsy (for disease grading and staging, doubts about diagnosis, or the presence of concurrent liver disease). They were selected with the following inclusion criteria: aged 18- to 80-year-old; male or female; liver biopsy compatible with alcoholic liver disease; with or without active alcohol consumption; no upper gastrointestinal bleeding in the previous three months; serum ferritin above normal inferior limits; without other relevant liver or systemic disease; and willing to give informed written consent. Fifty-six patients were enrolled in total.
As normal controls, we approached patients who had been admitted for elective cholecystectomy due to non-complicated gallstones. A small liver sample was collected during surgery for another study. The inclusion criteria were: male or female; alcohol consumption lower than 20 g/d in women and 40 g/d in men; aged between 18- and 80-year-old; without anemia and with serum ferritin above inferior limits of normality; with alanine aminotransferase (ALT), aspartate transaminase (AST), γ-glutamyl transpeptidase (GGT) and alkaline phosphatase (ALP) lower than three times the upper normal limit; without other liver or systemic relevant diseases; without evidence of inflammation, as measured by C-reactive protein (CRP < 2.5 mg/dL); and willing to give informed written consent. Twenty-seven controls were enrolled in total.
Histopathologic evaluation
Liver tissue samples were collected, fixed in 10% formalin buffer, and embedded in paraffin. Tissue sections were cut and stained with hematoxylin and eosin and Perls’ Prussian blue. Since a validated histological score for ALD does not exist, we used an adaption from the non-alcoholic steatohepatitis score[29]. A semi-quantitative evaluation was performed to measure several parameters, including steatosis (absent, light, moderate, or severe), necroinflammatory activity (absent, light, moderate, or severe), fibrosis (absent, periportal or perisinusoidal fibrosis, periportal and perisinusoidal fibrosis, bridging fibrosis, or cirrhosis) and iron stores grade (with Perls’ coloration and evaluation using Scheuer’s scale).
Laboratory and other evaluations
Patients and controls underwent routine laboratory evaluations for liver diseases, including complete blood counts, estimations of coagulation [by the international normalized ratio (INR)], glucose, kidney function, aminotransferases (ALT, AST), GGT, ALP, CRP, serological markers for HBV and HCV infections, ceruloplasmin, α1-antitrypsin, serum iron, ferritin, and transferrin saturation measurements. Also, the model for end-stage liver disease (MELD) and Child-Pugh scores were calculated. All patients also had a previous liver ultrasound evaluation.
HFE genotypes were evaluated with Hemochromatosis Strip Assay A (Vienna Lab, Vienna, Austria). This test also detects some very rare HFE mutations (including E168Q, E168X, V59M, H63H, P160delC, Q127H, Q283P, V53M, and W164X), as well as ferroportin 1 and transferrin receptor type 2 mutations.
Lymphocyte subsets were determined by flow cytometry, using an EPICS XL-MCL (Beckman Coulter) cytometer. T lymphocytes were identified (CD3+), and then subdivided into CD4+ or CD8+ populations. B lymphocytes (CD19+) and natural killer (NK) cells numbers were also measured.
Statistical analysis
Statistical analysis were performed using SPSS Statistics Data Editor 20 software (IBM, Armonk, NY). Groups were characterized using descriptive statistics, means, standard deviations, and percentages. Categorical variables were analyzed by the χ2 test (with Yates continuity correction or with Fisher’s exact test, when appropriate). Paired parametric numerical variables were analyzed for normal distribution, using the Shapiro-Wilk test, and then the differences between two sampled means was assessed for statistical significance using the Student’s t test or the non-parametrical Mann-Whitney U test for non-normally distributed variables. Correlations between variables were evaluated with Spearman correlation coefficient. All P values were two-sided and a P < 0.05 was considered to be statistically significant.
RESULTS
The clinical and laboratory comparison between ALD patients and healthy controls is shown in Table 1. Patients within the ALD cohort were slightly older and were predominantly men. Active alcoholism (defined as active ingestion of alcoholic beverages) was documented for 66.1% of the patients, who reported an average daily alcohol intake of 164.9 g and an average lifetime cumulative intake of 2211.6 kg. Cirrhosis was present in 39.3% of the patients and 66.1% of them had significant fibrosis (as evidenced by perisinusoidal and portal/periportal fibrosis, bridging fibrosis, or cirrhosis) on liver samples. The histological findings for patients’ liver biopsies are shown in Table 2. The average MELD score was 7.6 and no hereditary hemochromatosis genotypes were found. The prevalence of HFE mutations was not significantly different between cases and controls.
Table 1.
Aetiology and clinical presentation of Budd-Chiari syndrome patients at baseline
| All patients | Subgroups | ||
| Medical therapy only | TIPS | ||
| (n = 21) | (n = 7) | (n = 14) | |
| Male/female | 6/15 | 3/4 | 3/11 |
| Age (yr) at first contact, median (range) | 40 (17-66) | 41 (17-64) | 38 (20-66) |
| Aetiology, n (%) | |||
| Thrombophilia1 | 7 (33) | 2 | 5 |
| Protein C deficiency | 1 (5) | 0 | 1 |
| Protein S deficiency | 1 (5) | 1 | 0 |
| Factor V leiden mutation | 1 (5) | 1 | 0 |
| Hyperhomocysteinemia | 2 (10) | 0 | 2 |
| Paroxysmal nocturnal haemoglobinuria | 2 (10) | 0 | 2 |
| Myeloproliferative disorder | 4 (19) | 2 | 2 |
| Polycythemia vera | 4 (19) | 2 | 2 |
| Other | 4 (19) | 4 | 0 |
| Diabetic ketoacidosis | 3 (14) | 3 | 0 |
| Angio leiomyosarcoma in caval vena | 1 (5) | 1 | 0 |
| Unknown2 | 7 (33) | 0 | 7 |
| More than one predisposing risk factors | 1 (5)3 | 13 | 0 |
| Clinical presentation, n (%) | |||
| Ascites | 15 (71) | 3 | 12 |
| Abdominal pain | 14 (67) | 6 | 8 |
| Hepatomegaly | 11 (52) | 4 | 7 |
| Jaundice | 1 (5) | 0 | 1 |
| Hepatic encephalopathy | 1 (5) | 0 | 1 |
| Variceal bleeding | 0 | 0 | 0 |
13 patients were screened for thrombophilic disorders;
6 of 7 with unknown risk factors were screened for thrombophilic disorders with negative result;
This patient suffered from polycythemia vera and had a Factor V Leiden mutation. TIPS: Transjugular intrahepatic portosystemic shunt.
Table 2.
Histological findings on liver biopsy n (%)
| Fibrosis | |
| Absent | 8 (14.3) |
| Periportal or perisinusoidal | 4 (7.1) |
| Periportal and perisinusoidal | 7 (12.5) |
| Bridging fibrosis | 15 (26.8) |
| Cirrhosis | 22 (39.3) |
| Steatosis | |
| Absent | 14 (25) |
| Mild (< 25%) | 33 (58.9) |
| Moderate (25%-50%) | 7 (12.5) |
| Severe (> 50%) | 2 (3.6) |
| Necroinflammatory activity | |
| Absent | 21 (37.5) |
| Mild | 19 (33.9) |
| Moderate | 11 (19.6) |
| Severe | 5 (8.9) |
| Iron liver stores (Scheuer's Scale on Perls's stain) | |
| Absent | 32 (57.1) |
| Grade 1 | 11 (19.6) |
| Grade 2 | 9 (16.1) |
| Grade 3 | 3 (5.4) |
| Grade 4 | 1 (1.8) |
Despite the difference in sex distribution, hemoglobin values were slightly higher in the control group, albeit not statistically significant. The number of red blood cells was lower in ALD patients, which was related to a significantly higher mean corpuscular volume. The number of platelets was lower in the ALD group. No significant differences were found concerning kidney function and CRP values.
While the total leukocyte and neutrophil numbers were not significantly different between cases and controls, the total lymphocyte count was significantly lower in the ALD group (1.5 × 10⁹/L ± 0.5 × 10⁹/L vs 2.1 × 10⁹/L ± 0.5 × 10⁹/L, P < 0.0001). Similarly, all lymphocyte subsets were significantly lower, except for NK cells (Figure 1): CD3+ (1013.0 ± 406.2/mm3 vs 1523.0 ± 364.6/mm3, P < 0.0001), CD4+ (713.5 ± 284.7/mm3 vs 992.4 ± 274.7/mm3, P < 0.0001), CD8+ (262.3 ± 140.4/mm3 vs 478.9 ± 164.6/mm3, P < 0.0001), CD19+ (120.6 ± 76.1/mm3 vs 264.6 ± 88.0/mm3, P < 0.0001). This reduction was proportionally higher in CD8+ lymphocytes, as evidenced by an increased CD4+/CD8+ ratio (3.1 ± 1.3 vs 2.3 ± 0.9, P = 0.013).
Figure 1.
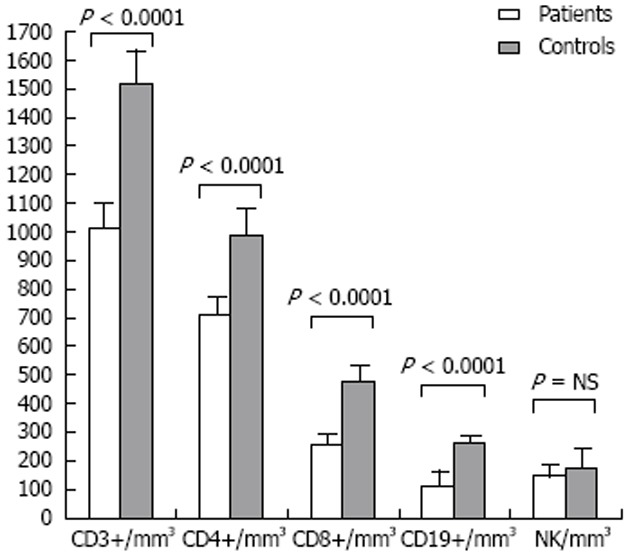
Lymphocyte subsets: All patients vs normal controls. NK: Natural killer; NS: Not significant.
In other laboratory parameters, significant differences were found for levels of INR, alkaline phosphatase, GGT, aminotransferases, bilirubin, all classes of immunoglobulins, and ferritin. There was a trend for lower serum albumin levels and higher transferrin saturation in most cases of ALD. All of these laboratory abnormalities have been previously associated with ALD.
Considering ALD patients only, we noted a few additional associations. First, in terms of associations to fibrosis, that the CD4+/CD8+ ratio (rs = 0.342, P = 0.01) was positively associated and that total lymphocyte numbers were negatively associated (rs = -0.398, P = 0.002) with the grade of fibrosis. Second, that an increased CD4+/CD8+ ratio was correlated with the Child-Pugh score (rs = 0.482, P = 0.02). Third, that the CD8+ lymphocyte count had a positive association with serum ferritin levels (rs = 0.345, P = 0.009).
We went on to divide ALD patients into subsets, in order to get more homogeneous groups that we could compare to normal controls. If we considered only patients with active ingestion of alcoholic beverages, but without cirrhosis (Table 3), we continued to observe a significant lymphopenia (1.8 × 10⁹/L ± 0.3 × 10⁹/L vs 2.1 × 10⁹/L ± 0.5 × 10⁹/L, P = 0.018), which was caused by lower numbers in all lymphocyte subsets except for NK cells (Figure 2A): CD3+ (1164.7 ± 376.6/mm3 vs 1523.0 ± 364.6/mm3, P = 0.001), CD4+ (759.8 ± 265.0/mm3 vs 992.4 ± 274.7/mm3, P = 0.003), CD8+ (330.9 ± 156.3/mm3 vs 478.9 ± 164.6/mm3, P = 0.002), and CD19+ (108.8 ± 64.2/mm3 vs 264.6 ± 88.0/mm3, P < 0.0001). However, in this group, the CD4+/CD8+ ratio was not significantly different when compared to normal controls.
Table 3.
Clinical and laboratory comparison between alcoholic liver disease cases with active alcoholism vs controls with no cirrhosis
| Patients (n = 26) | Controls (n = 27) | P value | |
| Age (yr) | 44.4 ± 14.4 | 47.4 ± 14.4 | |
| Men (%) | 88.5 | 14.8 | <0.0001 |
| WBC (× 109/L) | 6.9 ± 1.8 | 6.1 ± 1.4 | NS |
| Neutrophils (× 109/L) | 4.3 ± 1.5 | 3.4 ± 1.2 | 0.011 |
| RBC (× 1012/L) | 4.1 ± 0.7 | 4.5 ± 0.4 | NS |
| Hemoglobin (g/L) | 14.0 ± 4.0 | 13.9 ± 1.2 | NS |
| MCV (fL) | 99.9 ± 5.9 | 90.8 ± 4.0 | <0.0001 |
| Platelets (× 109/L) | 204.7 ± 84.6 | 231.0 ± 36.0 | NS |
| INR | 1.1 ± 0.2 | 1.0 ± 0.1 | NS |
| Creatinin (mg/dL | 0.9 ± 0.2 | 0.8 ± 0.1 | NS |
| Albumin (g/dL) | 4.0 ± 0.5 | 3.9 ± 0.6 | NS |
| Albumin/globulin ratio | 1.4 ± 0.3 | 1.4 ± 0.3 | NS |
| Alkaline phosphatase (UI/dL) | 102.3 ± 74.1 | 68.3 ± 14.0 | NS |
| GGT (UI/dL) | 297.8 ± 33.1 | 37.9 ± 33.1 | <0.0001 |
| ALT (UI/dL) | 55.8 ± 41.6 | 29.4 ± 15.3 | <0.0001 |
| AST (UI/dL) | 72.2 ± 52.8 | 25.1 ± 7.9 | <0.0001 |
| Total bilirubin (mg/dL) | 1.1 ± 0.6 | 0.7 ± 0.3 | 0.027 |
| CRP (mg/dL) | 1.1 ± 2.0 | 0.7 ± 0.7 | NS |
| Lymphocyte Subsets | |||
| Lymphocytes (× 109/L) | 1.8 ± 0.3 | 2.1 ± 0.5 | 0.018 |
| CD3+ lymphocytes (/mm3) | 1164.7 ± 376.6 | 1523.0 ± 364.6 | 0.001 |
| CD4+ lymphocytes (/mm3) | 759.8 ± 265.0 | 992.4 ± 274.7 | 0.003 |
| CD8+ lymphocytes (/mm3) | 330.9 ± 156.3 | 478.9 ± 164.6 | 0.002 |
| CD4+/CD8+ ratio | 2.5 ± 1.1 | 2.3 ± 0.9 | NS |
| CD19+ lymphocytes (/mm3) | 107.8 ± 64.2 | 264.6 ± 88.0 | <0.0001 |
| NK lymphocytes (/mm3) | 180.2 ± 169.0 | 178.7 ± 210.0 | NS |
WBC: White blood cell; RBC: Right blood cell; MCV: Mean cell volume; INR: International normalized ratio; GGT: γ-glutamyl transpeptidase; ALT: Alanine aminotransferase; AST: Aspartate transaminase; CRP: C-reactive protein; NK: Natural killer; NS: Not significant.
Figure 2.
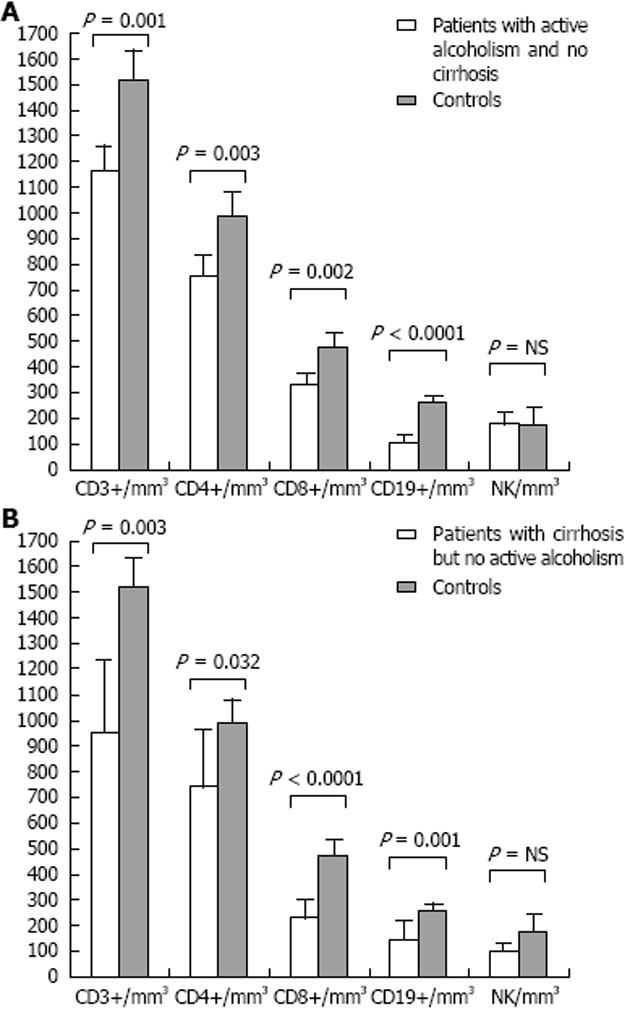
Lymphocyte subsets. A: Patients with active alcoholism/without cirrhosis vs normal controls; B: Patients with cirrhosis but no active alcoholism vs normal controls. NK: Natural killer; NS: Not significant.
We performed one more analysis and considered only cases with documented cirrhosis but without active alcoholism (Table 4). Compared to normal controls, lymphopenia was again evident (1.3 × 10⁹/L ± 0.6 × 10⁹/L vs 2.1 × 10⁹/L ± 0.5 × 10⁹/L, P < 0.0001; Figure 2B), at the expense of all lymphocyte subsets except for NK cells: CD3+ (945.5 ± 547.4/mm3 vs 1523.0 ± 364.6/mm3, P = 0.003), CD4+ (745.2 ± 389.0/mm3 vs 992.4 ± 274.7/mm3, P = 0.032), CD8+ (233.9 ± 120.0/mm3 vs 478.9 ± 164.6/mm3, P < 0.0001), and CD19+ (150.8 ± 76.1/mm3 vs 264.6 ± 88.0/mm3, P = 0.001). A significant increase in the CD4+/CD8+ ratio was also evident in this group of patients with advanced fibrosis (3.5 ± 1.3 vs 2.3 ± 0.9, P = 0.01).
Table 4.
Clinical and laboratory comparison between alcoholic liver disease cases with cirrhosis but no active alcoholism and controls
| Patients (n== = 11) | Controls (n = 27) | P value | |
| Age (yr) | 56.8 ± 9.0 | 47.4 ± 14.4 | 0.03 |
| Men (%) | 100 | 14.8 | <0.0001 |
| MELD score | 10.5 ± 4.6 | - | |
| WBC (× 109/L) | 5.4 ± 2.5 | 6.1 ± 1.4 | NS |
| Neutrophils (× 109/L) | 3.4 ± 2.0 | 3.4 ± 1.2 | NS |
| RBC (× 1012/L) | 4.5 ± 0.4 | 4.5 ± 0.4 | 0.005 |
| Hemoglobin (g/L) | 12.9 ± 2.1 | 13.9 ± 1.2 | NS |
| MCV (fL) | 97.0 ± 6.0 | 90.8 ± 4.0 | 0.001 |
| Platelets (× 109/L) | 103.5 ± 39.4 | 231.0 ± 36.0 | <0.0001 |
| INR | 1.4 ± 0.3 | 1.0 ± 0.1 | <0.0001 |
| Creatinin (mg/dL) | 0.9 ± 0.3 | 0.8 ± 0.1 | NS |
| Albumin (g/dL) | 3.4 ± 0.7 | 3.9 ± 0.6 | 0.003 |
| Albumin/globulin ratio | 0.9 ± 0.3 | 1.4 ± 0.3 | <0.0001 |
| Alkaline phosphatase (UI/dL) | 124.9 ± 32.6 | 68.3 ± 14.0 | NS |
| GGT (UI/dL) | 84.2 ± 55.5 | 37.9 ± 33.1 | 0.005 |
| ALT (UI/dL) | 32.6 ± 7.6 | 29.4 ± 15.3 | NS |
| AST (UI/dL) | 46.9 ± 10.9 | 25.1 ± 7.9 | <0.0001 |
| Total bilirubin (mg/dL) | 2.2 ± 2.0 | 0.7 ± 0.3 | <0.0001 |
| CRP (mg/dL) | 1.1 ± 1.5 | 0.7 ± 0.7 | NS |
| Lymphocyte Subsets | |||
| Lymphocytes (×109/L) | 1.3 ± 0.6 | 2.1 ± 0.5 | <0.0001 |
| CD3+ lymphocytes (/mm3) | 954.5 ± 547.4 | 1523.0 ± 364.6 | 0.003 |
| CD4+ lymphocytes (/mm3) | 745.2 ± 389.0 | 992.4 ± 274.7 | 0.032 |
| CD8+ lymphocytes (/mm3) | 233.9 ± 120.0 | 478.9 ± 164.6 | <0.0001 |
| CD4+/CD8+ ratio | 3.5 ± 1.3 | 2.3 ± 0.9 | 0.01 |
| CD19+ lymphocytes (/mm3) | 150.8 ± 108.4 | 264.6 ± 88.0 | 0.001 |
| NK lymphocytes (/mm3) | 99.5 ± 54.5 | 178.7 ± 210.0 | NS |
MELD: Model for end-stage liver disease; WBC: White blood cell; RBC: Right blood cell; MCV: Mean cell volume; INR: International normalized ratio; GGT: γ-glutamyl transpeptidase; ALT: Alanine aminotransferase; AST: Aspartate transaminase; CRP: C-reactive protein; NK: Natural killer; NS: Not significant.
DISCUSSION
While the role of lymphocytes in ALD pathogenesis has been the subject of different lines of research, the results and ultimate interpretations are discrepant. Lymphopenia and an increased CD4+/CD8+ ratio in patients with liver failure due to alcoholic cirrhosis was first described by Couzigou et al[30]. A later paper reported no alterations in the total lymphocyte count, but did find an increased CD4+/CD8+ ratio in ALD patients[31]. Other studies have identified significant lymphopenia with decreased numbers of CD4+ and CD8+ populations, in both alcohol abusers without liver disease[32] and in patients with alcoholic cirrhosis[33,34]. A reduction in CD3+ and CD4+ T lymphocytes was also found to correlate with the severity of liver cirrhosis severity[35]. Despite these studies, Cook et al[36] found an increase in the number of T lymphocytes in alcoholic patients without liver disease, mainly due to an increased number of activated CD8+ cells. Similarly, Arosa et al[37] reported a relative increase of some CD8+ lymphocyte subtypes in alcoholic patients compared to healthy controls, however no significant differences were described for total CD4+ or CD8+ T lymphocyte counts.
Apart from alterations in lymphocyte count, alcohol appears to cause functional changes to lymphocyte subsets[38,39]. Th17 lymphocytes, a new CD4+ effector subpopulation that has been recently described, are more populous in ALD and their absolute numbers are associated with fibrosis stage[40]. Several lymphocyte T integrins (namely CD29, VLA-3, VLA-4 and VLA-5) are also increased in ALD patients[41]. B lymphocytes were found to be significantly decreased in ALD patients, while a relative predominance of B cells characteristic of IgM antibody production was found. There is speculation on the possible contribution of these changes in autoimmunity and immunodeficiency to ALD pathology[42].
A decreased NK cell activity was also reported in ALD[43]. In recent years, the concept of resolution or regression of liver fibrosis has been described in various situations. The most important step in this process appears to be the apoptosis of HSCs[44]. This event can be induced by different mechanisms, with NK cell activation by interferon-α, interferon-β, and interferon-γ being one of the most important[45,46]. It is noticeable that 30%-50% of liver lymphocytes are NK cells, so further contributing to the link between NK cells and HSC activity regulation[46,47]. Furthermore, the experimental administration of alcohol greatly increases the resistance of HSCs to apoptosis, through NK cells and γ-interferon stimulation[48,49]. Other HSC interactions with immune system cells are also the subject of ongoing research. For instance, the phagocytosis of CD8+ lymphocytes by activated HSCs was reported, but the relevance of this action is unknown[50]. There was also a report linking CD8+ lymphocytes to HSC fibrogenic activity[51].
A decreased CD8+ cell count, mainly CD8+/CD28+, was also described in hereditary hemochromatosis, as well as the presence of functional abnormalities in these cells. This may be due to an HFE polymorphism, linked to and located near the HFE gene, which is related to the regulation of lymphocyte subsets and CD8+ maturation[52-56]. Furthermore, the number of peripheral blood CD8+ lymphocytes inversely correlate with iron overload in hemochromatosis, which is more severe in cases of low CD8+ counts[57,58].
The present study shows the impact of alcoholism in our country, as the majority of ALD patients were young or middle aged (the average age was 53.7 years old), mostly male, and with a high daily alcohol intake often since childhood. Also, most of the patients already displayed significant liver fibrosis.
The control group, chosen among healthy individuals admitted for elective cholecystectomy due to non-complicated gallstones, consisted mostly of women. This was expected, as gallstones are more common in women of childbearing age. Additionally, many potential male controls had to be excluded because they reported alcohol consumption higher than 40 g/d. This may have induced a bias when comparing serum iron, ferritin, and transferrin saturation, which we tried to keep to a minimum by excluding all individuals with hemoglobin and serum ferritin below normal or with analytical evidence of inflammation. Nevertheless, we found papers with control groups consisting mostly of women and gender differences do not seem to affect the type and number of circulating lymphocytes in peripheral blood[37].
As expected, ALD patients showed characteristic analytical changes, including macrocytosis, abnormal clotting, decreased platelets, elevated liver function tests, immunoglobulins, and serum ferritin. After analyzing the mean white cell counts, we found significant lymphopenia in ALD patients, compared to healthy controls. This lymphopenia reflected a reduction of all lymphocyte subsets, except for NK lymphocytes, which did not show a statistically significant difference. The CD4+/CD8+ ratio was significantly increased in most cases, which was a reflection of the relative reduction in the number of CD8+ cells.
However, after analyzing several subgroups in our study, it was evident that all ALD patients consistently presented with lymphopenia compared to healthy controls, but only patients with advanced fibrosis presented with an increased CD4+/CD8+ ratio, even accounting for active alcohol consumption. In fact, for ALD patients, the total lymphocyte count inversely correlated with the stage of liver fibrosis and the CD4+/CD8+ ratio directly associated with liver fibrosis.
Our work adds to the findings of significant lymphopenia in alcoholics (concerning B and T cells), with or without significant liver disease, as previously reported[30,32-34,42]. We found that an increased CD4+/CD8+ ratio was present only in the case of significant fibrosis, but this finding was also suggested by some previous studies which studied patients with advanced liver disease[30,31]. Our work does not support other papers that reported an increase in some lymphocyte subsets[36,37]. While we found a trend to lower NK cell counts, as previously reported[43], we could not demonstrate statistical significance for this phenomenon.
It should be noted that the association between the CD4+/CD8+ ratio and fibrosis stage was the opposite of what has been reported for viral hepatitis (i.e., a low CD4+/CD8+ ratio being associated with an increased fibrosis stage)[50]. If this association is found to be specific for ALD, the CD4+/CD8+ ratio may eventually contribute to a panel of non-invasive markers of staging for ALD fibrosis. The CD8+ lymphocyte count correlated directly with serum ferritin levels, unlike findings with hereditary hemochromatosis where lower CD8+ counts were associated with increased iron overload. This may indicate that the lymphopenia etiopathogenic mechanism is different in ALD, when compared to other liver diseases, such as viral hepatitis or hemochromatosis.
COMMENTS
Background
Alcohol is the third highest cause of disease burden, worldwide, and the second highest cause in Europe. However, only 30%-35% of chronic alcoholics develop liver disease (steatohepatitis and/or cirrhosis) and only 10%-15% have documented cirrhosis. While the role of lymphocytes in alcoholic liver disease (ALD) pathogenesis has been the subject of different lines of research, the results and ultimate interpretations are discrepant.
Research frontiers
Apart from alterations in lymphocyte count, alcohol appears to cause functional changes to lymphocyte subsets.
Innovations and breakthroughs
Th17 lymphocytes, a new CD4+ effector subpopulation that has been recently described, are more populous in ALD and their absolute numbers are associated with fibrosis stage. Several lymphocyte T integrins (namely CD29, VLA-3, VLA-4 and VLA-5) are also increased in ALD patients. B lymphocytes were found to be significantly decreased in ALD patients, while a relative predominance of B cells characteristic of IgM antibody production was found.
Applications
Our work adds to the findings of significant lymphopenia in alcoholics, with or without significant liver disease, ALD patients consistently presented with lymphopenia compared to healthy controls, but only patients with advanced fibrosis presented with an increased CD4+/CD8+ ratio. The total lymphocyte count inversely correlated with the stage of liver fibrosis and the CD4+/CD8+ ratio directly associated with liver fibrosis. If this association is found to be specific for ALD, the CD4+/CD8+ ratio may eventually contribute to a panel of non-invasive markers of staging for ALD fibrosis.
Terminology
CD3+ is a marker of all T lymphocytes. Those can be subdivided into T helper cells (CD4+), which help the activity of other immune cells by releasing T cell cytokines; and cytotoxic T cells (CD8+), which are involved in direct cell killing after recognizing a specific antigen. B-lymphocytes, involved in antibodies synthesis, express the surface protein CD19.
Peer review
Stimulation of innate immunity is increasingly recognized to play an important role in the pathogenesis of alcoholic liver disease. Various studies have come up to speculate immune response in alcoholic liver disease (T Cell and B cell). Authors in this manuscript evaluated lymphocytic population subsets in alcoholic liver disease. It is an interesting manuscript.
Footnotes
Supported by Centro Hospitalar Tondela, Viseu E.P.E., Portugal (public hospital)
P- Reviewer Grizzi F S- Editor Li JY L- Editor A E- Editor Yan JL
References
- 1.World Health Organization. Global Status Report on Alcohol and Health 2011. WHO Library. 2011. pp. 20–37. [Google Scholar]
- 2.Ezzati M, Lopez AD, Rodgers A, Vander Hoorn S, Murray CJ. Selected major risk factors and global and regional burden of disease. Lancet. 2002;360:1347–1360. doi: 10.1016/S0140-6736(02)11403-6. [DOI] [PubMed] [Google Scholar]
- 3.Grant BF, Dufour MC, Harford TC. Epidemiology of alcoholic liver disease. Semin Liver Dis. 1988;8:12–25. doi: 10.1055/s-2008-1040525. [DOI] [PubMed] [Google Scholar]
- 4.McCullough AJ, O’Connor JF. Alcoholic liver disease: proposed recommendations for the American College of Gastroenterology. Am J Gastroenterol. 1998;93:2022–2036. doi: 10.1111/j.1572-0241.1998.00587.x. [DOI] [PubMed] [Google Scholar]
- 5.Pequignot G, Cyrulnik F. Chronic disease due to overconsumption of alcoholic drinks (excepting neuropsychiatric pathology) In: International Encyclopaedia of Pharmacology and Therapeutics, vol II. Pergamon Press; 1970. pp. 375–412. [Google Scholar]
- 6.Sherlock S, Dooley J. Diseases of the liver and billiary system. 11th ed. Blackwell Pub. In: International Encyclopaedia of Pharmacology and Therapeutics, vol II. Pergamon Press; 2002. pp. 381–398. [Google Scholar]
- 7.MacSween RN, Burt AD. Histologic spectrum of alcoholic liver disease. Semin Liver Dis. 1986;6:221–232. doi: 10.1055/s-2008-1040605. [DOI] [PubMed] [Google Scholar]
- 8.Lefkowitch JH. Morphology of alcoholic liver disease. Clin Liver Dis. 2005;9:37–53. doi: 10.1016/j.cld.2004.11.001. [DOI] [PubMed] [Google Scholar]
- 9.Costa Matos L. [Alcoholic Liver Disease] An. Med. Interna. 2006;13:207–216. [Google Scholar]
- 10.Yerian L. Histopathological evaluation of fatty and alcoholic liver diseases. J Dig Dis. 2011;12:17–24. doi: 10.1111/j.1751-2980.2010.00472.x. [DOI] [PubMed] [Google Scholar]
- 11.Van Pelt FN, Straub P, Manns MP. Molecular basis of drug-induced immunological liver injury. Semin Liver Dis. 1995;15:283–300. doi: 10.1055/s-2007-1007281. [DOI] [PubMed] [Google Scholar]
- 12.Purohit V, Bode JC, Bode C, Brenner DA, Choudhry MA, Hamilton F, Kang YJ, Keshavarzian A, Rao R, Sartor RB, et al. Alcohol, intestinal bacterial growth, intestinal permeability to endotoxin, and medical consequences: summary of a symposium. Alcohol. 2008;42:349–361. doi: 10.1016/j.alcohol.2008.03.131. [DOI] [PMC free article] [PubMed] [Google Scholar]
- 13.Thurman RG. II. Alcoholic liver injury involves activation of Kupffer cells by endotoxin. Am J Physiol. 1998;275:G605–G611. doi: 10.1152/ajpgi.1998.275.4.G605. [DOI] [PubMed] [Google Scholar]
- 14.Soares JB, Pimentel-Nunes P, Roncon-Albuquerque R, Leite-Moreira A. The role of lipopolysaccharide/toll-like receptor 4 signaling in chronic liver diseases. Hepatol Int. 2010;4:659–672. doi: 10.1007/s12072-010-9219-x. [DOI] [PMC free article] [PubMed] [Google Scholar]
- 15.Han DW. Intestinal endotoxemia as a pathogenetic mechanism in liver failure. World J Gastroenterol. 2002;8:961–965. doi: 10.3748/wjg.v8.i6.961. [DOI] [PMC free article] [PubMed] [Google Scholar]
- 16.Neuman MG. Cytokines--central factors in alcoholic liver disease. Alcohol Res Health. 2003;27:307–316. [PMC free article] [PubMed] [Google Scholar]
- 17.Bharrhan S, Koul A, Chopra K, Rishi P. Catechin suppresses an array of signalling molecules and modulates alcohol-induced endotoxin mediated liver injury in a rat model. PLoS One. 2011;6:e20635. doi: 10.1371/journal.pone.0020635. [DOI] [PMC free article] [PubMed] [Google Scholar]
- 18.Macgeorge J, Frazer IH, Cunningham A. Autoantibodies, sheep cell agglutinins and anti-albumin antibodies in alcoholic liver disease. J Clin Lab Immunol. 1984;13:21–24. [PubMed] [Google Scholar]
- 19.Laskin CA, Vidins E, Blendis LM, Soloninka CA. Autoantibodies in alcoholic liver disease. Am J Med. 1990;89:129–133. doi: 10.1016/0002-9343(90)90288-o. [DOI] [PubMed] [Google Scholar]
- 20.Perperas A, Tsantoulas D, Portmann B, Eddleston AL, Williams R. Autoimmunity to a liver membrane lipoprotein and liver damage in alcoholic liver disease. Gut. 1981;22:149–152. doi: 10.1136/gut.22.2.149. [DOI] [PMC free article] [PubMed] [Google Scholar]
- 21.McFarlane IG. Autoantibodies in alcoholic liver disease. Addict Biol. 2000;5:141–151. doi: 10.1080/13556210050003720. [DOI] [PubMed] [Google Scholar]
- 22.Chedid A, Chadalawada KR, Morgan TR, Moritz TE, Mendenhall CL, Hammond JB, Emblad PW, Cifuentes DC, Kwak JW, Gilman-Sachs A. Phospholipid antibodies in alcoholic liver disease. Hepatology. 1994;20:1465–1471. doi: 10.1002/hep.1840200614. [DOI] [PubMed] [Google Scholar]
- 23.Szabo G, Mandrekar P, Oak S, Mayerle J. Effect of ethanol on inflammatory responses. Implications for pancreatitis. Pancreatology. 2007;7:115–123. doi: 10.1159/000104236. [DOI] [PMC free article] [PubMed] [Google Scholar]
- 24.Lau AH, Szabo G, Thomson AW. Antigen-presenting cells under the influence of alcohol. Trends Immunol. 2009;30:13–22. doi: 10.1016/j.it.2008.09.005. [DOI] [PubMed] [Google Scholar]
- 25.Feder JN, Gnirke A, Thomas W, Tsuchihashi Z, Ruddy DA, Basava A, Dormishian F, Domingo R, Ellis MC, Fullan A, et al. A novel MHC class I-like gene is mutated in patients with hereditary haemochromatosis. Nat Genet. 1996;13:399–408. doi: 10.1038/ng0896-399. [DOI] [PubMed] [Google Scholar]
- 26.Aranda N, Viteri FE, Montserrat C, Arija V. Effects of C282Y, H63D, and S65C HFE gene mutations, diet, and life-style factors on iron status in a general Mediterranean population from Tarragona, Spain. Ann Hematol. 2010;89:767–773. doi: 10.1007/s00277-010-0901-9. [DOI] [PMC free article] [PubMed] [Google Scholar]
- 27.Bonkovsky HL, Lambrecht RW, Shan Y. Iron as a co-morbid factor in nonhemochromatotic liver disease. Alcohol. 2003;30:137–144. doi: 10.1016/s0741-8329(03)00127-7. [DOI] [PubMed] [Google Scholar]
- 28.Wallace DF, Subramaniam VN. Co-factors in liver disease: the role of HFE-related hereditary hemochromatosis and iron. Biochim Biophys Acta. 2009;1790:663–670. doi: 10.1016/j.bbagen.2008.09.002. [DOI] [PubMed] [Google Scholar]
- 29.Kleiner DE, Brunt EM, Van Natta M, Behling C, Contos MJ, Cummings OW, Ferrell LD, Liu YC, Torbenson MS, Unalp-Arida A, et al. Design and validation of a histological scoring system for nonalcoholic fatty liver disease. Hepatology. 2005;41:1313–1321. doi: 10.1002/hep.20701. [DOI] [PubMed] [Google Scholar]
- 30.Couzigou P, Vincendeau P, Fleury B, Richard-Molard B, Pierron A, Bergeron JL, Bezian JH, Amouretti M, Béraud C. [Changes in circulating lymphocyte subsets in alcoholic hepatopathies. Respective role of alcohol, hepatocellular insufficiency and malnutrition] Gastroenterol Clin Biol. 1984;8:915–919. [PubMed] [Google Scholar]
- 31.Spinozzi F, Rambotti P, Gerli R, Cernetti C, Rondoni F, Frascarelli A, Bertotto A, Grignani F. Immunoregulatory T cells in alcoholic liver disease: phenotypical dissection of circulating Leu3+/T4+ inducer T-lymphocytes. J Clin Lab Immunol. 1987;23:161–167. [PubMed] [Google Scholar]
- 32.Naude CE, Bouic P, Senekal M, Kidd M, Ferrett HL, Fein G, Carey PD. Lymphocyte measures in treatment-naïve 13-15-year old adolescents with alcohol use disorders. Alcohol. 2011;45:507–514. doi: 10.1016/j.alcohol.2011.02.307. [DOI] [PMC free article] [PubMed] [Google Scholar]
- 33.Müller C, Wolf H, Göttlicher J, Eibl MM. Helper-inducer and suppressor-inducer lymphocyte subsets in alcoholic cirrhosis. Scand J Gastroenterol. 1991;26:295–301. doi: 10.3109/00365529109025045. [DOI] [PubMed] [Google Scholar]
- 34.Laso FJ, Madruga JI, López A, Ciudad J, Alvarez-Mon M, San Miguel J, Orfao A. Distribution of peripheral blood lymphoid subsets in alcoholic liver cirrhosis: influence of ethanol intake. Alcohol Clin Exp Res. 1996;20:1564–1568. doi: 10.1111/j.1530-0277.1996.tb01700.x. [DOI] [PubMed] [Google Scholar]
- 35.Lombardo L, Capaldi A, Poccardi G, Vineis P. Peripheral blood CD3 and CD4 T-lymphocyte reduction correlates with severity of liver cirrhosis. Int J Clin Lab Res. 1995;25:153–156. doi: 10.1007/BF02592558. [DOI] [PubMed] [Google Scholar]
- 36.Cook RT, Garvey MJ, Booth BM, Goeken JA, Stewart B, Noel M. Activated CD-8 cells and HLA DR expression in alcoholics without overt liver disease. J Clin Immunol. 1991;11:246–253. doi: 10.1007/BF00918182. [DOI] [PubMed] [Google Scholar]
- 37.Arosa FA, Porto G, Cabeda JM, Lacerda R, Resende D, Cruz E, Cardoso C, Fonseca M, Simões C, Rodrigues P, et al. Expansions of CD8+CD28- and CD8+TcRVbeta5.2+ T cells in peripheral blood of heavy alcohol drinkers. Alcohol Clin Exp Res. 2000;24:519–527. [PubMed] [Google Scholar]
- 38.Cook RT, Ballas ZK, Waldschmidt TJ, Vandersteen D, LaBrecque DR, Cook BL. Modulation of T-cell adhesion markers, and the CD45R and CD57 antigens in human alcoholics. Alcohol Clin Exp Res. 1995;19:555–563. doi: 10.1111/j.1530-0277.1995.tb01548.x. [DOI] [PubMed] [Google Scholar]
- 39.Schirren CA, Jung MC, Zachoval R, Diepolder H, Hoffmann R, Riethmüller G, Pape GR. Analysis of T cell activation pathways in patients with liver cirrhosis, impaired delayed hypersensitivity and other T cell-dependent functions. Clin Exp Immunol. 1997;108:144–150. doi: 10.1046/j.1365-2249.1997.d01-985.x. [DOI] [PMC free article] [PubMed] [Google Scholar]
- 40.Ye C, Li WY, Zheng MH, Chen YP. T-helper 17 cell: A distinctive cell in liver diseases. Hepatol Res. 2011;41:22–29. doi: 10.1111/j.1872-034X.2010.00744.x. [DOI] [PubMed] [Google Scholar]
- 41.Patsenker E, Stickel F. Role of integrins in fibrosing liver diseases. Am J Physiol Gastrointest Liver Physiol. 2011;301:G425–G434. doi: 10.1152/ajpgi.00050.2011. [DOI] [PubMed] [Google Scholar]
- 42.Cook RT, Waldschmidt TJ, Cook BL, Labrecque DR, McLatchie K. Loss of the CD5+ and CD45RAhi B cell subsets in alcoholics. Clin Exp Immunol. 1996;103:304–310. doi: 10.1046/j.1365-2249.1996.d01-621.x. [DOI] [PMC free article] [PubMed] [Google Scholar]
- 43.Laso FJ, Madruga JI, Girón JA, López A, Ciudad J, San Miguel JF, Alvarez-Mon M, Orfao A. Decreased natural killer cytotoxic activity in chronic alcoholism is associated with alcohol liver disease but not active ethanol consumption. Hepatology. 1997;25:1096–1100. doi: 10.1002/hep.510250508. [DOI] [PubMed] [Google Scholar]
- 44.Iredale JP. Hepatic stellate cell behavior during resolution of liver injury. Semin Liver Dis. 2001;21:427–436. doi: 10.1055/s-2001-17557. [DOI] [PubMed] [Google Scholar]
- 45.Radaeva S, Sun R, Jaruga B, Nguyen VT, Tian Z, Gao B. Natural killer cells ameliorate liver fibrosis by killing activated stellate cells in NKG2D-dependent and tumor necrosis factor-related apoptosis-inducing ligand-dependent manners. Gastroenterology. 2006;130:435–452. doi: 10.1053/j.gastro.2005.10.055. [DOI] [PubMed] [Google Scholar]
- 46.Jeong WI, Gao B. Innate immunity and alcoholic liver fibrosis. J Gastroenterol Hepatol. 2008;23 Suppl 1:S112–S118. doi: 10.1111/j.1440-1746.2007.05274.x. [DOI] [PMC free article] [PubMed] [Google Scholar]
- 47.Byun JS, Jeong WI. Involvement of hepatic innate immunity in alcoholic liver disease. Immune Netw. 2010;10:181–187. doi: 10.4110/in.2010.10.6.181. [DOI] [PMC free article] [PubMed] [Google Scholar]
- 48.Jeong WI, Park O, Gao B. Abrogation of the antifibrotic effects of natural killer cells/interferon-gamma contributes to alcohol acceleration of liver fibrosis. Gastroenterology. 2008;134:248–258. doi: 10.1053/j.gastro.2007.09.034. [DOI] [PMC free article] [PubMed] [Google Scholar]
- 49.Arteel GE. Silencing a killer among us: ethanol impairs immune surveillance of activated stellate cells by natural killer cells. Gastroenterology. 2008;134:351–353. doi: 10.1053/j.gastro.2007.11.061. [DOI] [PMC free article] [PubMed] [Google Scholar]
- 50.Muhanna N, Doron S, Wald O, Horani A, Eid A, Pappo O, Friedman SL, Safadi R. Activation of hepatic stellate cells after phagocytosis of lymphocytes: A novel pathway of fibrogenesis. Hepatology. 2008;48:963–977. doi: 10.1002/hep.22413. [DOI] [PMC free article] [PubMed] [Google Scholar]
- 51.Safadi R, Ohta M, Alvarez CE, Fiel MI, Bansal M, Mehal WZ, Friedman SL. Immune stimulation of hepatic fibrogenesis by CD8 cells and attenuation by transgenic interleukin-10 from hepatocytes. Gastroenterology. 2004;127:870–882. doi: 10.1053/j.gastro.2004.04.062. [DOI] [PubMed] [Google Scholar]
- 52.Arosa FA, da Silva AJ, Godinho IM, ter Steege JC, Porto G, Rudd CE, de Sousa M. Decreased CD8-p56lck activity in peripheral blood T-lymphocytes from patients with hereditary haemochromatosis. Scand J Immunol. 1994;39:426–432. doi: 10.1111/j.1365-3083.1994.tb03396.x. [DOI] [PubMed] [Google Scholar]
- 53.Arosa FA, Oliveira L, Porto G, da Silva BM, Kruijer W, Veltman J, de Sousa M. Anomalies of the CD8+ T cell pool in haemochromatosis: HLA-A3-linked expansions of CD8+CD28- T cells. Clin Exp Immunol. 1997;107:548–554. doi: 10.1046/j.1365-2249.1997.d01-967.x. [DOI] [PMC free article] [PubMed] [Google Scholar]
- 54.Cardoso C, Porto G, Lacerda R, Resende D, Rodrigues P, Bravo F, Oliveira JC, Justiça B, de Sousa M. T-cell receptor repertoire in hereditary hemochromatosis: a study of 32 hemochromatosis patients and 274 healthy subjects. Hum Immunol. 2001;62:488–499. doi: 10.1016/s0198-8859(01)00233-6. [DOI] [PubMed] [Google Scholar]
- 55.Cruz E, Vieira J, Gonçalves R, Alves H, Almeida S, Rodrigues P, Lacerda R, Porto G. Involvement of the major histocompatibility complex region in the genetic regulation of circulating CD8 T-cell numbers in humans. Tissue Antigens. 2004;64:25–34. doi: 10.1111/j.1399-0039.2004.00245.x. [DOI] [PubMed] [Google Scholar]
- 56.Macedo MF, Porto G, Costa M, Vieira CP, Rocha B, Cruz E. Low numbers of CD8+ T lymphocytes in hereditary haemochromatosis are explained by a decrease of the most mature CD8+ effector memory T cells. Clin Exp Immunol. 2010;159:363–371. doi: 10.1111/j.1365-2249.2009.04066.x. [DOI] [PMC free article] [PubMed] [Google Scholar]
- 57.Cardoso EM, Hagen K, de Sousa M, Hultcrantz R. Hepatic damage in C282Y homozygotes relates to low numbers of CD8+ cells in the liver lobuli. Eur J Clin Invest. 2001;31:45–53. doi: 10.1046/j.1365-2362.2001.00744.x. [DOI] [PubMed] [Google Scholar]
- 58.Cruz E, Melo G, Lacerda R, Almeida S, Porto G. The CD8+ T-lymphocyte profile as a modifier of iron overload in HFE hemochromatosis: an update of clinical and immunological data from 70 C282Y homozygous subjects. Blood Cells Mol Dis. 2006;37:33–39. doi: 10.1016/j.bcmd.2006.04.004. [DOI] [PubMed] [Google Scholar]