Abstract
This paper outlines a powerful, yet flexible real-time data acquisition and control system for use in the triggering and measurement of both analog and digital events. Built using the LabVIEW development architecture (version 7.1) and freely available, this system provides precisely timed auditory and visual stimuli to a subject while recording analog data and timestamps of neural activity retrieved from a window discriminator. The system utilizes the most recent real-time (RT) technology in order to provide not only a guaranteed data acquisition rate of 1 kHz, but a much more difficult to achieve guaranteed system response time of 1 ms. The system interface is windows-based and easy to use, providing a host of configurable options for end-user customization.
Keywords: Data acquisition, Measurement, Movement, Spike, LabVIEW, Real-time, Software, Deterministic
1. Introduction
Many neurophysiological studies require the precise acquisition and control of analog and digital data. One of the first well-known systems to accomplish this task was the complex UNIX-based real-time (RT) application developed for oculomotor experiments by Hays et al. (1982). As new applications have continued to emerge, however, many have forsaken true (or “hard”) real-time control and response in favor of simplicity, extended functionality, alternative operating systems, and/or user-friendly design. Those systems that have maintained real-time support (e.g., TEMPO, Spike2) are often costly, proprietary, and require additional code in order to define specific experiments. The system introduced in this paper attempts to address all of these concerns by providing an open-source control and measurement system that combines a flexible, intuitive interface with true real-time power, accuracy and reliability. Utilizing the proven LabVIEW development architecture (e.g., Kodosky and Dye, 1989; Kullmann et al., 2004; Poindessault et al., 1995; Pruehsner et al., 2003; Sakatani and Isa, 2004), the system presented here was developed and optimized for oculomotor studies related to neural control of coordinated eye-head movements and saccade-blink interactions (Gandhi and Bonadonna, 2004).
2. Materials and methods
2.1. System overview
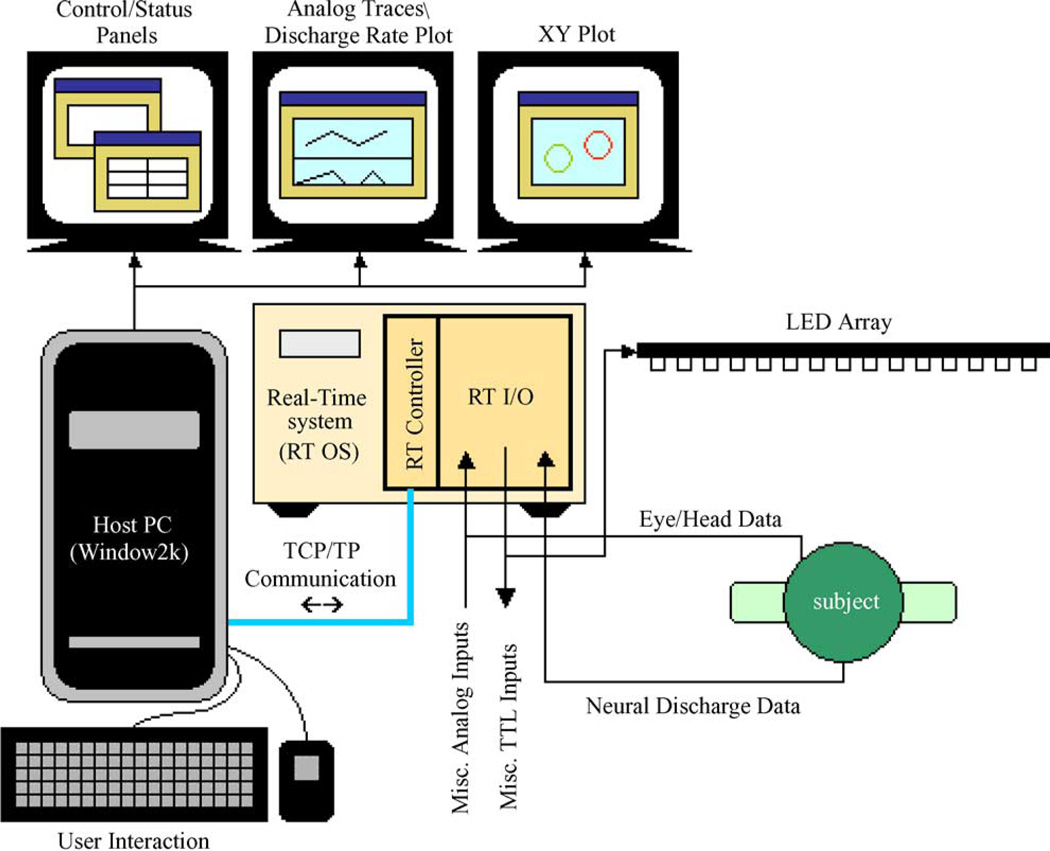
An overview of the system is shown in Fig. 1. All time-critical tasks including data collection and real-time control are handled deterministically (i.e., within a guaranteed period of time) by the real-time system. The RT system components (National Instruments, Austin, TX) include a PXI-8145 real-time controller running a real-time operating system, a PXI-6031E 16-bit analog-to-digital card, a PXI-6533 digital input/output card, and a PXI-6602 counter/timer card. These components share a common backplane via a PXI-1000B chassis, allowing for all input tasks to be triggered via a common pulse and thus insuring proper synchronization of the system. Tasks that are less time-critical such as data display, user interaction, and file storage are handled by the host system (where real-time operation is neither needed nor enforced). The host system consists of a standard PC (Dell OptiPlex GX260, 2.4 GHz Pentium 4 processor, 512 MB RAM) running Windows 2000. Communication and data exchange between the RT system and the host system takes place over a TCP/IP connection established between the two systems.
Fig. 1.
System overview. All time-critical processes are handled by the real-time system running a deterministic operating system. Non-time-critical tasks are managed by the host system running a general-purpose operating system (e.g., Windows). The two systems communicate over a TCP/IP connection established between them, resulting in a complete system that is deterministic, yet simple to use.
During typical system operation, a user configures or loads a set of trials (defined by “state tables”; described in Section 2.3) on the host, along with various system parameters referenced by the trials. These trials and parameters are subsequently downloaded to the RT system, which repetitively selects specific trials from the downloaded set for execution. To keep interaction with the system simple and intuitive, this downloading process is transparent to the user, who interacts with the host system as if it were standalone. Changes to the system may be made while trials are being executed, allowing for on-the-fly updating of all system elements.
A typical trial consists of the systematic display of red, green, and/or yellow “targets” (i.e., light emitting diodes) for specified periods of time or until certain target window conditions are satisfied by the subject’s eye and/or head positions (see Section 2.3 for a description of target window conditions). Digital outputs may also be activated at user-specified intervals within the trial, perhaps to provide other stimuli or to deliver rewards. While the trial is running, eye and head position data are recorded (at 1 kHz), as are neural discharge (i.e., spike) times (spikes are recognized as digital pulses output from a window discriminator and are time stamped by the PXI-6602 counter/timer card with a resolution of 20 MHz). At present, two additional user-configurable analog channels may also be recorded and displayed (at 1 kHz) during trial execution.
2.2. Deterministic (real-time) control
A key feature of this system is its real-time capability. In order for a system to be designated as a “real-time” system, it must provide for deterministic control of events; that is, events must be handled within a guaranteed period of time. In general, obtaining deterministic data acquisition is a trivial task, as most data acquisition hardware components possess or simulate dedicated clocks and buffers that allow for deterministic acquisition rates. Deterministic response time, however, is much more difficult to achieve, since it requires more advanced programming, thread management techniques, and the use of a real-time operating system (RTOS). The majority of current mainstream operating systems (including Microsoft Windows–Venturcom, 2003) are designed as general-purpose operating systems (GPOS), not real-time operating systems, in order to offer optimum flexibility and ease of use. Therefore, their exclusive use would not be sufficient to produce a deterministic system. General-purpose operating systems are advantageous, however, in that they usually offer a much more user-friendly interface than do real-time operating systems, which are traditionally more difficult for users to interface with due to the requirements of a real-time environment.
The system described in this paper leverages the positive aspects of both real-time and general-purpose architectures. By running all time-critical tasks on a real-time framework (LabVIEW RT), while transparently interfacing with that framework via a standard general-purpose architecture (Microsoft Windows), our system guarantees fully deterministic operation (i.e., deterministic data acquisition as well as deterministic response time), while remaining flexible, intuitive, and user-friendly.
Real-time behavior is monitored on our system via the dedicated sampling clock on the analog-to-digital card (PXI-6031E). This clock serves to time the 1 kHz analog data acquisition as well as to establish the 1 ms response-time deadline. Should a timing deadline be missed by the system during any trial (as detected by special library support in LabVIEW RT), an error is reported to the user and logged for that trial (if logging is enabled; see Section 3.2), and the system continues executing the next trial. While the system was able to execute without any deadline failures for the constraints (number of channels, sampling rate, etc.) described in this paper, we were able to force deadline failures using delays placed in the code, thus verifying proper error reporting and recovery.
2.3. Flexibility—trial (state table) definition
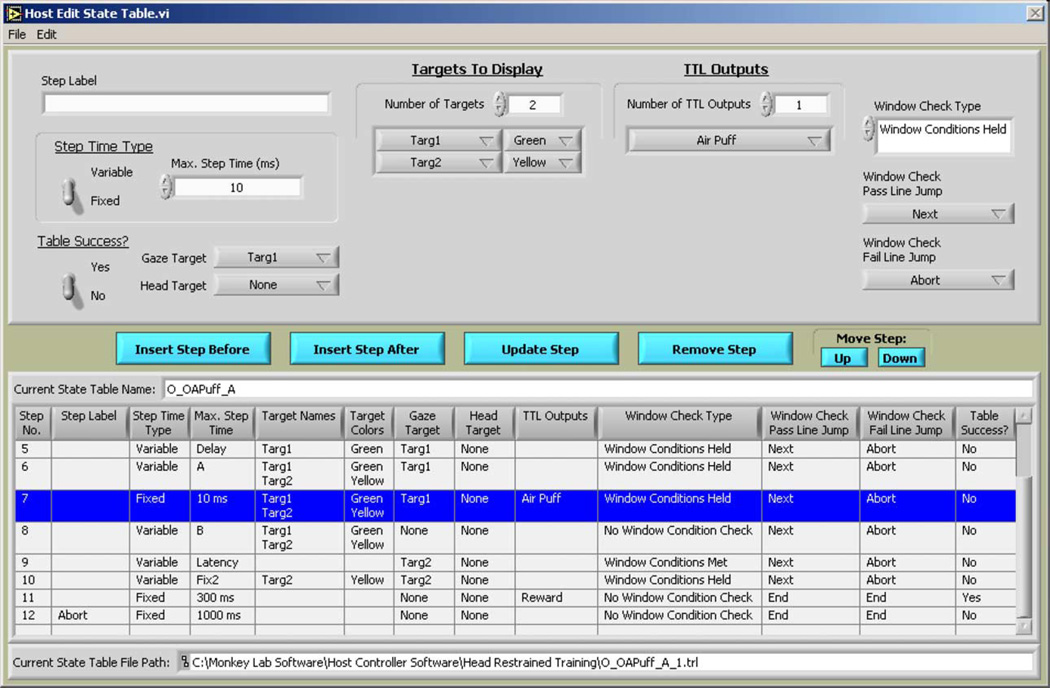
Customization is well supported within our system, allowing a high level of control over general system elements as well as over the configuration of individual trials. Perhaps the greatest power and flexibility of the system is found in its concept of and utilization of the state table (based on the “state set” concept introduced by Hays et al., 1982). The state table dictates the execution of a specific trial and follows a stepwise format whereby deterministic trial execution begins with the first step and proceeds through the steps (branching as necessary) according to the parameters defined within each step. This format provides for an unlimited number of possible trials (each of unlimited length), allowing the system to be used for a wide range of experiments. State tables are constructed using the integrated state table editor (Fig. 2) and may be saved into separate state table (*.trl) files for reference by the system.
Fig. 2.
State table editor. An integrated, easy-to-use state table editor allows the user to create and save an infinite number of possible trials for execution within the system.
Each state table incorporates several user-specified parameters within each step. First, each step may be given a unique Step Label for use as a reference when branching within the state table. Secondly, the timing properties of each step are defined by the Step Time Type and Maximum Step Time parameters, which specify the maximum duration of the step as either a constant time interval value or a variable defined by the “intervals” system parameter (see Section 2.4).
The characteristics of the visual targets to be displayed during each step are specified by the Target Names and Target Colors parameters, where a subset of the targets available for display (as defined by the “targets” system parameter; see Section 2.4) is selected, along with the colors (red, green, or yellow) to be ascribed to each selected target. Additionally, the TTL Outputs parameter specifies a subset of the digital outputs available (as defined by the “TTL outputs” system parameter; see Section 2.4) to be enabled during each step.
To make conditional branching possible within the state table, each step also defines aWindow Check Type parameter. This parameter defines the nature of the relationship that the recorded eye and head position signals must have relative to targets defined by that step’s Gaze Target and Head Target parameters for successful completion of the current step. Three window check types are available: (1) No Window Condition Check—no relationship is required and the step is always successful; (2) Window Conditions Met—in order to succeed, the eye and/or head positions must enter into user-specified windows surrounding the targets defined by that step’s “Gaze Target” and “Head Target” parameters, respectively (window characteristics are specified by the “targets” system parameter; see Section 2.4); and (3) Window Conditions Held—in order to succeed, the eye and/or head positions must remain within user-specified windows surrounding the targets defined by that step’s “Gaze Target” and “Head Target” parameters. If a step is completed successfully, each step’s Window Check Pass Line Jump parameter indicates which step in the current state table to execute next. However, if a step is not completed successfully, each step’s Window Check Fail Line Jump parameter indicates the next step to be executed. Finally, the Table Success parameter specifies whether the state table as a whole (i.e., the trial) is considered to be passed or failed based on the successful completion of that step.
2.4. Flexibility—system parameter definitions
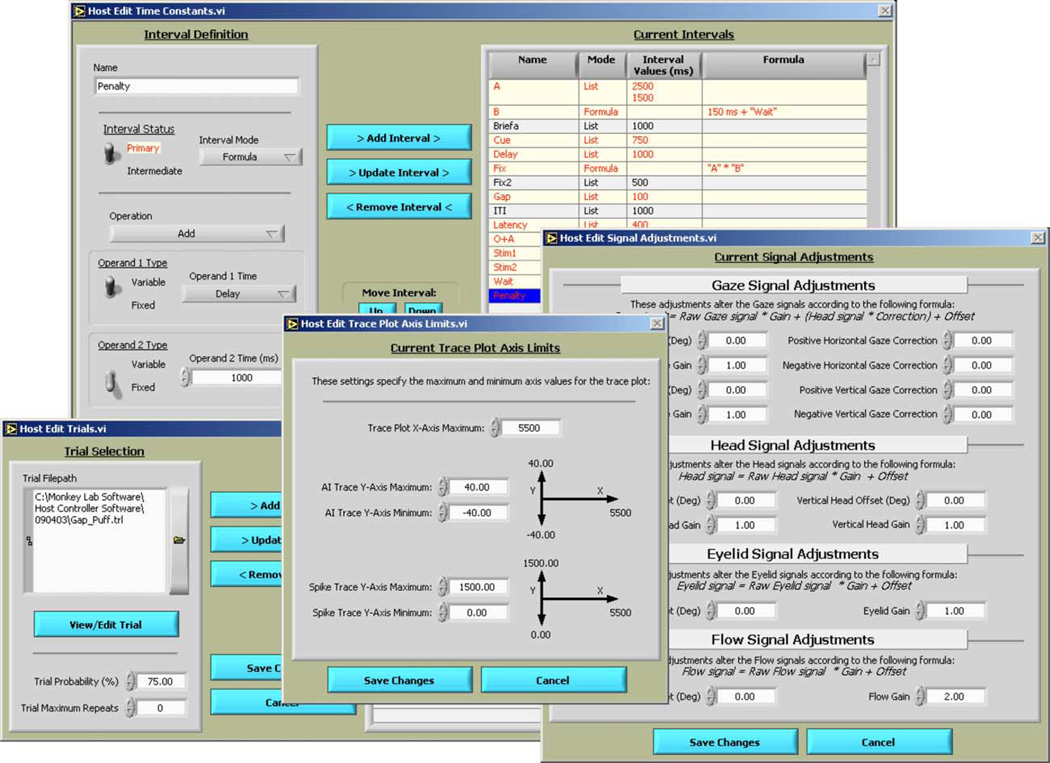
A myriad of configurable parameters is available for comprehensive control and tailoring of the system environment. All customization is accomplished using intuitive Windows based elements (menus, dialog boxes, etc.—Fig. 3). Different system configurations may be saved into separate configuration (*.prm) files for easy recall of individual experiments.
Fig. 3.
System parameter editors. Intuitive, point-and-click interfaces allow the user to customize system behavior quickly and easily. Many system parameters are available for modification, giving the user comprehensive control over his operating environment.
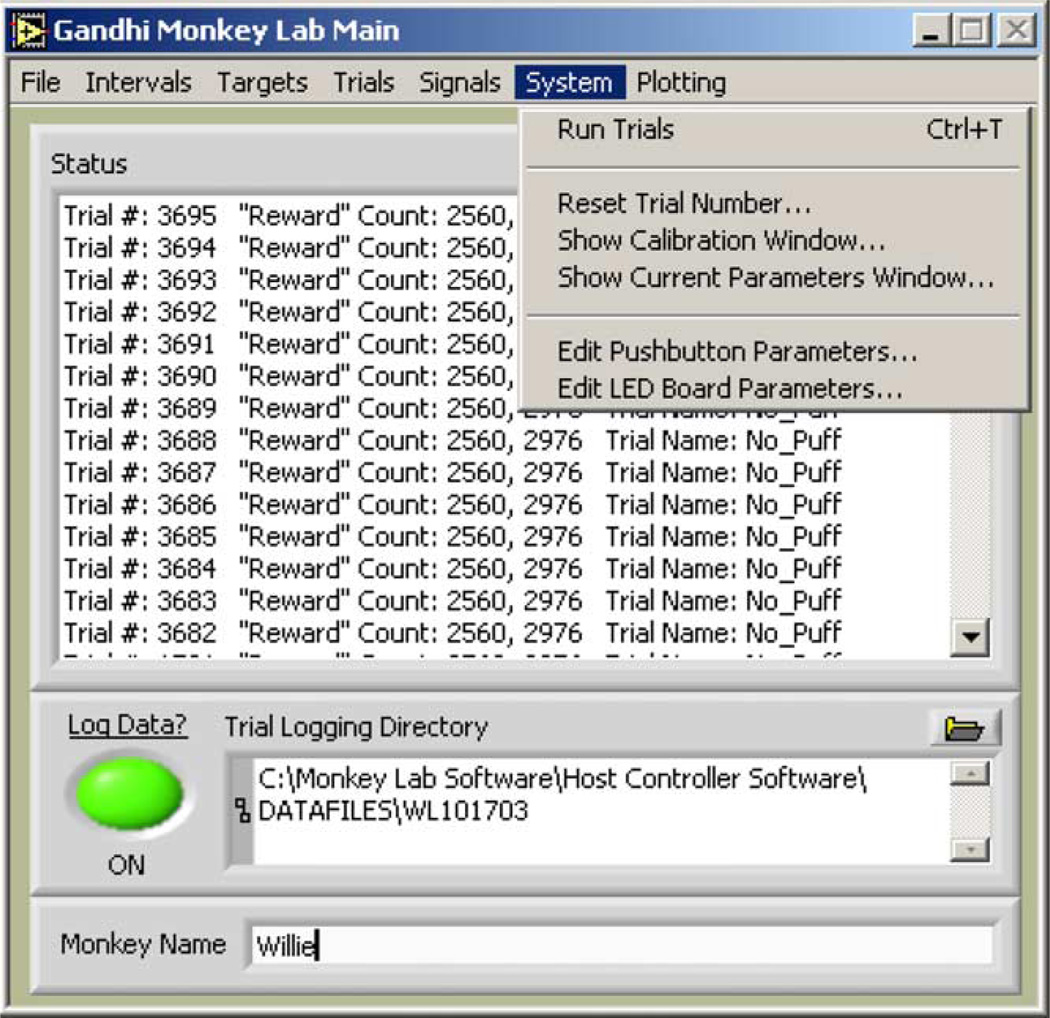
System parameters are accessible from the main control panel menubar (Fig. 4) and fall into six overall categories. Interval-type parameters (configured via the main control panel’s “Intervals” menu) allow the user to define timing properties utilized within the system and include the definition of an inter-trial interval (a set of possible time durations that may elapse between consecutive trials) as well as definitions of standard intervals (i.e., the variable time intervals referenced within each state table step by the “Maximum Step Time” parameter (described above)). Standard interval variables may be defined in either list mode, where they are defined as sets of possible time durations, or in formula mode, where they are defined as arithmetic combinations of constants and/or other interval variables (Fig. 3—“Host Edit Time Constants.vi” panel).
Fig. 4.
Main panel. The main panel is the primary interface to the system, providing access to system parameters, control of trial execution and data storage, and reports on general system behavior.
Target-type parameters (accessible from the main control panel’s “Targets” menu) dictate characteristics of the visual targets (i.e., LEDs) presented by the system. Within this set of parameters, a series of targets (i.e., variables that may be referenced by a state table’s “Target Names” parameter) may be defined for use in trial execution. In a fashion similar to interval definitions, targets may be defined in either list mode (as a set of possible X/Y coordinates) or in formula mode (as an arithmetic combination of constants and/or other target variables). Targets may also define a circular window that may be referenced by each state table step’s “Window Check Type” parameter. In addition to target definitions, target-type parameters also include a target limit specification, defining bounds set on possible target coordinate locations, as well as whether targets that exceed those bounds are ignored or coerced to be within those specified.
Trial-type parameters (configured via the main control panel’s “Trials” menu) allow the user to control the execution of trials. In this parameter set, the trials parameter specifies the set of possible state tables that may be executed by the system, along with a probability of execution for each selected state table (Fig. 3—“Host Edit Trials vi” panel). To provide for the automatic shutoff of trial execution for an unresponsive subject, the maximum trial failures parameter specifies the maximum number of consecutive state table failures that may occur before trial execution is automatically turned off (see the “Table Success” state table parameter description above for a definition of state table failure).
User-selectable modification of system input and output is handled via the following signal-type parameters (found under the main control panel’s “Signals” menu). The signal mode parameter delineates whether only eye, only head, or both eye and head data are recorded during trial execution. The signal adjustments parameter specifies gain, offset, and other correction values to be applied by the system to incoming analog signals (Fig. 3—“Host Edit Signal Adjustments vi” panel). These values may be adjusted manually or set in an automated fashion using an integrated auto-calibration feature that continually calculates and records optimum adjustments during trial execution. The signal names parameter allows the user to give custom names to the two user-selectable analog signals recorded during trial execution. The number of degrees corresponding to one volt on the analog-to-digital card is set by the degrees per volt parameter. Finally, the TTL outputs parameter specifies the set of possible digital outputs that may be referenced by a state table’s “TTL Outputs” parameter. TTL outputs are defined as a collection of digital lines (when one TTL “output” should be output on multiple lines), along with a probability associated with each line.
System-type parameters (set via the main control panel’s “System” menu) allow customization of overall system hardware. To enable manual delivery of stimuli or rewards, a manual pushbutton may be configured using the pushbutton parameters, which allow selection of one TTL output defined by the “TTL Outputs” system parameter to be output for a user-specified duration whenever the pushbutton is depressed. The LED array used to present visual stimuli may also be customized using the LED board parameters, which specify LED array dimensions (number of rows, number of columns, distance between rows, distance between columns).
Finally, plotting-type parameters (accessible from the main control panel’s “Plotting” menu) allow for the tailoring of graphical output displayed by the system. Within this parameter set, the trace plot initial step parameter delineates the state table step at which to begin display of trial data on the trace plot, while the trace plot offsets parameter specifies the offsets to be placed on each analog data trace found on the trace plot (see Section 3.1 for a description of plots displayed by the system). Maximum and minimum axis values to be placed on the trace and XY plots are defined using the trace plot axis limits (Fig. 3—“Host Edit Trace Plot Axis Limits.vi” panel) and XY plot axis limits parameters, respectively. Finally, the displayed TTL output count parameter selects one TTL output defined by the “TTL outputs” system parameter whose count (i.e., the number of times that TTL output has been output since the system was started) is to be displayed on both the trace and XY plots.
3. Results
The system handles data output in two formats. At all times, current system activity is presented in graphical format by way of various plots and status displays. In addition, all trial-specific output may be saved to file during trial execution for archiving purposes as well as for future analysis.
3.1. Graphical output
Four plots/status displays serve to continuously feed all system activity back to the user. Since data display takes place on the host system (which is not a real-time environment), updates to the graphical displays are not required to take place deterministically. However, during our experiments lag between system display and actual system activity was rarely perceptible.
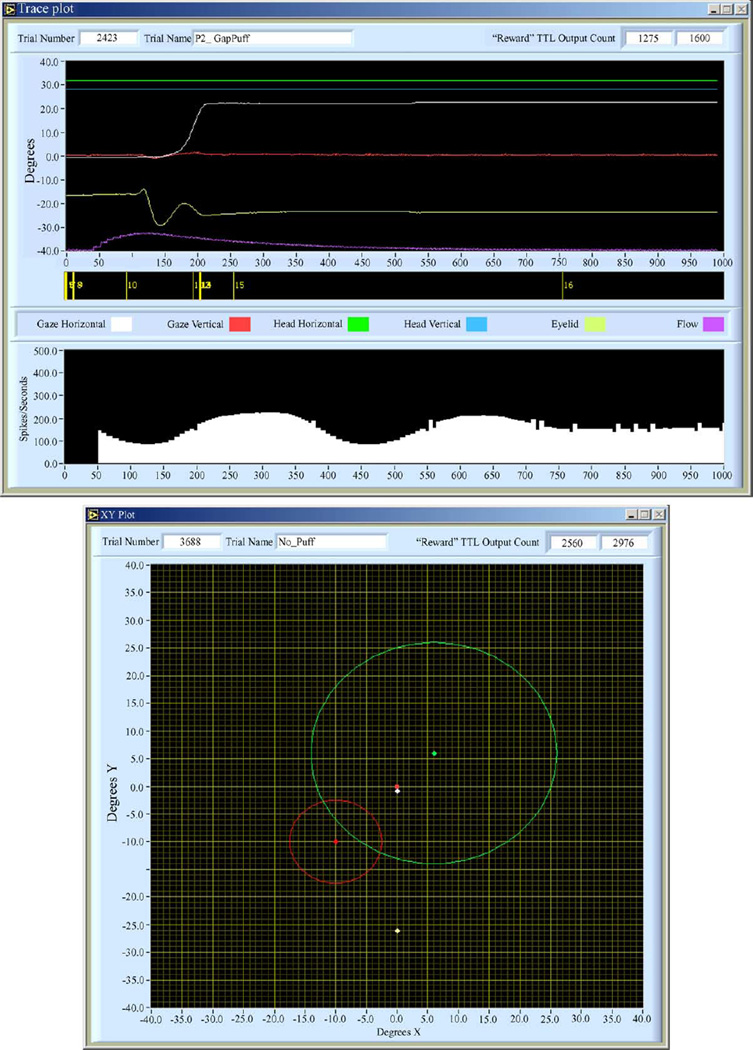
While trials (i.e., state tables) are executing, the Trace Plot (Fig. 5, top) presents temporal traces of the analog data acquired during the current trial (including horizontal and vertical eye and head positions and the two user-specified analog inputs (named “Eyelid” and “Flow” in the example figure below)). Neural discharge rate during the current trial (spikes/s) is also displayed on the trace plot, as is the onset of each of the current trial’s state table steps relative to the data acquired. The trace plot header indicates the current trial number (i.e., a value incremented whenever a state table is executed), the name of the state table currently being executed, and the current value of the TTL output count specified by the “displayed TTL output count” system parameter (as described above).
Fig. 5.
Trace/XY plots. The trace plot (above) presents temporal traces of analog data retrieved during execution of a single trial (note that the neural discharge data was simulated by manipulation of a frequency generator). The XY plot (below) displays system behavior (e.g., target color/placement, subject eye position, target windows, etc.) occurring in the spatial domain.
The XY Plot (Fig. 5, bottom) displays current head and eye position at all times. Additionally, while trials are executing, the XY plot indicates any currently displayed targets, as well as the windows configured around each target. As with the trace plot, the XY plot header presents the current trial number, current trial name, and current TTL output count.
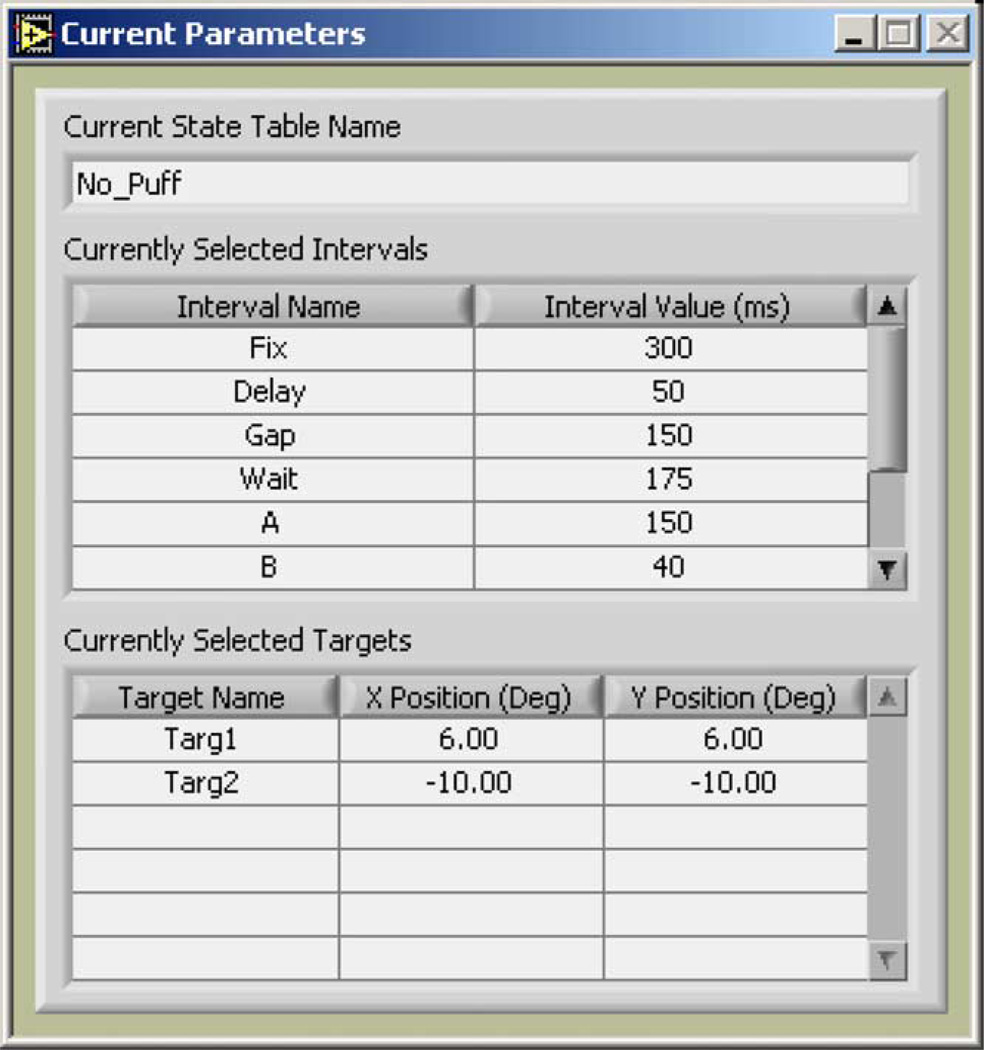
Two other displays utilized by the system to provide trial execution feedback are the Main Panel (Fig. 4) and the Current Parameters Panel (Fig. 6). In addition to providing the primary control/customization interface for the system (see Section 2.4), the Main Panel also reports all system errors and (when trials are executing) reports the trial number, final TTL output count, and trial name of the most recently executed trial (see the “Trace Plot” description above for a description of these values). Furthermore, while trials are being executed, the Current Parameters Panel displays the current state table (i.e., trial) name, as well as the specific system parameters selected by the system to support any variable entries within that state table.
Fig. 6.
Current parameters panel. While trials are executing on the system, the current parameters panel displays those specific values selected by the system to replace any variables defined within the current trial.
3.2. File output
Saving of trial-specific data files may be enabled or disabled based on user selection. If enabled, the system saves the following files for each trial into a user-specified storage location: (1) *.alg file—contains the analog data (at 1 kHz resolution) acquired during the trial, (2) *.spk file—contains the neural discharge timestamps (at 20MHz resolution) acquired relative to the start of the trial, (3) *.trn file—contains the state table step transitions and transition times (at 1 kHz resolution) relative to the start of the trial, (4) *.par file—contains the configuration of all system parameters at the time the trial was executed, including all available state tables and all available parameters to support those state tables, (5) *.tbl file—contains the specific state table selected (from within the current configuration) and executed for the trial, as well as the specific system parameters selected to support that state table, (6) *.msc file—contains miscellaneous trial data, such as the trial start time and the trial state table success, and (7) *.err file (if created)—contains the description of any error encountered during execution of the trial. All output files except the *.msc file are saved in binary format in order to optimize disk space requirements.
4. Discussion
4.1. Maximum capabilities
The system software is highly expandable, allowing an unlimited number of time intervals, state tables, and TTL outputs to be configured, saved, and referenced throughout the system. An unlimited number of targets may also be configured; however, due to an LED board design that allows for only a single LED to be displayed at any one time coupled with a system refresh rate of 1 kHz, flicker on our system becomes visible when more than 30 targets are displayed simultaneously.
Currently, the system supports up to six analog input channels (each sampled at a fixed rate of 1 kHz) and a single channel for recording neural discharge times (sampled at a fixed rate of 20 MHz). In addition, 16 digital output lines exist that may be switched at a maximum rate of 1 kHz.
4.2. System requirements
As noted in Section 2.1, the PC serving as the host computer in this system is a Dell OptiPlex with a 2.4 GHz Pentium 4 processor and 512 MB RAM. Other host computer configurations were not tested; however, any reasonably current PC having a TCP/IP port should be compatible with the system.
Storage requirements vary according to system configuration and trial length. For typical applications, file output per trial is approximately 15 KB + (2 KB × number of channels logged × trial length in seconds). Therefore, for a 5 s trial during which six analog channels were logged, total file output would require approximately 15 KB + (2 KB × 6 × 5) = 75 KB storage space per trial.
4.3. Conclusion
This paper introduced an open-source, LabVIEW-based system used to deterministically measure and control subject movement and neural data. Availing itself of the latest in real-time hardware, the system boasts a guaranteed data acquisition and system response rate of 1 ms. A transparent data exchange scheme with a host computer allows the real-time system to be run from a Windows-based PC, providing for an extremely high degree of power, flexibility, and user-friendliness for a deterministic system.
Comprehensive configuration options and the state table trial definition format allow the system to be used over a wide variety of oculomotor experiments. Furthermore, all data output by the system is available to be saved for future review and analysis. Comprised primarily of off-the-shelf components and open-source software, the system is reliable and easily reproduced at low cost.
Future plans for this system include the addition of more analog input channels to be available for recording during trial execution, analog output capability, and an online analysis feature that will perform and report specified data analysis routines as trials are executing.
Acknowledgements
We would like to acknowledge Jim Buhrman, Chris Keating, and Tim Nolan for their expert hardware support, Kathy Pearson for her aid in software development, and Desiree Bonadonna and Frank Phelps for their assistance in system operation and testing. In addition, we would like to acknowledge the laboratories of David Sparks and Paul Glimcher for the development of control strategies that served as a starting point for the development of this system. This work was supported by the Eye and Ear Foundation of the University of Pittsburgh and by grant number EY015485 from the National Institute of Health.
References
- Gandhi NJ, Bonadonna DK. Behavioral evaluation of motor preparation using saccade-blink interactions. Neural Control Mov (Abstr) 2004;9:H-10. [Google Scholar]
- Hays AV, Richmond BJ, Optican LM. A UNIX-based multiple-process system for real-time data acquisition and control; WESCON Proceedings Conference; 1982. pp. 1–10. [Google Scholar]
- Kodosky J, Dye R. Programming with pictures. Comput Lang. 1989;6:61–68. [Google Scholar]
- Kullmann PH, Wheeler DW, Beacom J, Horn JP. Implementation of a fast 16-Bit dynamic clamp using LabVIEW-RT. J Neurophysiol. 2004;91:542–554. doi: 10.1152/jn.00559.2003. [DOI] [PubMed] [Google Scholar]
- Poindessault J, Beauquin C, Gaillard F. Stimulation, data acquisition, spikes detection, and time/rate analysis with a graphical programming system: an application to vision studies. J Neurosci Methods. 1995;59:225–235. doi: 10.1016/0165-0270(94)00208-x. [DOI] [PubMed] [Google Scholar]
- Pruehsner WR, Liebler CM, Rodriguez-Campos F, Enderle JD. The eye tracker system—a system to measure and record saccadic eye movements. Biomed Sci Instrum. 2003;39:208–213. [PubMed] [Google Scholar]
- Sakatani T, Isa T. PC-based high-speed video-oculography for measuring rapid eye movements in mice. Neurosci Res. 2004;49:123–131. doi: 10.1016/j.neures.2004.02.002. [DOI] [PubMed] [Google Scholar]
- Venturcom, Inc. Hard Real-Time with Venturcom RTX on Microsoft Windows XP and Windows XP Embedded. Microsoft Developer Network. 2003 Sep; URL: http://msdn.microsoft.com/library/default.asp?url=/library/en-us/dnxpesp1/html/tchHardReal-TimeWithVenturcom-RTXOnMicrosoftWindowsXPWindowsXPEmbedded.asp.


