

Abstract
A number of studies have demonstrated that genetic variation at GABRA2 alters vulnerability to alcohol dependence. However, the exact identity of the causal variant(s), the relationship of these variants to other forms of substance use and behavioral illness is uncertain. Therefore, we genotyped 516 subjects from the Iowa Adoption Studies, a large longitudinal case and control adoption study of substance use, at 39 single nucleotide polymorphisms encompassing the GABRA2 locus and analyzed them with respect to their lifetime history of three common forms of substance use (alcohol (AD), nicotine (ND) and cannabis dependence (CD)), major depressive disorder (MDD) and antisocial personality disorder (ASPD) and relevant exposure variables. Using regression analysis, we found substantial evidence that both GABRA2 genotype and haplotype are significantly related to vulnerability to AD, ND and CD with the strongest relationships noted with respect to ND. Consistent with prior studies suggesting exposure is an important step in the development of substance use, we found the inclusion of substance exposure data in to our analytic models markedly increased the strength of the genetic associations of GABRA2 haplotype with substance use. Finally, we report that the genetic effects were markedly more pronounced in females than in males. We conclude that genetic variation at or near the GABRA2 locus significantly effects vulnerability not only to AD, but to other forms of substance use including ND and CD, and that the effects may be sex dependent.
INTRODUCTION
A wealth of convergent clinical and genetic data has implicated variation in GABAergic neurotransmission as a major factor in the development and maintenance of Alcohol Dependence (AD). Our understanding of GABA’s role in AD took a major leap forward in 2004 when the Collaborative Study of the Genetics of Alcoholism (COGA) group reported that genetic variation at GABRA2, a 4p13 that codes for a subunit of the GABA receptor, was associated with altered vulnerability to AD [1]. Since that time, most, but not all studies have replicated that initial finding with respect to AD [2–5] while other reports have extended the original findings to suggest that GABRA2 variability may also influence vulnerability to general drug dependence [6–8]. Taken together, these studies suggest that the GABRA2 locus has a pleiotropic effect on the risk for a broad range of substance use. Unfortunately, since many of the populations used in these studies were ascertained for alcoholism or another form of substance use, generating an unbiased understanding of the interrelationships of the substance use disorders to one another and other related behavioral illnesses such as major depressive disorder (MDD) and antisocial personality disorder (ASPD) from these data is not always possible.
The use of populations not ascertained for illness behavior, such as the Iowa Adoption Studies (IAS), could help decipher the interrelationships of these disorders. The IAS, founded by the late Remi Cadoret in the 1970’s, are a case and control adoption study that compare and contrast data from adoptees at high biological risk for substance use and ASPD (i.e. whose parents had severe substance use or ASPD) with that from adoptees at low biological risk for behavioral illness (i.e. whose parents had no history of behavioral illness). Because these adoptees were randomized into adoptive environments and ascertained because of their adoptive status, not their behavioral status, examination of behavioral outcomes in the IAS is not confounded by method of ascertainment. Therefore, although the IAS is not a general population sample, it is an epidemiologically sound and useful paradigm through which to explore the effect of genetic, environmental and gene environment interactions on human behavior.
Another advantage of using epidemiologically sound populations such as the IAS is the ability to unbiasedly consider the effects of gender on vulnerability to substance use. Prior epidemiological work suggests the presence of gender effects in drug use and drug dependence [9–11] with rates of ND being higher for females than for males but rates of dependence on alcohol and marijuana being higher among males [9].
Therefore, to more fully understand the role of GABRA2 in substance use and related behaviors, we densely genotyped the GABRA2 in DNA prepared from 516 IAS subjects who recently participated in the latest wave of our study and analyzed the resulting genetic data with the respect to their lifetime histories of substance use disorders (SUD), ASPD and MDD.
METHODS
The study design, methods and procedures used in the IAS have been described previously [12, 13]. Briefly, in four waves, the records of approximately 11,700 adoptees in the state of Iowa were reviewed and their families solicited to provide 475 adoptees with a biological family history of substance use or ASPD and 475 adoptees without a family history of behavioral illness. Over the past 30 years, these adoptees and their environments have systematically assessed using a variety of standardized instrument and semi-structured interviews. In the last two waves of the study (1999–2004 and 2004-current), each of the subjects was interviewed using the Semi-Structured Assessment for the Genetics of Alcoholism, Version II (SSAGA-II) [14]. Using a clinical data from these interviews, symptom counts for MDD (maximum score of 9), ASPD (maximum score of 7), and substance use (alcohol, nicotine and marijuana, maximum score of 7) were derived using criteria from DSM-IV [15] as per our previous methods [12, 16].
During the last wave of the current study, subjects were also phlebotomized to provide biomaterial for future studies. DNA from 516 subjects was prepared from these specimens using cold protein precipitation [17]. The resulting DNA was spectrophotometrically analyzed then diluted to 50 ng/μl. The DNA samples were then re-coded to insure anonymity, and shipped to Sequenom Inc (San Diego, USA), who performed the genotyping analyses of the single nucleotide polymorphisms (SNP) listed in Table 1 using their proprietary matrix-assisted laser desorption-ionization mass spectroscopy (MassARRAY®).
Table I.
Subject Demographics and Characteristics
| Male | Female | |
|---|---|---|
| 231 | 285 | |
| Ethnicity | ||
| Native American | 0 | 1 |
| White | 216 | 271 |
| Black | 7 | 4 |
| White, of Hispanic Origin | 6 | 5 |
| Other or no answer | 2 | 4 |
| Mean Age (years) | 47 ± 8 | 45± |
| Symptom Counts | ||||||||||
|---|---|---|---|---|---|---|---|---|---|---|
| AD | ND | CD | MDD | ASPD | ||||||
| M | F | M | F | M | F | M | F | M | F | |
| 0 | 81 | 149 | 109 | 145 | 183 | 254 | 146 | 116 | 36 | 101 |
| 1 | 59 | 63 | 14 | 20 | 16 | 7 | 2 | 1 | 67 | 101 |
| 2 | 38 | 36 | 19 | 18 | 10 | 10 | 5 | 7 | 49 | 36 |
| 3 | 30 | 14 | 25 | 22 | 8 | 4 | 10 | 8 | 26 | 19 |
| 4 | 6 | 10 | 28 | 35 | 4 | 4 | 7 | 13 | 22 | 14 |
| 5 | 6 | 5 | 17 | 28 | 4 | 4 | 14 | 21 | 19 | 7 |
| 6 | 6 | 2 | 16 | 14 | 6 | 1 | 11 | 31 | 9 | 7 |
| 7 | 5 | 6 | 3 | 3 | 6 | 1 | 23 | 37 | 3 | 0 |
| 8 | 7 | 30 | ||||||||
| 9 | 6 | 21 | ||||||||
The resulting genotype data was inspected for genotyping success rate and compliance with Hardy Weinberg equilibrium. Loci with less than 95% success rate or deviating from Hardy Weinberg equilibrium at less than p<0.01 were discarded. The surviving genotypic data was then analyzed for linkage disequilibrium (D′) using Haploview [18] and position data provided by The National Center for Biotechnology (NCBI) dbSNP database, Build 127 (http://www.ncbi.nlm.nih.gov/projects/SNP/). Guided by this analysis, haplotypes were inferred using PHASE version 2.1.1 [19].
The resulting genetic data and clinical data were analyzed using the JMP suite of programs (SAS Institute, Cary, USA) and the test subroutines described in the text or in the tables. As described above, Hardy-Weinberg equilibrium for each SNP was examined using Chi square analysis with a cut off value of p<0.01). Haplotype and genotype were analyzed using an additive model. Clinical syndrome symptom counts were treated as ordinal variables. All p-values reported are those using a two-tailed test.
RESULTS
Clinical and biomaterial from 516 subjects were used in this study. The demographic data and symptom counts for the subjects in the study are given in Table I. The study subjects are 55% female and 94% white. Consistent with Dr. Cadoret’s intentional loading of the study cohorts with adoptees with a biological family history of substance use and/or ASPD, high rates of substance use, MDD and ASPD are observed in the study subjects.
Consistent with prior observations in a smaller subset of the study cohorts [16], substance use counts for each of the three substance use syndromes, AD, ND and CD, are significantly correlated with each other (Pearson Correlation; Table II). Additionally, for both sexes, ASPD symptom count is significantly correlated with each of the three substance use syndromes. However, MDD symptom counts were significantly correlated with SUD symptom counts in males, but not females.
Table II.
Pearson Correlation Coefficients of Symptom Counts
| Female Subjects (N=285) | |||||
|---|---|---|---|---|---|
| AD | ND | CD | MDD | ASPD | |
| AD | 1.00 | ||||
| ND | 0.41 | 1.00 | |||
| CD | 0.38 | 0.35 | 1.00 | ||
| MDD | 0.22 | 0.08 | 0.14 | 1.00 | |
| ASPD | 0.43 | 0.46 | 0.48 | 0.30 | 1.00 |
| Male Subjects (N=231) | |||||
|---|---|---|---|---|---|
| AD | ND | CD | MDD | ASPD | |
| AD | 1.00 | ||||
| ND | 0.49 | 1.00 | |||
| CD | 0.44 | 0.37 | 1.00 | ||
| MDD | 0.26 | 0.18 | 0.20 | 1.00 | |
| ASPD | 0.38 | 0.33 | 0.37 | 0.19 | 1.00 |
Bolded values indicate Pearson Chi Square values of p<0.05 or less.
A total of 516 DNA samples were genotyped at 39 SNPs loci. Genotype data from an additional 11 SNP loci were discarded because of genotyping success rates of less than 95%. The identity, position and minor allele frequency (MAF) for each of the successfully genotyped loci are given in left-hand portion of Table II. Overall, the SNPs were fairly informative with only two SNPs having MAF’s of less than 0.25.
The position of each of these SNPs with respect to the intron exon structure of GABRA2 and the amount of linkage disequilibrium between the markers are given in Figure 1. As the figure demonstrates, an extensive block of linkage disequilibrium extending from intron three into the intergenic region between GABRA2 and the neighboring gene, GABRG1 is present. However, linkage disequilibrium quickly decays immediately 3′ to GABRA2 exon three with only marginal linkage disequilibrium being present between the 4 most centromeric SNPs in our study. This breakdown in disequilibrium does not appear to be secondary to genotyping difficulties with each of these markers having genotyping success rates of 99.3% or greater and is consistent with prior dense haplotyping of this region [1].
Figure 1.

The position of each of the SNP markers relative to the intron-exon structure of GABRA2 and the amount of linkage disequilibrium (D′) between the markers as per Haploview [18]. Please note that due to distortions of scale necessary for visualization of the placement of the exons, that some markers erroneously appear to be in the coding sections of GABRA2. Only rs279858 (exon 5) and rs573400 (exon 10) are actually in the coding sections of GABARA2. In order to improve visual clarity, all D′ values are shown here multiplied × 100 as to avoid the necessity to display decimal points. The D′ value in blocks without numbers is 1.00.
As a preliminary exploration, we examined the relationship of each SNP genotype to the symptom count for each syndrome, using an additive model without adjustment for sex (ANOVA). The results of these analyses are given in the right-hand portion of Table III. As the Table demonstrates, nominally significant p values are observed for AD, ND and CD throughout the area of strong linkage disequilibrium with the notable exception of rs11503016. However, this pattern of significant associations with AD, ND and CD abruptly ends centromeric to exon three. In contrast, to the strong associations consistently noted for the substance use syndromes, only one nominally significant association between genotype and either MDD or ASPD was noted (at rs11503016 for MDD).
Table III.
SNP Information and Single Point Association Analyses with Major Phenotypes
| # | db SNP ID | position* | Type | MAF | Risk Allele | AD | ND | CD | MDD | ASPD |
|---|---|---|---|---|---|---|---|---|---|---|
| 1 | rs490434 | 1 | AG | 0.45 | G | <0.06 | <0.06 | <0.06 | <0.37 | <0.67 |
| 2 | rs576666 | 9097 | GT | 0.44 | G | <0.05 | <0.03 | <0.02 | <0.49 | <0.74 |
| 3 | rs531460 | 17929 | AG | 0.43 | G | <0.1 | <0.02 | <0.05 | <0.56 | <0.68 |
| 4 | rs561779 | 46441 | CT | 0.45 | C | <0.04 | <0.02 | <0.02 | <0.42 | <0.63 |
| 5 | rs495818 | 55558 | AG | 0.44 | A | <0.04 | <0.03 | <0.02 | <0.47 | <0.73 |
| 6 | rs572227 | 59073 | AG | 0.44 | G | <0.05 | <0.02 | <0.02 | <0.48 | <0.73 |
| 7 | rs573400 | 59746 | AG | 0.44 | A | <0.05 | <0.03 | <0.02 | <0.45 | <0.71 |
| 8 | rs481311 | 62062 | AT | 0.45 | A | <0.04 | <0.05 | <0.03 | <0.46 | <0.5 |
| 9 | rs507788 | 65138 | AG | 0.45 | A | <0.03 | <0.02 | <0.03 | <0.39 | <0.57 |
| 10 | rs532780 | 69046 | CT | 0.45 | T | <0.03 | <0.01 | <0.03 | <0.48 | <0.57 |
| 11 | rs548583 | 71024 | CT | 0.46 | C | <0.04 | <0.02 | <0.02 | <0.43 | <0.52 |
| 12 | rs496650 | 72066 | GT | 0.46 | T | <0.03 | <0.05 | <0.02 | <0.26 | <0.35 |
| 13 | rs526752 | 84262 | AG | 0.45 | A | <0.03 | <0.01 | <0.03 | <0.36 | <0.5 |
| 14 | rs530329 | 88752 | CT | 0.45 | T | <0.03 | <0.02 | <0.03 | <0.36 | <0.56 |
| 15 | rs483160 | 94706 | AC | 0.46 | C | <0.03 | <0.01 | <0.04 | <0.48 | <0.51 |
| 16 | rs279871 | 113365 | AG | 0.47 | A | <0.04 | <0.01 | <0.02 | <0.33 | <0.5 |
| 17 | rs279869 | 115627 | AC | 0.47 | C | <0.03 | <0.05 | <0.01 | <0.3 | <0.28 |
| 18 | rs279867 | 115935 | GT | 0.47 | T | <0.03 | <0.03 | <0.02 | <0.35 | <0.38 |
| 19 | rs279866 | 117396 | AG | 0.47 | A | <0.04 | <0.02 | <0.01 | <0.43 | <0.37 |
| 20 | rs1808851 | 119078 | AG | 0.46 | A | <0.03 | <0.02 | <0.01 | <0.33 | <0.51 |
| 21 | rs279861 | 120956 | CT | 0.47 | G | <0.05 | <0.02 | <0.02 | <0.51 | <0.55 |
| 22 | rs279858 | 122224 | AG | 0.46 | A | <0.05 | <0.02 | <0.03 | <0.44 | <0.65 |
| 23 | rs279843 | 132837 | CT | 0.46 | C | <0.05 | <0.04 | <0.04 | <0.51 | <0.4 |
| 24 | rs279845 | 137355 | AT | 0.47 | T | <0.04 | <0.1 | <0.05 | <0.78 | <0.37 |
| 25 | rs183961 | 138660 | CT | 0.46 | T | <0.04 | <0.09 | <0.06 | <0.9 | <0.57 |
| 26 | rs1440130 | 140885 | CT | 0.47 | T | <0.05 | <0.09 | <0.07 | <0.86 | <0.5 |
| 27 | rs279826 | 141841 | AG | 0.48 | A | <0.04 | <0.13 | <0.06 | <0.62 | <0.39 |
| 28 | rs11503016 | 142126 | AT | 0.12 | A | <0.12 | <0.17 | <0.14 | <0.16 | <0.05 |
| 29 | rs279827 | 142334 | AG | 0.48 | A | <0.05 | <0.1 | <0.08 | <0.69 | <0.53 |
| 30 | rs279828 | 142442 | AC | 0.47 | A | <0.04 | <0.11 | <0.07 | <0.74 | <0.55 |
| 31 | rs279834 | 145931 | CG | 0.45 | G | <0.04 | <0.07 | <0.03 | <0.84 | <0.63 |
| 32 | rs279837 | 146955 | AG | 0.45 | A | <0.05 | <0.06 | <0.03 | <0.98 | <0.54 |
| 33 | rs279841 | 148395 | AG | 0.45 | G | <0.03 | <0.04 | <0.02 | <0.81 | <0.57 |
| 34 | rs189957 | 154315 | AG | 0.48 | A | <0.04 | <0.23 | <0.1 | <0.91 | <0.38 |
| 35 | rs1442059 | 164589 | CT | 0.45 | T | <0.03 | <0.06 | <0.03 | <0.79 | <0.74 |
| 36 | rs1442061 | 178858 | CG | 0.27 | <0.08 | <0.47 | <0.48 | <0.5 | <0.68 | |
| 37 | rs11503014 | 198491 | CG | 0.32 | <0.66 | <0.22 | <0.77 | <0.45 | <0.2 | |
| 38 | rs2165607 | 207847 | CG | 0.07 | <0.85 | <0.82 | <0.52 | <0.52 | <0.69 | |
| 39 | rs1545234 | 212039 | AG | 0.32 | A | <0.1 | <0.01 | <0.86 | <0.76 | <0.33 |
All SNP positions are given relative to rs rs490434 whose position in NCBI Build 36.2 is bp 45888036.
All values are nominal. For each SNP, the risk allele is constant in all significant comparisons.
We next inferred haplotypes using PHASE and the genotype data from SNP 1 to 35. Using the data from each of these SNPs, 6 haplotypes with a frequency of greater than 1% were observed (Figure 2). Three of the haplotypes (Haplotypes 1, 2 and 3) accounted for the vast majority of the observed haplotypes, with three other haplotypes occurring at frequencies between 1 and 2%. In total, these six haplotypes accounted for ~93% of the total observed haplotypes. In addition, there were twenty haplotypes that were observed only once. Visual inspection of each of these haplotypes which were formed using data from all 35 SNPs showed that almost all of these singularly observed haplotypes differed from the six major haplotypes by only one genotype. Since the haplotype information for these 516 subjects represent 18,060 individual genotypes, even if we assume that our genotyping accuracy rate is 99.9%, it is probable that a substantial portion of these haplotypes that were observed only once are actually artifacts secondary to genotyping errors. Therefore, we re-imputed haplotypes using the data from a set of four SNP that together could distinguish the six major haplotypes [SNPs 3 (rs531460), 23 (rs279843), 26 (rs1440130) and 28 (rs11503016), see Figure 2]. Using this method, we once again observed six haplotypes whose frequency was greater than 1%. However, this time these six haplotypes accounted for 99.2% of all the haplotype diversity.
Figure 2.
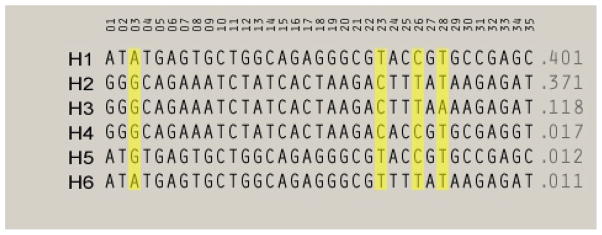
SNP Haplotypes and their frequency as imputed using data from all 35 SNPs. The yellow lines designate the four SNPs used to form the haplotypes used in the analyses.
Comparison of the single point analyses is shown in Table III. As the table demonstrates, nominally significant associations or trends for associations for each of the categories of SUD were found at almost every point of the extended region of disequilibrium (see Figure 1) stretching from exon 3 of GABRA2 extending into the intergenic region between GABRA2 and GABRG1 (SNPs 1 to 35). One notable exception to this was at SNP 28 (rs 11503016), which corresponds to the only noted difference between haplotypes 2 and 3 (see Figure 2). Interestingly, that polymorphism was also the only SNP that was nominally significantly associated with either ASPD or MDD with both of the flanking SNPs showing no evidence of association.
Using this haplotype information, using an additive risk model, we conducted ordinal logistic regression analyses with respect to five major phenotypes found in the IAS. We specified haplotypes 2, 3, 4 and 6 as “risk haplotypes” because these haplotypes (see Figure 2), in at least part, contain some of the risk variants from the SNPs from Table II. For example, haplotypes 2 and 3 each have the “risk alleles” from all of the 32 SNPs significantly associated with AD from Table II, while haplotype 4 has 25 of the “risk alleles”, and haplotype 6 has 12 of the “risk alleles” from Table II. Because the rates of each of these disorders differ by sex, we conducted each of these analyses using all subjects combined, then separately by sex. Table IV delineates the classification scheme, the number of “risk” haplotypes included under each model.
Table IV.
Ordinal Logistic Regression Analyses of Haplotype and Symptom Count Data.
| Classification Scheme | # Risk Alleles | AD | ND | CD | MDD | ASPD |
|---|---|---|---|---|---|---|
| Haplotype 2 Only | ||||||
| Male | 181 | <0.77 | <0.2 | <0.77 | <0.42 | <0.12 |
| Female | 222 | <0.19 | <0.02 | <0.36 | <0.54 | <0.55 |
| Combined | 403 | <0.24 | <0.33 | <0.41 | <0.39 | <0.51 |
| Haplotype 3 Only | ||||||
| Male | 56 | <0.28 | <0.09 | <0.17 | <0.02 | <0.02 |
| Female | 68 | <0.24 | <0.71 | <0.5 | <0.9 | <0.41 |
| Combined | 124 | <0.12 | <0.15 | <0.15 | <0.14 | <0.05 |
| Haplotypes 2 & 3 | ||||||
| Male | 237 | <0.32 | <0.95 | <0.25 | <0.49 | <0.23 |
| Female | 290 | <0.03 | <0.005 | <0.16 | <0.6 | <0.99 |
| Combined | 527 | <0.03 | <0.06 | <0.08 | <0.91 | <0.48 |
| Haplotypes 2, 3 & 4 | ||||||
| Male | 252 | <0.19 | <0.86 | <0.07 | <0.16 | <0.62 |
| Female | 299 | <0.05 | <0.002 | <0.09 | <0.7 | <0.2 |
| Combined | 551 | <0.03 | <0.02 | <0.02 | <0.44 | <0.4 |
| Haplotypes 2, 3 & 6 | ||||||
| Male | 252 | <0.77 | <0.97 | <0.5 | <0.77 | <0.85 |
| Female | 309 | <0.04 | <0.02 | <0.26 | <0.81 | <0.28 |
| Combined | 561 | <0.08 | <0.08 | <0.22 | <0.95 | <0.65 |
Bolded values are significant at p<0.05. All values are not corrected for multiple comparisons.
In general, the stepwise inclusion of haplotype information progressively strengthened the associations between ND and AD with the models specifying haplotypes 2, 3 and 4 being significantly associated with all three forms of substance uses disorders (SUD). Of note, the associations tended to be stronger for the female subjects than for the male subjects. Interestingly, a significant association with ASPD and MDD using the regression model specifying only haplotype 3 was noted. However, no other significant associations with either MDD or ASPD were noted under any other model.
Because exposure to a substance is a necessary step in the development of SUD, we next included exposure data for the three classes of SUD. For AD, we used the question “have you ever drank alcohol?” as the determinant of exposure for our model. For ND, we used two different levels of exposure. The first level of exposure was the question “Have you ever smoked?”. The second more stringent level was determined by their response to the question “In your lifetime, have you smoked 100 cigarettes?” Once again, inclusion of this data strengthened the significance of the associations for both AD and ND (Table V). Interestingly, the effects of GABRA2 haplotype were again markedly more pronounced in the female subjects than in the male subjects.
Table V.
Substance Dependence Regression Analyses Adjusted for Exposure Data
| Classification Scheme | AD1 | ND2 Model 1 | ND3 Model 2 | CD4 |
|---|---|---|---|---|
| Subjects Excluded | 5 | 251 | 53 | 185 |
| Haplotype 2 Only | ||||
| Male | <0.83 | <0.71 | <0.24 | <0.67 |
| Female | <0.18 | <0.13 | <0.02 | <0.43 |
| Combined | <0.25 | <0.33 | <0.28 | <0.43 |
| Haplotype 3 Only | ||||
| Male | <0.31 | <0.005 | <0.23 | <0.17 |
| Female | <0.22 | <0.31 | <0.38 | <0.31 |
| Combined | <0.13 | <0.001 | <0.14 | <0.08 |
| Haplotypes 2 & 3 | ||||
| Male | <0.38 | <0.54 | <0.76 | <0.22 |
| Female | <0.03 | <0.02 | <0.002 | <0.13 |
| Combined | <0.03 | <0.04 | <0.04 | <0.06 |
| Haplotypes 2, 3 & 4 | ||||
| Male | <0.22 | <0.86 | <0.91 | <0.06 |
| Female | <0.04 | <0.002 | <0.005 | <0.09 |
| Combined | <0.03 | <0.03 | <0.02 | <0.02 |
| Haplotypes 2, 3 & 6 | ||||
| Male | <0.84 | <0.24 | <0.91 | <0.35 |
| Female | <0.04 | <0.03 | <0.004 | <0.24 |
| Combined | <0.09 | <0.02 | <0.05 | <0.15 |
Bolded values are significant at p<0.05. All values are not corrected for multiple comparisons.
Five subjects report a history of never having ingested alcohol.
Two hundred fifty one subjects deny smoking at least 100 cigarettes. These subjects were excluded from the analysis under this model.
Fifty three subjects deny ever having smoked a cigarette. These subjects were excluded from the analysis under this model.
One hundred eighty five subjects deny ever having smoked cannabis.
Finally, because this is a population sample that was ascertained for adoption status, not for illness status, it is possible for us to provide an estimate of the odds ratios for the effects of these haplotypes on risk for SUD in the population. Therefore, we calculated odds ratios for nicotine dependence using Model 2 for ND (those who have not ever smoked were excluded), specifying haplotypes 2, 3 and 4 as the risk haplotypes and categorizing those with 3 or more symptoms of ND as ND and those with 2 or less as non-nicotine dependent. Using this classification system, the odds ratio for ND for those with 2 risk haplotypes as compared to those with no risk haplotypes was 1.82 (95% CI 1.06 to 3.16, n=221). Consistent with the regression analyses, the odds ratio was considerably greater for females (3.73, 95% CI 1.71 to 8.39, n=113) than in males (0.89, 95% CI 0.41 to 1.93, n=108).
DISCUSSION
In summary, using the clinical and biomaterial resources of the IAS, we confirm several prior reports that both GABRA2 genotype and haplotype are associated with risk for alcohol dependence and other forms of SUD [1, 2, 7]. We also provide strongly suggestive evidence that the effects of GABRA2 haplotype may be sex dependent and in fact may be as strong with respect to ND as with AD. Likewise, results suggest a greater role for genetic vulnerability given evidence of environmental exposure. Finally, we provide the first odds ratios for the effects of GABRA2 on substance dependence using a non-clinical population sample.
Before these data and results are discussed, a few caveats are in order. First, though epidemiologically sound [12], the IAS is a high risk adoption, largely white, population. Therefore, extrapolation to non-white populations should be done with caution. Second, the average age of the participants is in the forties. Since the phenomenology of many forms of substance use varies with age, extension of these findings to younger or older cohorts should also be done with caution. In particular, the effects on initiation of use on haplotype risk should be examined in younger cohorts who are entering the age of risk for first use. Finally, the number of subjects in the current study is relatively limited.
Overall, these results resoundingly confirm the prior findings with respect to GABRA2. The haplotypes designated as the risk factors correspond exactly to those reported by Edenberg and colleagues (i.e., rs279871 is A, rs279845 is T, see Table 2 from Edenberg and colleages) [1]. This work also extends those findings by demonstrating that the risk conferred by GABRA2 haplotypes is not just limited to AD and can be observed using a sample that was not collected because of the occurrence of alcohol related problems. Rather, in this adoption sample, we find significant relationships between genetic variation at GABRA2 with respect to all three common forms of SUD in our population which suggests that this locus be considered as a risk for SUDs in general, rather than just a locus for AD. Alternatively, these data could be interpreted to suggest that substance use disorders may be an overlapping syndrome with common causes whose manifestation may reflect interactions between genetic vulnerability and environmental factors such as substance exposure and availability [20, 21].
Although significant findings were reported with respect to AD and CD, the most robust findings were reported with respect to ND. The reasons for this are uncertain. However, it simply may be a matter of power. Both CD and AD were less frequent in our population than ND.
Consideration of exposure data markedly increased the significance of the associations with ND, but AD. All of this was to be expected. Since our exposure criterion “have you ever had a drink?” excluded only five subjects, a notable effect on AD should not be expected. However, with respect to ND, more non-exposed subjects were eliminated, the effects were comparatively stronger. Interestingly, roughly equally significant associations were obtained using either model despite the fact Model 1 excluded the data from nearly half the subjects, while Model 2 excluded data from only 10% of the subjects. This may suggest that, with respect to already existing biobank datasets, that either ND model can be used depending on what information is available in the data set.
The finding that the effects of GABRA2 haplotype were sex dependent was not expected. Since gender specific effects of other genetic variants have been routinely reported in other complex syndromes such as diabetes, obesity and hyperlipidemia [22, 23], it is not surprising to see that they may exist with respect to complex behavioral disorders as well. At the same time, if this finding is replicated, it may suggest that the pathways to ND in males and females are different and that careful dissection of these pathways may identify potential strategies to reduce the frequency of ND.
What is the exact genetic variation that is associated with differential vulnerability?
Unfortunately, the current data do not provide us with the exact information with any degree of certainty. Clearly, further genotyping of this region to define the exact haplotype blocks and resequencing to define the exact sequence of those blocks is indicated in this and other samples. Perhaps then, after the sequence data is skillfully bioinformatically interrogated and animal modeling and CNS gene expression studies are conducted, the exact nature of the variants associated with illness can be revealed. We tried to examine the effects of GABRA2 genotype on gene expression using the lymphoblast cell line surrogate model that we have successfully used with respect to other genetic variation [24, 25] and of direct relevance, nicotine dependence [26], but the amount of gene expression was nearly undetectable (unpublished data).
In summary, we confirm prior reports that GABRA2 genotype and haplotype is associated with AD, as well as other types of substance use disorders. We also demonstrate that the effects are sex dependent and strongly suggest collaborative efforts to define the exact nature of the causal genetic variation are in order.
Acknowledgments
This work was supported by grants to RAP (DA015789) and grants R01AA017768, R01DA01923, R01DA021736, R01HD03058814 to GHB. The investigative team acknowledges a debt of gratitude to the late Dr. Remi Cadoret, the founder of the IAS who jointly planned these studies with RAP.
Footnotes
The authors do not have any conflicts with respect to this work.
References
- 1.Edenberg HJ, Dick DM, Xuei X, et al. Variations in GABRA2, encoding the alpha 2 subunit of the GABA(A) receptor, are associated with alcohol dependence and with brain oscillations. Am J Hum Genet. 2004;74(4):705–14. doi: 10.1086/383283. [DOI] [PMC free article] [PubMed] [Google Scholar]
- 2.Covault J, Gelernter J, Hesselbrock V, Nellissery M, Kranzler HR. Allelic and haplotypic association of GABRA2 with alcohol dependence. Am J Med Genet B Neuropsychiatr Genet. 2004;129(1):104–9. doi: 10.1002/ajmg.b.30091. [DOI] [PubMed] [Google Scholar]
- 3.Fehr C, Sander T, Tadic A, et al. Confirmation of association of the GABRA2 gene with alcohol dependence by subtype-specific analysis. Psychiatr Genet. 2006;16(1):9–17. doi: 10.1097/01.ypg.0000185027.89816.d9. [DOI] [PubMed] [Google Scholar]
- 4.Soyka M, Preuss UW, Hesselbrock V, et al. GABA-A2 receptor subunit gene (GABRA2) polymorphisms and risk for alcohol dependence. Journal of Psychiatric Research. doi: 10.1016/j.jpsychires.2006.11.006. In Press, Corrected Proof. [DOI] [PubMed] [Google Scholar]
- 5.Matthews AG, Hoffman EK, Zezza N, Stiffler S, Hill SY. The role of the GABRA2 polymorphism in multiplex alcohol dependence families with minimal comorbidity: within-family association and linkage analyses. J Stud Alcohol Drugs. 2007;68(5):625–33. doi: 10.15288/jsad.2007.68.625. [DOI] [PMC free article] [PubMed] [Google Scholar]
- 6.Dick D, Bierut L, Hinrichs A, et al. The Role of GABRA2 in Risk for Conduct Disorder and Alcohol and Drug Dependence across Developmental Stages. Behavior Genetics. 2006;36(4):577–590. doi: 10.1007/s10519-005-9041-8. [DOI] [PubMed] [Google Scholar]
- 7.Arpana A, Howard JE, Tatiana F, et al. Association of GABRA2 with Drug Dependence in the Collaborative Study of the Genetics of Alcoholism Sample. Behavior Genetics. 2006;V36(5):640–650. doi: 10.1007/s10519-006-9069-4. [DOI] [PubMed] [Google Scholar]
- 8.Tomas Drgon CDAGRU. Linkage disequilibrium, haplotype and association studies of a chromosome 4 GABA receptor gene cluster: Candidate gene variants for addictions. American Journal of Medical Genetics Part B: Neuropsychiatric Genetics. 2006;141B(8):854–860. doi: 10.1002/ajmg.b.30349. [DOI] [PMC free article] [PubMed] [Google Scholar]
- 9.Kandel D, Chen K, Warner LA, Kessler RC, Grant B. Prevalence and demographic correlates of symptoms of last year dependence on alcohol, nicotine, marijuana and cocaine in the U.S. population. Drug and Alcohol Dependence. 1997;44(1):11–29. doi: 10.1016/s0376-8716(96)01315-4. [DOI] [PubMed] [Google Scholar]
- 10.Lynskey MT, Heath AC, Nelson EC, et al. Genetic and environmental contributions to cannabis dependence in a national young adult twin sample. Psychol Med. 2002;32(2):195–207. doi: 10.1017/s0033291701005062. [DOI] [PubMed] [Google Scholar]
- 11.Cutrona CE, Cadoret RJ, Suhr JA, et al. Interpersonal variables in the prediction of alcoholism among adoptees: evidence for gene-environment interactions. Compr Psychiatry. 1994;35(3):171–9. doi: 10.1016/0010-440x(94)90188-0. [DOI] [PubMed] [Google Scholar]
- 12.Yates W, Cadoret R, Troughton E. The Iowa Adoption Studies Methods and Results. In: LaBuda M, Grigorenko E, editors. On the way to individuality: Methodological Issues in Behavioral Genetics. Nova Science Publishers; Hauppauge NY: 1998. pp. 95–125. [Google Scholar]
- 13.Cadoret RJ, Yates WR, Troughton E, Woodworth G, Stewart MA. Adoption study demonstrating two genetic pathways to drug abuse. Arch Gen Psychiatry. 1995;52(1):42–52. doi: 10.1001/archpsyc.1995.03950130042005. [DOI] [PubMed] [Google Scholar]
- 14.Bucholz KK, Cadoret R, Cloninger CR, et al. A new, semi-structured psychiatric interview for use in genetic linkage studies: a report on the reliability of the SSAGA. J Stud Alcohol. 1994;55(2):149–58. doi: 10.15288/jsa.1994.55.149. [DOI] [PubMed] [Google Scholar]
- 15.Association, AP. Diagnostic and Statistical Manual of Mental Disorder. 4. Washington D.C: American Psychiatric Association; 1994. [Google Scholar]
- 16.Philibert RA, Ryu GY, Yoon JG, et al. Transcriptional profiling of subjects from the Iowa adoption studies. Am J Med Genet B Neuropsychiatr Genet. 2007;144(5):683–90. doi: 10.1002/ajmg.b.30512. [DOI] [PubMed] [Google Scholar]
- 17.Lahiri DK, Nurnberger JI., Jr A rapid non-enzymatic method for the preparation of HMW DNA from blood for RFLP studies. Nucleic Acids Research. 1991;19(19):5444. doi: 10.1093/nar/19.19.5444. [DOI] [PMC free article] [PubMed] [Google Scholar]
- 18.Barrett JC, Fry B, Maller J, Daly MJ. Haploview: analysis and visualization of LD and haplotype maps. Bioinformatics. 2005;21(2):263–5. doi: 10.1093/bioinformatics/bth457. [DOI] [PubMed] [Google Scholar]
- 19.Stephens M, Smith NJ, Donnelly P. A new statistical method for haplotype reconstruction from population data. Am J Hum Genet. 2001;68(4):978–89. doi: 10.1086/319501. [DOI] [PMC free article] [PubMed] [Google Scholar]
- 20.Tsuang MT, Bar JL, Harley RM, Lyons MJ. The Harvard Twin Study of Substance Abuse: what we have learned. Harv Rev Psychiatry. 2001;9(6):267–79. [PubMed] [Google Scholar]
- 21.Kendler KS, Jacobson KC, Prescott CA, Neale MC. Specificity of genetic and environmental risk factors for use and abuse/dependence of cannabis, cocaine, hallucinogens, sedatives, stimulants, and opiates in male twins. Am J Psychiatry. 2003;160(4):687–95. doi: 10.1176/appi.ajp.160.4.687. [DOI] [PubMed] [Google Scholar]
- 22.Schooling CM. Growth Environment and Sex Differences in Lipids, Body Shape and Diabetes Risk. PLoS ONE. 2007;2(10):e1070. doi: 10.1371/journal.pone.0001070. [DOI] [PMC free article] [PubMed] [Google Scholar]
- 23.Lee JC, Weissglas-Volkov D, Kyttala M, et al. USF1 Contributes to High Serum Lipid Levels in Dutch FCHL Families and U.S. Whites With Coronary Artery Disease. Arterioscler Thromb Vasc Biol. 2007;27(10):2222–2227. doi: 10.1161/ATVBAHA.107.151530. [DOI] [PubMed] [Google Scholar]
- 24.Philibert R, Madan A, Andersen A, et al. Serotonin transporter mRNA levels are associated with the methylation of an upstream CpG island. Am J Med Genet B Neuropsychiatr Genet. 2007;144(1):101–5. doi: 10.1002/ajmg.b.30414. [DOI] [PubMed] [Google Scholar]
- 25.Philibert RA, Sandhu H, Hollenbeck N, et al. The Relationship of 5HTT Methylation and Genotype on mRNA Expression and Liability to Major Depression and Alcohol Dependence in Subjects from the Iowa Adoption Studies. American Journal of Medical Genetics Part B: Neuropsychiatric Genetics. 2007 doi: 10.1002/ajmg.b.30657. epub ahead of publication. [DOI] [PMC free article] [PubMed] [Google Scholar]
- 26.Philibert RA, Gershenfeld HK. Therapeutic potential of targeting gene variants in schizophrenia. Expert Rev Neurother. 2007;7(7):757–60. doi: 10.1586/14737175.7.7.757. [DOI] [PubMed] [Google Scholar]