

Abstract
Background
Accurate closed-loop control is essential for developing artificial pancreas (AP) systems that adjust insulin infusion rates from insulin pumps. Glucose concentration information from continuous glucose monitoring (CGM) systems is the most important information for the control system. Additional physiological measurements can provide valuable information that can enhance the accuracy of the control system. Proportional-integral-derivative control and model predictive control have been popular in AP development. Their implementations to date rely on meal announcements (e.g., bolus insulin dose based on insulin:carbohydrate ratios) by the user. Adaptive control techniques provide a powerful alternative that do not necessitate any meal or activity announcements.
Materials and Methods
Adaptive control systems based on the generalized predictive control framework are developed by extending the recursive modeling techniques. Physiological signals such as energy expenditure and galvanic skin response are used along with glucose measurements to generate a multiple-input–single-output model for predicting future glucose concentrations used by the controller. Insulin-on-board (IOB) is also estimated and used in control decisions. The controllers were tested with clinical studies that include seven cases with three different patients with type 1 diabetes for 32 or 60 h without any meal or activity announcements.
Results
The adaptive control system kept glucose concentration in the normal preprandial and postprandial range (70–180 mg/dL) without any meal or activity announcements during the test period. After IOB estimation was added to the control system, mild hypoglycemic episodes were observed only in one of the four experiments. This was reflected in a plasma glucose value of 56 mg/dL (YSI 2300 STAT; Yellow Springs Instrument, Yellow Springs, OH) and a CGM value of 63 mg/dL).
Conclusions
Regulation of blood glucose concentration with an AP using adaptive control techniques was successful in clinical studies, even without any meal and physical activity announcement.
Introduction
Significant advances have been made in the development of an artificial pancreas (AP) in recent years.1 The control system of an AP calculates the appropriate amount of insulin to be infused by an insulin infusion pump based on glucose concentration measurements from a continuous glucose monitoring (CGM) system. Glycemic control can be achieved by a completely automated external closed-loop insulin delivery.2
Various automatic control strategies with different modeling algorithms have been investigated during the last three decades.2–7 The first trials were done with a proportional (P)-integral (I)-derivative (D) (PID) controller,2–4 which is a well-known control strategy. The P gain determines insulin in proportion to the difference between current blood glucose concentration (BGC) and the target glucose concentration; the I and D gains are used for slow second-phase rise and rapid first-phase rise, respectively, during hypoglycemia. Although early clinical trials showed that there is not a significant difference on mean glucose levels between open-loop and closed-loop control with the PID strategy,2 recent studies8–10 using insulin feedback in a PID controller demonstrated better regulation performance with reduced occurrence of hypoglycemia. Under the PID strategy, gastric emptying was artificially delayed with preprandial injections of pramlintide (an amylin analog) to compensate the delays in absorption of insulin.11 The model-predictive-control (MPC) strategy was found to have better performance than classical PID controllers in terms of handling time delays in the system and accommodating constraints on both manipulated and observed variables. MPC was used in closed-loop studies5,12,13 where the loop was closed at night after dinner and opened after breakfast (from 3.5 h after having dinner until the next day before lunch). Both PID and MPC control strategies have some limitations. Determination of P, I, and D gains in the PID controller is subjective and condition specific. There are methods such as the Ziegler–Nichols method to determine the first guesses of these parameters. However, the parameters determined by the Ziegler–Nichols method (or others) have to be retuned when a patient's metabolism, physical activities, or emotional state changes significantly. Because the dynamics of BGC vary from subject to subject and are also time-varying,14 these controller parameters have to be retuned for every significant change in BGC dynamics. The MPC method5,12,13,15 can be implemented by using an in silico metabolic model.16 Using the model created, meal and exercise information is given to the model as known disturbances during closed-loop operation. In these studies, closed-loop trials are preceded by an open-loop day because the time and the amount of meal have to be entered to the algorithm in the open-loop day and the same type of meal at the same time as the open-loop day is provided in the closed-loop experiment day. In case meals are not announced to the MPC algorithms and the classic additive disturbance assumption is used, the performance may not be good enough in terms of disturbance rejection.17 A Kalman filter can be used along with MPC to predict unmeasured meal disturbance for having better disturbance rejection.18
Adaptive control strategies are considered to be an alternative to overcome such problems. Adaptive control strategy based on generalized predictive control (GPC) was proposed.6,7,19,20 Closed-loop studies were conducted to assess the performance of GPC during6 and following20 exercise. The recursive least square parameter estimation method was used to identify unknown model parameters after each new measurement. Thus, the identified model and controller parameters are updated at each sampling time to reflect any changes in the dynamics of the process. In contrast to MPC studies,12,13,15 there is no need to provide meal and exercise information as known disturbances.
A patient's metabolic and physical activities may have significant effects on the dynamics of the BGC. Using measurements related to lifestyle conditions can improve the prediction of BGC and consequently the performance of the controller.6,21 Energy expenditure22 and galvanic skin response can be used as indicators of physical activity. Stress is known to have considerable effects on BGC dynamics. Stress may affect the performance of closed-loop controllers significantly.23 The relation between stress and galvanic skin response24 can be used in prediction and controller algorithms to improve the performance of the AP.
One of the major challenges in AP implementations is the prevention of hypoglycemia. A rapid-acting insulin analog cannot be used, metabolized, or eliminated by the body in the same manner as endogenous human insulin. Exogenous insulin, as used in insulin infusion pumps, affects the body over an extended time period, where approximately 30% is metabolized by the body during the first hour and 70% during the following 2 h. Thus insulin administration based exclusively on current blood glucose measurement can cause hyperinsulinemia and subsequent hypoglycemia. A prediction of plasma insulin that is also called insulin on-board (IOB) can be implemented to the controller to prevent hypoglycemia.6,7,25
In this study, multivariable adaptive GPC was used with a multiple-input–single-output model for predicting future glucose concentrations based on glucose measurements from a CGM device, physiological signals from a multisensory armband, and plasma insulin (IOB) predictions to control BGC of patients with type 1 diabetes (T1D). The controllers were tested with clinical studies that include seven cases with three different patients for 32 or 60 h without any meal or activity announcements.
Materials and Methods
Subjects
The subjects were recruited by Kovler Diabetes Center, University of Chicago Medical Center, Chicago, IL, and were scheduled for a visit at the University of Chicago General Clinical Research Center (GCRC). The subjects included healthy, physically active young adults 18–35 years old with T1D. All subjects used continuous subcutaneous insulin pump therapy.
Study experiments
A Medtronic (Northridge, CA) CGM system (MMT-7012) was used to collect the glucose concentration data to be used as the output of the identified model. The body monitoring system SenseWear® Pro3 (BodyMedia Inc., Pittsburgh, PA) was used for collection of metabolic and physical activity and emotional state information. This device is a multisensor monitoring device that provides accurate estimates of physical activity data using accelerometers and heat-related sensor and galvanic skin responses.26 The most important variables collected from the armband for prediction of glucose concentration have been determined to be energy expenditure and galvanic skin response.6,21
Upon admission of the patients to the GCRC, a history was taken, and a physical examination was performed to ensure that the subjects were medically cleared to participate in the study. Subjects were questioned about any metabolic instability as evidenced by recent hospitalizations for acute (e.g., diabetic ketoacidosis) or chronic diabetes complications or by severe hypoglycemia requiring intravenous dextrose or glucagon within the last 2 weeks. An intravenous catheter was placed in the dominant arm for blood sampling, if indicated. The subjects' own insulin type and pumps were used during the experiments.
Initially, the experiments were designed to last 32 h. The CGM sensor was inserted in the morning of the experiment, and the closed-loop experiment was initiated after the sensor readings were stabilized and calibrated. In later experiments, the CGM sensors were inserted on the evening prior to the experiment. In the final three experiments, the duration of the GCRC visit was increased to 3 days. These visits were approximately 60 h long. The first day was used for sensor calibration and open-loop operation under the same conditions that the subject would experience the following 2 days when the closed-loop experiment would be conducted. Therefore, the initial studies included 2 experimental days (with one overnight), whereas the final studies included 1 adaptation day and 2 experimental days (with one overnight stay).
The subject's CGM device and SenseWear armband were tested and calibrated before experiments started. Data collection for closed-loop control started on the experiment day (Day 1 for the initial experiments and Day 2 for the final experiments), and insulin delivery began via closed-loop control for 32 h. Subjects were provided a total of eight meals and snacks during the 2-day experiment period. Data were collected and transmitted to a computer every 10 min. Every hour and before meals, BGC was measured from capillary (fingerstick) blood using a portable glucose meter or from plasma using the YSI 2300 STAT (Yellow Springs Instrument, Yellow Springs, OH). If there was a significant difference (relative difference >25%) between the CGM reading and the YSI measurements, the YSI value was entered into the CGM device for calibration.
The insulin infusion rates were computed every 10 min by the controller and reviewed by a medical expert each time a new infusion rate was computed. Upon approval, the computed insulin infusion rates were entered manually into the subject's insulin pump.
Table 1 shows the carbohydrate content of each meal for all experiments. Meals were selected to be carbohydrate-rich to challenge the performance of the controller.
Table 1.
Amount of Carbohydrate Consumed During Each Experiment
| |
Meal information (carbohydrate in g) |
|||||||||||||||||
|---|---|---|---|---|---|---|---|---|---|---|---|---|---|---|---|---|---|---|
| |
Experiment 1 |
Experiment 2 |
Experiment 3 |
Experiment 4 |
Experiment 6 |
Experiment 7 |
||||||||||||
| Meal | D.1 | D.2 | D.3 | D.1 | D.2 | D.3 | D.1 | D.2 | D.3 | D.1 | D.2 | D.3 | D.1 | D.2 | D.3 | D.1 | D.2 | D.3 |
| B | a | 60 | a | 50 | 60 | a | 67 | 60 | a | a | 76 | 60 | 57 | 65 | 115 | 60 | 60 | 60 |
| L | a | 70 | a | 60 | 60 | a | 36 | 60 | a | a | 45 | 68 | 96 | 101 | 82 | 60 | 45 | 60 |
| D | a | a | a | 40 | a | a | 60 | a | a | 75 | 83 | a | 75 | 69 | a | 38 | 60 | 45 |
| S | a | a | a | 75 | a | a | 90 | a | a | 91 | 95 | 30 | 81 | 90 | 45 | 30 | 90 | 30 |
Experiments 1–3 were 2 days long; the first day with open-loop data collection did not occur. Experiment 4 started late on the first day. Experiment 5 is not reported because it had several hardware problems and technical issues (not related to the controller).
No food was provided.
B, breakfast; D, dinner; D.n, Day number n; L, lunch; S, snack.
Table 2 shows treadmill exercise information for each experiment during closed-loop. The subjects walked on a treadmill using a ramped protocol where the speed (miles per hour [mph]) and the incline (%) of the treadmill were gradually increased until the subjects terminated the exercise session based on self-reported symptoms (e.g., exhaustion). Overall, the subjects exercised 85±8.3% (mean±SD) of their age-predicted heart rate of (220−age)27 (range, 70–97%). The same procedure (in terms of the length and the intensity) for the exercise period was applied in all experiments. Technical problems prevented the recording of exercise information for Experiment 7 on the second day.
Table 2.
Exercise Information of Each Experiment
| |
Exercise interval |
|||||||||
|---|---|---|---|---|---|---|---|---|---|---|
| Experiment, conditions | S1 | S2 | S3 | S4 | S5 | S6 | S7 | S8 | S9 | S10 |
| Experiments 1–7 | ||||||||||
| Speed (mph) | ||||||||||
| Day 1 | 1.9 | 2.5 | 2.5 | 3 | 3 | 3.5 | 4 | 4.5 | 4.5 | 4.7 |
| Day 2 | 1.9 | 2.5 | 2.5 | 3 | 3 | 3.5 | 4 | 4.5 | 4.5 | 4.7 |
| Incline (degree) | ||||||||||
| Day 1 | 0 | 0 | 3 | 4 | 6 | 8 | 10 | 12 | 13 | 14 |
| Day 2 | 0 | 0 | 3 | 4 | 6 | 8 | 10 | 12 | 13 | 14 |
| Time (min) | ||||||||||
| Day 1 | 1 | 1 | 1 | 2 | 2 | 2 | 2 | 2 | 3 | 2 |
| Day 2 | 1 | 1 | 1 | 2 | 2 | 2 | 2 | 2 | 2 | 2.5 |
| Experiment 1 | ||||||||||
| HR | ||||||||||
| Day 1 | 105 | 105 | 108 | 121 | 121 | 147 | 154 | 161 | 180 | 186 |
| Day 2 | 105 | 107 | 111 | 111 | 121 | 138 | 150 | 162 | 174 | 176 |
| Experiment 2 | ||||||||||
| HR | ||||||||||
| Day 1 | 123 | 123 | 120 | 131 | 139 | 155 | 163 | 158 | 182 | 182 |
| Day 2 | 116 | 113 | 115 | 125 | 132 | 138 | 150 | 157 | 158 | 188 |
| Experiment 3 | ||||||||||
| HR | ||||||||||
| Day 1 | 107 | 109 | 105 | 110 | 114 | 109 | 120 | 112 | 116 | 121 |
| Day 2 | 100 | 100 | 100 | 99 | 101 | 105 | 114 | 108 | 115 | 118 |
| Experiment 4 | ||||||||||
| HR | ||||||||||
| Day 1 | 87 | 106 | 108 | 117 | 116 | 130 | 146 | 157 | 163 | 165 |
| Day 2 | 101 | 99 | 100 | 111 | 114 | 128 | 144 | 156 | 162 | 173 |
| Experiment 6 | ||||||||||
| HR | ||||||||||
| Day 1 | 92 | 95 | 96 | 107 | 119 | 120 | 146 | 156 | 159 | 165 |
| Day 2 | 91 | 100 | 97 | 106 | 108 | 123 | 141 | 158 | 160 | 170 |
| Experiment 7 | ||||||||||
| HR | ||||||||||
| Day 1 | 123 | 128 | 131 | 138 | 142 | 169 | 174 | 187 | 189 | 165 |
| Day 2 | — | — | — | — | — | — | — | — | — | — |
HR, heart rate (beats/minute); Incline (degrees), treadmill incline percentage; mph, miles per hour; S1–S10, exercise stages 1–10; Time (min), minutes of exercise at the corresponding treadmill incline.
Subjects were monitored for hypo- and hyperglycemia during the experiment period. The following protocols were used to treat hypoglycemia and hyperglycemia during the study.
Hypoglycemia
To treat low blood glucose, if the CGM reading was lower than 60 mg/dL and either the glucose meter or the YSI measurement confirmed this, the basal rate of insulin was decreased by 50%, and short-acting glucose including a minimum of 15 g of carbohydrates (based on a subject's requirements, the amount can be more) was provided. The blood glucose level was checked every 15–20 min by glucose meter or YSI, and short-acting glucose supplements were repeated until the BGC was 60–140 mg/dL. After three attempts, if the blood glucose level remained low, the pump was disconnected and reconnected at a lower rate when the blood glucose level was in the normal range.
Hyperglycemia
Urine ketones were checked for sustained BGC. If the urine ketones were negative and the controller was unable to reduce the BG appropriately, a bolus insulin injection (10% of the total daily insulin dose, or more depending upon the degree of ketosis) was administered via the pump or exogenously, depending upon the integrity of the pump site. If ketones were positive, additional exogenous insulin was given, and the infusion site was changed.
The subjects were discharged from the GCRC approximately 2 h following the termination of the closed-loop study period. During this 2-h period, the BGCs of the research subjects were documented to be in the normal range prior to release from the GCRC and upon completion of the study.
Modeling and control
BGC can be expressed as a function of its past values with an autoregressive moving average model with exogenous input (ARMAX):
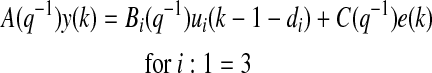 |
(1) |
 |
(2) |
 |
(3) |
 |
(4) |
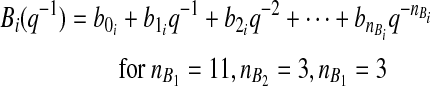
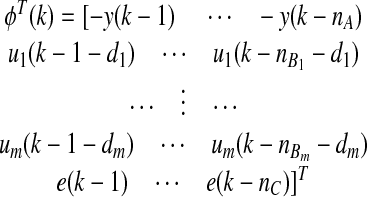
where y(k) represents the current CGM reading, u1(k−1), u2(k−1), and u3(k−1) are infused insulin, measured energy expenditure, and galvanic skin response, respectively, at the (k−1)th sampling time, d1, d2, and d3 are the respective time delay terms for the three inputs and selected as one, two, and two sampling times, respectively, for glucose concentration estimation, and e(k) is the estimated prediction error, defined as:
 |
(5) |
where φ(k)T is the vector of past observation and  is the vector of model parameters:
 |
(6) |
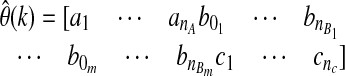 |
(7) |
Unknown model parameters can be found by minimizing the objective function:
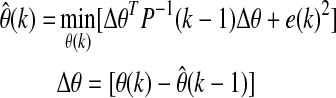 |
(8) |
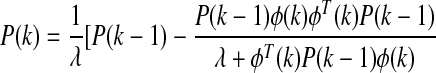 |
(9) |
where P(k) is the estimate of the error covariance matrix and λ is the forgetting factor that adjusts the weight given to recent measurements. The initial values used were P(0)=100I (where I is identity matrix) for the covariance matrix and λ=0.95 for the forgetting factor. After identification of unknown parameters in Eq. 7, the ARMAX model is used in the GPC28,29 for calculation of the appropriate insulin amount to be infused by a constrained minimization problem:
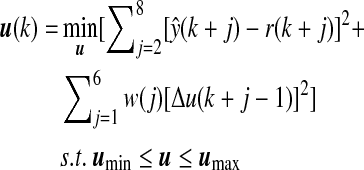 |
(10) |
where r(·) is the target BGC for the controller and set to be 120 mg/dL for the whole closed-loop period, including daytime and nighttime, w(·) is the identity weight matrix (I6×6), and umin and umax are the minimum and maximum limits, respectively, for calculated insulin. For every insulin infusion rate suggestion made by the controller, the IOB amount is predicted based on prediction models previously proposed.30 If the suggested amount is less than the predicted IOB, the minimum amount of insulin is infused. Otherwise, the IOB amount is subtracted from the suggested value, and the remaining amount is infused. Physiological signals such as energy expenditure and galvanic skin response information are used in the ARMAX model in Eq. 1 as external inputs for the model. Thus, this information is used in prediction of the glucose concentration that is directly used in the objective function. In addition, the current values of physiological signals were used in a penalty function to bound the insulin infusion rate during exercise. A more detailed description of this algorithm is reported elsewhere.6
Results
The total duration of closed-loop experiments (Experiment 5 is not included) is 154.5 h. Glucose concentration is maintained between normal pre- and postprandial ranges (70–180 mg/dL) in 62% of the observations. The entire duration of the closed-loop study is divided to three parts. The time from 12 a.m. to 7 a.m. in the morning is defined as the overnight closed-loop period. The time from the beginning of exercise to 2 h postexercise is defined as the exercise closed-loop period. The remainder of the time for each experiment is defined as glycemic closed-loop period. Table 3 shows the percentages of each experiment for three different defined durations. The controller was overridden only once during all even experiments.
Table 3.
Percentage of Time When the Glucose Concentration Was in Specific Ranges During Closed-Loop Experiment Periods
| |
Experiment [closed-loop (h)] |
||||||
|---|---|---|---|---|---|---|---|
| E1 (9.5) | E2 (27) | E3 (31) | E4 (24.5) | E6 (31.5) | E7 (31) | Total (154.5) | |
| Overnight closed-loop | |||||||
| Time (h) | — | 7 | 7 | 5 | 7 | 7 | 33 |
| <70 mg/dL (%) | — | 0 | 0 | 0 | 0 | 11.7 | 2.3 |
| 70–180 mg/dL (%) | — | 64.7 | 68.2 | 80.3 | 97.6 | 65.9 | 75.3 |
| 180–250 mg/dL (%) | — | 29.4 | 21.2 | 19.7 | 2.4 | 10.6 | 16.7 |
| >250 mg/dL (%) | — | 5.9 | 10.6 | 0 | 0 | 11.8 | 5.7 |
| Exercise closed-loop | |||||||
| Time (h) | 2 | 4 | 4 | 4 | 4 | 4 | 22 |
| <70 mg/dL (%) | 0 | 0 | 0 | 8 | 0 | 0 | 1.3 |
| 70–180 mg/dL (%) | 60 | 0 | 30 | 70 | 84 | 86 | 55 |
| 180–250 mg/dL (%) | 40 | 86 | 70 | 8 | 16 | 6 | 37.7 |
| >250 mg/dL (%) | 0 | 14 | 0 | 14 | 0 | 8 | 6 |
| Glycemic closed-loop | |||||||
| Time (hour) | 7.5 | 16 | 20 | 15.5 | 20.5 | 22 | 101.5 |
| <70 mg/dL (%) | 0 | 1.6 | 0 | 0 | 0 | 6.7 | 1.4 |
| 70–180 mg/dL (%) | 63.3 | 61.8 | 54.9 | 49.8 | 42.9 | 63.9 | 56.1 |
| 180–250 mg/dL (%) | 20 | 25.8 | 37.2 | 27 | 38.7 | 12.6 | 26.9 |
| >250 mg/dL (%) | 16.7 | 10.8 | 7.9 | 23.2 | 18.3 | 16.8 | 15.6 |
E1–E7, experiment number.
Figure 1 shows the results of Experiment 6. This is the second 3-day experiment that was conducted after all the current features of the controller were implemented. The controller was modified based on the observations from the earlier experiments to improve the performance of the closed-loop. Closed-loop control started with breakfast and continued for 31 h. The exercise session was after lunch on the first day but before lunch on the second day. No hypoglycemia occurred during the closed-loop control period. Four ounces of orange juice was provided two times when the CGM reading was decreasing toward the hypoglycemia threshold (BGC<60 mg/dL). As shown in Figure 1, the controller suggests lower insulin values for longer periods of time compared with other periods of the experiment as soon as exercise started. In case the difference between CGM and YSI or fingerstick glucose measured on the personal glucose meter was too high (relative difference >25%), the YSI BGC measurement value was entered into the CGM device for calibration. But, this difference was not high enough during this experiment to warrant recalibration.
FIG. 1.

Glucose concentration from (A) continuous glucose monitoring (CGM) and (B) infused insulin rate of Experiment 6. BF, breakfast; CHO, carbohydrate; D, dinner; L, lunch; S, snack. The green band indicates the normal range of the blood glucose concentration. The darker green section indicates the closed-loop duration. (C and D) Physical activity information from the SenseWear Armband for Experiment 6. (Color graphics available online at www.liebertonline.com/dia)
Figure 1C and D shows the information coming from the SenseWear armband for Experiment 6 (other experiments are not shown). These signals were used as external inputs in the ARMAX model. As it is seen in Figure 1, when exercise starts, energy expenditure increases, and this information triggers the controller to give lower insulin infusion rates. The same logic is used for galvanic skin response with a lag time comparing the glucose values. In fact, this delay causes the controller to suggest lower insulin rates even when the exercise is over in order to prevent postexercise hypoglycemia.
The results of the other experiments are included to illustrate the improvements of the algorithm over time and the challenges faced by equipment malfunctions. The first experiment had inconsistencies in the glucose readings displayed by the CGM device and the pump. After the causes of the difference were debugged and both units were calibrated, closed-loop control was used only on the second day starting with breakfast and continued for about 8 h (Fig. 2). The maximum amount of insulin that can be infused in a 10-min period was too conservative and caused the initial increase in glucose concentration. The single bout of exercise helped to lower the BGC, and the controller performed satisfactorily afterward in spite of the unannounced lunch disturbance.
FIG. 2.

Glucose concentration from (top) continuous glucose monitoring (CGM) and (bottom) infused insulin rate of Experiment 1. BF, breakfast; CHO, carbohydrate; L, lunch. The green band indicates the normal range of the blood glucose concentration. The darker green section indicates the closed-loop duration. (Color graphics available online at www.liebertonline.com/dia)
Two different control algorithms were tested during the second experiment (Fig. 3). The control system reported in this article was used only during the period that starts at 5 p.m. on the first day of the experiment and ends at 10 a.m. on the second day. In all experiments the insulin infusion was administered as adjustments in basal rate. In this experiment, the subject infused a bolus as he did routinely immediately prior to breakfast, which delayed the start of the closed-loop experiment. Because the whole system is designed based on infusion of basal insulin, this unplanned bolus injection caused an increase in the amount of IOB and was partially responsible for the hypoglycemia episode after the exercise, before the controller was switched to the one described in this study. This hypoglycemia was detected because of a fingerstick BGC measurement and was treated by providing snacks that triggered the hyperglycemic episode at 1 a.m.
FIG. 3.

Glucose concentration from (top) continuous glucose monitoring (CGM) and (bottom) infused insulin rate of Experiment 2. BF, breakfast; CHO, carbohydrate; D, dinner; L, lunch; S, snack. The green band indicates the normal range of the blood glucose concentration. The darker green section indicates the closed-loop duration. (Color graphics available online at www.liebertonline.com/dia)
IOB estimates were added to the control system starting with Experiment 3 (Fig. 4). High amounts of carbohydrate were given in meals to challenge the performance of the controller. Note that the controller suggests lower insulin infusion rates during exercise even while glucose concentrations are increasing. This is a strength of the controller in that it can predict the decrease in BGC because of exercise. Hypoglycemia did not occur during the entire closed-loop control experiment. However, the high amounts of carbohydrates caused some hyperglycemia episodes. Because hypoglycemia was a larger concern and the maximum basal rate was constrained to prevent large amounts of IOB, the glucose concentration reached 250 mg/dL and 300 mg/dL in two separate occasions.
FIG. 4.

Glucose concentration from (top) continuous glucose monitoring (CGM) and (bottom) infused insulin rate of Experiment 3. BF, breakfast; CHO, carbohydrate; D, dinner; L, lunch; S, snack. The green band indicates the normal range of the blood glucose concentration. The darker green section indicates the closed-loop duration. (Color graphics available online at www.liebertonline.com/dia)
The period from 8 p.m. to 2 a.m. (light green area in the middle of Fig. 5) in Experiment 4 shows one of the major problems with CGM systems. The sensor gave a “Lost Sensor” error during this interval, and the site of the sensor had to be changed. This change caused 6 h of interruption in CGM readings. The subject's glucose was measured by fingerstick or YSI during the open-loop period, and the amount of bolus injected was decided by the patient. After the signals from the sensor were restored, the loop was closed again. No hypoglycemia was seen during the entire experiment (BGC<60 mg/dL).
FIG. 5.

Glucose concentration from (top) continuous glucose monitoring (CGM) and (bottom) infused insulin rate of Experiment 4. BF, breakfast; CHO, carbohydrate; D, dinner; L, lunch; S, snack. The green band indicates the normal range of the blood glucose concentration. The darker green section indicates the closed-loop duration. (Color graphics available online at www.liebertonline.com/dia)
In the third experiment that lasted 3 days and had the current control system configuration (Experiment 7), the glucose sensor lost readings from noon to 4 p.m. on the first day of the closed-loop experiment (Fig. 6). Closed-loop control continued during this period by using glucose information from fingersticks. BGC went below the hypoglycemia threshold three times during this experiment. However, by checking blood glucose with fingerstick and YSI, only one of them was confirmed to be real hypoglycemia. For all three cases additional snacks were provided until BGC came back to the normal range. Different types and amounts of insulin may have different pharmacodynamic profiles,14 as do the effect of meals on BGC.14 To be closer to real life, different meals were provided in each experiment. These might be the reasons to see high BGC in this experiment.
FIG. 6.

Glucose concentration from (top) continuous glucose monitoring (CGM) and (bottom) infused insulin rate of Experiment 7. BF, breakfast; CHO, carbohydrate; D, dinner; L, lunch; S, snack. The green band indicates the normal range of the blood glucose concentration. The darker green section indicates the closed-loop duration. (Color graphics available online at www.liebertonline.com/dia)
Distributions of CGM data for six closed loop experiments and three open-loop days for various subjects selected randomly from their historical data sets are shown in Figure 7. The mean glucose concentration is lower in closed-loop experiments in all cases. Also, the median value of CGM is between normal pre- and postprandial ranges (70–180 mg/dL) in the box-whisker plots. Most of the data are concentrated inside the normal range.
FIG. 7.

Box-whisker plot of all closed-loop experiments with open-loop results. The red line shows the median value. Blue and purple regions are lower and upper extreme points of the box-whisker plots for closed-loop and open-loop, respectively. The pink area shows the upper and lower quartiles. Mean and SD values of each dataset are shown at the top of each box-whisker plot. Gray shows the normal range (70–180 mg/dL) of the blood glucose concentration. Black dots show the continuous glucose monitoring data. (Color graphics available online at www.liebertonline.com/dia)
Table 4 shows potentially high or low BGCs for each experiment. As it is seen in Table 4, YSI readings confirmed that real hypoglycemia happened only in Experiment 7. In other experiments, even CGM readings showed low glucose concentrations, by checking YSI or fingersticks, BGC was seen to be above hypoglycemia (BGC>60 mg/dL). For safety, additional snacks were provided when low BGC was obtained by either CGM or YSI (or fingersticks).
Table 4.
Potentially Low and High Blood Glucose Concentrations in Each Experiment
| |
Low and high blood glucose concentration (mg/dL) |
|||||||||||||||||
|---|---|---|---|---|---|---|---|---|---|---|---|---|---|---|---|---|---|---|
| |
Experiment 1 |
Experiment 2 |
Experiment 3 |
Experiment 4 |
Experiment 6 |
Experiment 7 |
||||||||||||
| Range | CGM | Y/F | T | CGM | Y/F | T | CGM | Y/F | T | CGM | Y/F | T | CGM | Y/F | T | CGM | Y/F | T |
| Low | ||||||||||||||||||
| Low 1 | 157 | 125 | a | 80 | 63 | 45 | 116 | 83 | a | 104 | 95 | a | 75 | 113 | 15 | 64 | 77 | 15 |
| Low 2 | b | b | b | 75 | 66 | 30 | 92 | 71 | 90 | 64 | 94 | 30 | 85 | 85 | 15 | 63 | 73 | 60 |
| Low 3 | b | b | b | b | b | b | b | b | b | b | b | b | b | b | b | 63 | 53c | 30 |
| High | ||||||||||||||||||
| High 1 | 235 | 253 | a | 257 | a | a | 274 | 286 | a | 260 | 310 | a | 303 | 285 | a | 321 | 285 | a |
| High 2 | b | b | b | 256 | a | a | 304 | a | a | 266 | 265 | a | 272 | a | a | 311 | 208 | a |
| High 3 | b | b | b | 289 | a | a | b | b | b | 271 | a | a | b | b | b | 348 | 327 | a |
No treatment or no YSI (or fingerstick) readings.
No low or high blood glucose concentration occurred.
Real hypoglycemia (blood glucose concentration <60 mg/dL).
CGM, continuous glucose monitoring meter readings; T, treatment for low glucose (carbohydrate amounts in g); Y/F, YSI or fingerstick measurement.
Discussion
A controller strategy that needs announcement of disturbance cannot be considered as fully automated system. There is no significant difference between such a closed-loop system and an open-loop system, in terms of making the patient's life easier. Meal and exercise announcements introduce additional challenges for the parents of young children with T1D. An adult is needed for computing and entering such information. Different kinds of foods have different effects on the dynamics of BGC. Thus, entering only the amount of the meal may affect the performance of an AP for different types of foods. Moreover, a closed-loop system has to be always ready for a disturbance. Having meals at different times in various days may impact the accuracy of control actions in cases when the times of meals are included in the control logic.
In an adaptive system identification and control strategy, all parameters in the system are updated based on the changes that happen in the process. There is no need to tune any parameter in the system. The necessity to provide additional information such as meal announcement is removed. The controller is able to automatically modify itself during exercise or sleep periods by using the information from physiological signals. As expected, smoother insulin infusions were provided at these times.
The suboptimal performance of CGM devices has been discussed in many studies.31–33 However, this problem is being addressed by device manufacturers, and the availability of CGM systems with higher accuracy and reliability are expected in the near future. To increase the reliability of the current CGM devices, multiple sensors can be used during closed-loop experiments as has been done in some studies.5,7 When the CGM device gives the “Lost-Sensor” error, the site where the sensor was implanted has to be changed. The stabilization of the sensor at the new site necessitates at least 2 h for sensor to warm-up and start to work again. Lack of information during the warm-up period can be eliminated by switching between sensors in case the one that is used gives an error. Because in all experiments only one sensor was used, we had to wait for warm-up duration when the site of the sensor was changed.
In the first experiments, the CGM device was calibrated according to the manufacturer's directions. The CGM system was calibrated with either YSI or fingerstick before meals. In recent experiments, the frequency of obtaining YSI and fingerstick BGC measurements was increased, and in addition to following the manufacturer's directions, the CGM device was recalibrated when CGM readings were significantly different (relative difference >25%) from YSI and fingerstick values, especially when the BGC was approaching the hypoglycemia limit. Although YSI readings were planned to be taken every hour, in practice it was not possible to do that. Specifically, during the exercise periods only the glucose meter was used. In case the glucose level was low, the frequency of sampling with glucose meter (not all of them are shown in the figures) was increased. Also, as shown in Figure 7, the averages of all experiments are between 154 and 178 mg/dL, even though the target BGC for the controller was 120 mg/dL for all the time. This is partially caused by the inaccuracy of the CGM device.
The control system proposed in this study is based on manipulating basal insulin infusion and is the first time used for the closed-loop control of T1D. After conducting many case studies in in silico16 experiments and evaluating the results from the first experiments, a more aggressive controller was developed. It has a better performance in regulating the glucose concentration. The weight parameter corresponding to insulin in Eq. 10 is selected to be an identity matrix (I6×6) to have aggressive suggestions of insulin.
In our experiments, because only the later experiments considered IOB and a real hypoglycemia event was seen only in Experiment 7, the effect of implementing IOB prediction into the controller could be observed. Various other studies10,25,34 have confirmed that using IOB information can prevent hypoglycemia. Also, based on the physiologic properties of glucose and insulin dynamics, IOB information has to be implemented to the AP systems.
Because the first aim of this work was to prevent hypoglycemia, the BGC reached hyperglycemia threshold in some experiments. This problem is now under consideration, and the controller is being modified to reduce hyperglycemia.
Conclusions
A multivariable adaptive closed-loop controller without any meal or exercise announcement was designed to provide an easy-to-use AP. Better blood glucose regulation is obtained by using adaptive system identification and a controller that leverages physiological information. The system can also achieve hypoglycemia prevention during exercise and sleep.
Acknowledgments
Funding from the National Institutes of Health/National Institute of Diabetes and Digestive and Kidney Diseases grant RO1 DK 085611 is gratefully acknowledged.
Author Disclosure Statement
No competing financial interests exist.
References
- 1.Cobelli C. Renard E. Kovatchev B. Artificial pancreas: past, present, future. Diabetes. 2011;60:2672–2682. doi: 10.2337/db11-0654. [DOI] [PMC free article] [PubMed] [Google Scholar]
- 2.Steil GM. Rebrin K. Darwin C. Hariri F. Saad MF. Feasibility of automating insulin delivery for the treatment of type 1 diabetes. Diabetes. 2006;55:3344–3350. doi: 10.2337/db06-0419. [DOI] [PubMed] [Google Scholar]
- 3.Bequette BW. A critical assessment of algorithms and challenges in the development of a closed-loop artificial pancreas. Diabetes Technol Ther. 2005;7:28–47. doi: 10.1089/dia.2005.7.28. [DOI] [PubMed] [Google Scholar]
- 4.Renard E. Place J. Cantwell M. Chevassus H. Palerm CC. Closed-loop insulin delivery using a subcutaneous glucose sensor and intraperitoneal insulin delivery: feasibility study testing a new model for the artificial pancreas. Diabetes Care. 2010;33:121–127. doi: 10.2337/dc09-1080. [DOI] [PMC free article] [PubMed] [Google Scholar]
- 5.Clarke WL. Anderson S. Breton M. Patek S. Kashmer L. Kovatchev B. Closed-loop artificial pancreas using subcutaneous glucose sensing and insulin delivery and a model predictive control algorithm: the Virginia experience. J Diabetes Sci Technol. 2009;3:1031–1038. doi: 10.1177/193229680900300506. [DOI] [PMC free article] [PubMed] [Google Scholar]
- 6.Turksoy K. Bayrak ES. Quinn L. Littlejohn E. Cinar A. Adaptive multivariable closed-loop control of blood glucose concentration in patients with type 1 diabetes [paper number TuA19.1]. Accepted to the 2013 American Control Conference; Washington, DC. Jun, 2013. [Google Scholar]
- 7.El-Khatib FH. Russell SJ. Nathan DM. Sutherlin RG. Damiano ER. A bihormonal closed-loop artificial pancreas for type 1 diabetes. Sci Transl Med. 2010;2:27ra27–27ra27. doi: 10.1126/scitranslmed.3000619. [DOI] [PMC free article] [PubMed] [Google Scholar]
- 8.Palerm CC. Physiologic insulin delivery with insulin feedback: a control systems perspective. Comput Methods Programs Biomed. 2011;102:130–137. doi: 10.1016/j.cmpb.2010.06.007. [DOI] [PubMed] [Google Scholar]
- 9.Steil GM. Palerm CC. Kurtz N. Voskanyan G. Roy A. Paz S. Kandeel FR. The effect of insulin feedback on closed loop glucose control. J Clin Endocrinol Metab. 2011;96:1402–1408. doi: 10.1210/jc.2010-2578. [DOI] [PMC free article] [PubMed] [Google Scholar]
- 10.Ruiz J. Sherr J. Cengiz E. Carria L. Roy A. Voskanyan G. Tamborlane WV. Weinzimer SA. Effect of insulin feedback on closed-loop glucose control: a crossover study. J Diabetes Sci Technol. 2012;6:1123. doi: 10.1177/193229681200600517. [DOI] [PMC free article] [PubMed] [Google Scholar]
- 11.Weinzimer SA. Sherr JL. Cengiz E. Kim G. Ruiz JL. Carria L. Voskanyan G. Roy A. Tamborlane WV. Effect of pramlintide on prandial glycemic excursions during closed-loop control in adolescents and young adults with type 1 diabetes. Diabetes Care. 2012;35:1994–1999. doi: 10.2337/dc12-0330. [DOI] [PMC free article] [PubMed] [Google Scholar]
- 12.Bruttomesso D. Farret A. Costa S. Marescotti MC. Vettore M. Avogaro A. Tiengo A. Dalla Man C. Place J. Facchinetti A. Guerra S. Magni L. De Nicolao G. Cobelli C. Renard E. Maran A. Closed-loop artificial pancreas using subcutaneous glucose sensing and insulin delivery and a model predictive control algorithm: preliminary studies in Padova and Montpellier. J Diabetes Sci Technol. 2009;3:1014–1021. doi: 10.1177/193229680900300504. [DOI] [PMC free article] [PubMed] [Google Scholar]
- 13.Kovatchev B. Cobelli C. Renard E. Anderson S. Breton M. Patek S. Clarke W. Bruttomesso D. Maran A. Costa S. Avogaro A. Dalla Man C. Facchinetti A. Magni L. DE Nicolao G. Place J. Farret A. Multinational study of subcutaneous model-predictive closed-loop control in type 1 diabetes mellitus: summary of the results. J Diabetes Sci Technol. 2010;4:1374–1381. doi: 10.1177/193229681000400611. [DOI] [PMC free article] [PubMed] [Google Scholar]
- 14.Bequette BW. Challenges and recent progress in the development of a closed-loop artificial pancreas. Annu Rev Control. 2012;36:255–266. doi: 10.1016/j.arcontrol.2012.09.007. [DOI] [PMC free article] [PubMed] [Google Scholar]
- 15.Breton M. Farret A. Bruttomesso D. Anderson S. Magni L. Patek S. Dalla Man C. Place J. Demartini S. Del Favero S. Toffanin C. Hughes-Karvetski C. Dassau E. Zisser H. Doyle FJ., III De Nicolao G. Avogaro A. Cobelli C. Renard E. Kovatchev B. International Artificial Pancreas Study Group: Fully integrated artificial pancreas in type 1 diabetes modular closed-loop glucose control maintains near normoglycemia. Diabetes. 2012;61:2230–2237. doi: 10.2337/db11-1445. [DOI] [PMC free article] [PubMed] [Google Scholar]
- 16.Kovatchev BP. Breton M. Man CD. Cobelli C. In silico preclinical trials: a proof of concept in closed-loop control of type 1 diabetes. J Diabetes Sci Technol. 2009;3:44–55. doi: 10.1177/193229680900300106. [DOI] [PMC free article] [PubMed] [Google Scholar]
- 17.Shinskey FG. Process control: as taught vs as practiced. Ind Eng Chem Res. 2002;41:3745–3750. [Google Scholar]
- 18.Lee H. Bequette BW. A closed-loop artificial pancreas based on model predictive control: human-friendly identification and automatic meal disturbance rejection. Biomed Signal Process Control. 2009;4:347–354. [Google Scholar]
- 19.Eren-Oruklu M. Cinar A. Quinn L. Smith D. Adaptive control strategy for regulation of blood glucose levels in patients with type 1 diabetes. J Process Control. 2009;19:1333–1346. [Google Scholar]
- 20.Russell SJ. El-Khatib FH. Nathan DM. Magyar KL. Jiang J. Damiano ER. Blood glucose control in type 1 diabetes with a bihormonal bionic endocrine pancreas. Diabetes Care. 2012;35:2148–2155. doi: 10.2337/dc12-0071. [DOI] [PMC free article] [PubMed] [Google Scholar]
- 21.Eren-Oruklu M. Cinar A. Rollins DK. Quinn L. Adaptive system identification for estimating future glucose concentrations and hypoglycemia alarms. Automatica. 2012;48:1892–1897. doi: 10.1016/j.automatica.2012.05.076. [DOI] [PMC free article] [PubMed] [Google Scholar]
- 22.Westerterp KR. Plasqui G. Physical activity and human energy expenditure. Curr Opin Clin Nutr Metab Care. 2004;7:607–613. doi: 10.1097/00075197-200411000-00004. [DOI] [PubMed] [Google Scholar]
- 23.Ward WK. Castle JR. El Youssef J. Safe glycemic management during closed-loop treatment of type 1 diabetes: the role of glucagon, use of multiple sensors, and compensation for stress hyperglycemia. J Diabetes Sci Technol. 2011;5:1373–1380. doi: 10.1177/193229681100500608. [DOI] [PMC free article] [PubMed] [Google Scholar]
- 24.Perala CH. Sterling BS. Aberdeen Proving Ground, MD: Human Research and Engineering Directorate, Army Research Lab; 2007. Galvanic Skin Response as a Measure of Soldier Stress. Publiccation number ARL-TR-4114. [Google Scholar]
- 25.Ellingsen C. Dassau E. Zisser H. Grosman B. Percival MW. Jovanovic L. Doyle FJ., III Safety constraints in an artificial pancreatic beta cell: an implementation of model predictive control with insulin on board. J Diabetes Sci Technol. 2009;3:536–544. doi: 10.1177/193229680900300319. [DOI] [PMC free article] [PubMed] [Google Scholar]
- 26.Johannsen DL. Calabro MA. Stewart J. Franke W. Rood JC. Welk GJ. Accuracy of armband monitors for measuring daily energy expenditure in healthy adults. Med Sci Sports Exerc. 2010;42:2134–2134. doi: 10.1249/MSS.0b013e3181e0b3ff. [DOI] [PubMed] [Google Scholar]
- 27.8th 3rd. Philadelphia: Lippincott Williams & Wilkins; 2010. American College of Sports Medicine: ACSM's Guidelines for Exercise Testing and Prescription. + ACSM's Certification Review. [Google Scholar]
- 28.Clarke DW. Mohtadi C. Tuffs PS. Generalized predictive control—Part I. The basic algorithm. Automatica. 1987;23:137–148. [Google Scholar]
- 29.Clarke DW. Mohtadi C. Tuffs PS. Generalized predictive control—Part II. Extensions and interpretations. Automatica. 1987;23:149–160. [Google Scholar]
- 30.Walsh J. Roberts R. 3rd. San Diego, CA: Torrey Pines Press; 2006. Pumping Insulin: Everything You Need for Success with an Insulin Pump. [Google Scholar]
- 31.Elleri D. Dunger D. Hovorka R. Closed-loop insulin delivery for treatment of type 1 diabetes. BMC Med. 2011;9:120. doi: 10.1186/1741-7015-9-120. [DOI] [PMC free article] [PubMed] [Google Scholar]
- 32.Thabit H. Hovorka R. Closed-loop insulin delivery in type 1 diabetes. Endocrinol Metab Clin North Am. 2012;41:105–117. doi: 10.1016/j.ecl.2011.12.003. [DOI] [PMC free article] [PubMed] [Google Scholar]
- 33.Hovorka R. Allen JM. Elleri D. Chassin LJ. Harris J. Xing D. Kollman C. Hovorka T. Larsen AMF. Nodale M. De Palma A. Wilinska ME. Acerini CL. Dunger DB. Manual closed-loop insulin delivery in children and adolescents with type 1 diabetes: a phase 2 randomised crossover trial. Lancet. 2010;375:743–751. doi: 10.1016/S0140-6736(09)61998-X. [DOI] [PubMed] [Google Scholar]
- 34.Dassau E. Zisser H. Harvey RA. Percival MW. Grosman B. Bevier W. Atlas E. Miller S. Nimri R. Jovanovic L. Doyle FJ., III Clinical evaluation of a personalized artificial pancreas. Diabetes Care. 2012. Nov 27, [Epub ahead of print] [DOI] [PMC free article] [PubMed]