


Abstract
CpG islands are GC-rich regions often located in the 5′ end of genes and normally protected from cytosine methylation in mammals. The important role of CpG islands in gene transcription strongly suggests evolutionary conservation in the mammalian genome. However, as CpG dinucleotides are over-represented in CpG islands, comparative CpG island analysis using conventional sequence analysis techniques remains a major challenge in the epigenetics field. In this study, we conducted a comparative analysis of all CpG island sequences in 10 mammalian genomes. As sequence similarity methods and character composition techniques such as information theory are particularly difficult to conduct, we used exact patterns in CpG island sequences and single character discrepancies to identify differences in CpG island sequences. First, by calculating genome distance based on rank correlation tests, we show that k-mer and k-flank patterns around CpG sites can be used to correctly reconstruct the phylogeny of 10 mammalian genomes. Further, we used various machine learning algorithms to demonstrate that CpG islands sequences can be characterized using k-mers. In addition, by testing a human model on the nine different mammalian genomes, we provide the first evidence that k-mer signatures are consistent with evolutionary history.
INTRODUCTION
The dinucleotide sequence CpG (cytosine followed by a guanine, coupled by a phosphodiester bond) is a target for DNA methylation. The cytosine residue in CpG sites is frequently modified to form 5-methylcytosine, and 70–80% of CpG dinucleotides in the mammalian genomes are methylated (1). DNA methylation is essential for proper mammalian development and plays crucial roles in imprinting, maintaining genomic stability and many other biological processes (2). In addition, aberrant DNA methylation changes have been detected in several diseases (3–5). In the human genome, spontaneous deamination of methylated cytosine in the context of CpG dinucleotides results in the creation of thymine ( ) and under-representation of CG dinucleotides over evolutionary time (known as CG suppression) (6, 7). In fact, the frequency of CpG sites in vertebrate genomes is only about a fifth of the expected frequency, given the GC content of the genome. Although CpG sites are under-represented in genomes overall, clusters of CpGs known as CpG islands are observed, and these are normally protected from methylation (8). The vast majority of genes are associated with a CpG islands, and ∼40% of gene promoters contain a CpG island (9), including the 5′ ends of housekeeping genes and many tissue-specific genes in vertebrates (10). Recently, human promoters were classified as high CpG content (about 70%) versus 30% low CpG promoters (CpG content characteristic of the overall genome) (11). Comparative studies (12) on CpG island promoter organization, in terms of protein–DNA interactions and patterns of expression, recently reported a strong link between CpG islands and evolution and that accumulation of CpG islands at transcription start sites (TSS) is a vertebrate-specific genomic feature. Those authors (12) suggested that CpG islands at TSS are a consequence of warm-blooded vertebrate evolution, presumably for efficient regulation of transcription in large genomes. On the other hand, CpG islands could have played a direct role in evolution of warm-blooded vertebrates, perhaps contributing to the gain of placenta, a hallmark of eutherian mammals (13). In support of the latter, a relationship between evolution of CpG island promoter function and gene expression in mammalian heart was recently reported (14).
To date, objective definitions of CpG islands are limited. Gardiner-Garden and Frommer (15) described CpG islands as a region with at least 200 bp, a GC content >50% and an observed/expected CpG ratio >60%. Takai and Jones (16) revised the definition of CpG islands as DNA regions with at least 500 bp, a GC content >55% and an observed/expected CpG ratio >65% were more likely to be true CpG islands associated with the 5′ end regions of genes. They also enhanced the ability to detect CpG islands by excluding other GC-rich genomic sequences such as Alu repeats (17, 18). Despite significant efforts to define CpG islands, it remains a challenge to perform computational CpG island analysis using conventional sequence analysis methods.
To overcome this barrier, we propose novel oligomer-counting approaches for the comparative analysis of all CpG island sequences in 10 mammalian genomes. These two new approaches use exact sequence patterns in CpG island sequences called k-mer and k-flank. After counting the k-mers and k-flanks, pattern counting was used to reconstruct 10 mammalian phylogenies and for machine learning analysis. We demonstrate that k-mers are characteristic of CpG island sequences and also show that k-mer data are consistent with evolutionary history of 10 mammalian genomes. To our knowledge, this extensive study represents the first comparative analysis of CpG island sequences in mammalian genomes.
MATERIALS AND METHODS
Raw data
From the UCSC Genome Browser, CpG island sequences in 10 mammalian were downloaded and used for the analysis. Table 1 shows 10 mammalian reference genomes and their versions from which the CpG island sequences are taken.
Table 1.
Ten mammalian CpG islands sequence
| Species | Data version |
|---|---|
| Chimp | CGSC 2.1.3/panTro3 |
| Cow | Bos taurus UMD 3.1/bosTAu6 |
| Dog | Broad/canFam2 |
| Human | CRCh37/hg19 |
| Marmoset | WUGSC 3.2/calJac3 |
| Mouse | NCBI37/mm9 |
| Opossum | Broad/monDom5 |
| Pig | SGSC Sscrofa9.2/susScr2 |
| Rat | Baylor 3.4/rn4 |
| Rhesus | MGSC Merged 1.0/rheMac2 |
BLAST and information theoretic approaches are not effective for CpG island sequence analysis
Despite previous studies on CpG island sequences, it is unclear why CpG island regions are found more frequently in mammalian genomes compared with other genomes. In addition, while studies exist on CpG island sequences and evolution (19, 20) in primates, comparative mammalian studies are lacking, perhaps owing to the difficulty of performing computational analysis of CpG island sequences containing over-represented CpG dinucleotides. In this regard, conventional sequence analysis techniques are not effective for the comparative analysis of highly similar CpG island sequences (shown in the next section).
We used BLAST for CpG island sequence analysis. Owing to over-represented CpG dinucleotides, CpG island sequences are very similar to each other, and sequence similarity-based methods like BLAST are not effective for performing comparative CpG island sequences analysis. We took another traditional approach and computed relative entropy between 10 mammalian species. As shown in Table 2, computing the relative entropy was ineffective in showing significant differences among CpG island sequences. Shown below is the computational procedure we performed for the relative entropy between species.
Let P and Q be probability distributions of CpG island for chimp and human
Get probabilities of A, G, T, C for chimp and human in each CpG island sequence. Let them be
 and
and 
Relative entropy is calculated by

Repeat (i) to (iii) for all species pairwise
Table 2.
Relative entropy between species
| Species | Chimp | Cow | Dog | Human | Marmoset | Mouse | Opossum | Pig | Rat | Rhesus |
|---|---|---|---|---|---|---|---|---|---|---|
| Chimp | 0.00E + 00 | 6.52E-05 | 1.24E-05 | 2.61E-05 | 3.38E-04 | 2.61E-05 | 8.42E-04 | 7.18E-04 | 4.15E-04 | 2.20E-06 |
| Cow | 6.51E-05 | 0.00E + 00 | 1.34E-04 | 1.71E-04 | 1.07E-04 | 1.31E-05 | 4.39E-04 | 3.54E-04 | 1.56E-04 | 4.59E-05 |
| Dog | 1.24E-05 | 1.34E-04 | 0.00E + 00 | 4.47E-06 | 4.80E-04 | 7.28E-05 | 1.06E-03 | 9.19E-04 | 5.69E-04 | 2.41E-05 |
| Human | 2.62E-05 | 1.72E-04 | 4.48E-06 | 0.00E + 00 | 5.48E-04 | 1.00E-04 | 1.15E-03 | 1.00E-03 | 6.43E-04 | 4.12E-05 |
| Marmoset | 3.37E-04 | 1.07E-04 | 4.77E-04 | 5.44E-04 | 0.00E + 00 | 1.80E-04 | 1.12E-04 | 7.23E-05 | 6.83E-06 | 2.88E-04 |
| Mouse | 2.61E-05 | 1.31E-05 | 7.26E-05 | 1.00E-04 | 1.81E-04 | 0.00E + 00 | 5.79E-04 | 4.75E-04 | 2.35E-04 | 1.33E-05 |
| Opossum | 8.35E-04 | 4.36E-04 | 1.04E-03 | 1.14E-03 | 1.12E-04 | 5.75E-04 | 0.00E + 00 | 8.32E-06 | 8.11E-05 | 7.58E-04 |
| Pig | 7.12E-04 | 3.52E-04 | 9.11E-04 | 9.97E-04 | 7.21E-05 | 4.72E-04 | 8.34E-06 | 0.00E + 00 | 4.62E-05 | 6.40E-04 |
| Rat | 4.13E-04 | 1.56E-04 | 5.64E-04 | 6.38E-04 | 6.83E-06 | 2.34E-04 | 8.12E-05 | 4.63E-05 | 0.00E + 00 | 3.57E-04 |
| Rhesus | 2.20E-06 | 4.60E-05 | 2.41E-05 | 4.11E-05 | 2.90E-04 | 1.33E-05 | 7.64E-04 | 6.45E-04 | 3.59E-04 | 0.00E + 00 |
No significant difference enough to represent CpG island sequence features.
The k-mer and k-flank approaches
As shown in the previous section, over-represented CpG dinucleotides make it difficult to perform analysis of CpG islands. To overcome this hurdle, we used two new oligomer-counting approaches, exact sequence patterns called k-mer and k-flank, for the comparative analysis of all CpG island sequences in 10 mammalian genomes. The first model, k-mer, gives a general descriptor of the oligomer landscape in the entire CpG island sequence. Given a sequence S, k-mers are sub-sequences of S of length k, also known as oligomers for small k. For each CpG island sequence, sliding windows of length k are moved across the CpG island sequence from the 5′ end to 3′ end, and each k-mer occurrence is counted. Determining the number of occurrences of specific k-mers in a sequence is called k-mer counting or oligomer counting, and can provide descriptive information about the DNA sequence (6, 21). To better characterize and describe CpG island sequences, we used k-mer counting techniques and frequency measurements to perform a comparative analysis of the CpG islands. The second oligomer-counting approach, called k-flanks, records the DNA sequence of k length directly upstream and downstream of each CpG site in a CpG island sequence. This oligomer model is stricter and specifically describes the DNA bases directly adjacent to CpG sites. Figure 1 illustrates the definition of k-mer and k-flank. In this study, we counted 3–10 k-mers and k-flanks. Once k-mers and k-flanks were counted, we used pattern counting for the reconstruction of 10 mammalian phylogenies and also for machine learning analysis to show that (i) k-mers are characteristic of CpG island sequences and (ii) k-mer data are consistent with evolutionary history of 10 mammalian genomes. As far as we know, this study is the first extensive comparative analysis of CpG island sequences.
Figure 1.
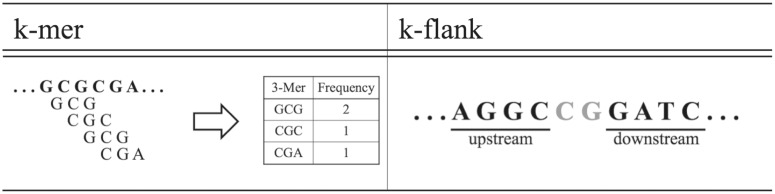
Definition of K-mer and K-flank.
Collecting k-mer/k-flank frequencies and common k-mers/k-flanks
Count k-mer and k-flank frequencies in CpG island for each species
Collect k-mers and k-flanks common in all 10 mammalian genomes and their frequencies
Once the common k-mers/k-flanks are collected, they are sorted according to their frequencies. Based on the ranks of common k-mers/k-flanks, their ranks are marked. Since these k-mers/k-flanks are in common across all 10 mammalian genomes, the order of k-mers/k-flanks in each species becomes a permutation of ranks of common k-mers/k-flanks. This k-mer/k-flank ranking method based on the common k-mer/k-flank ranks comes from an assumption that all these mammalian species are closely related from the evolutionary perspective. Figure 2 illustrates the experimental protocol.
Figure 2.

Get common k-mer(flank) exist in all the species. Each alphabet stands for the k-mer(flank) sequences. Based on the k-mer(flank) rank order in common, k-mer(flank) order in each species are set. Rank difference between common and other species are computed.
Correlation between species
k-mer/k-flank selection for correlation
Based on the common k-mers/k-flanks, k-mers/k-flanks in the each species were selected for correlation analysis between species. That is, for the correlation coefficient computation, each species has the same set of k-mers/k-flanks but a different rank order 2.
Kendall tau rank correlation coefficient with merge sort
Kendalls tau is a method to measure rank correlation, first discussed by G.T. Fechner in 1900 and rediscovered by M.G. Kendall in 1938 (23, 24). It is a statistic used to measure the association between two measured quantities, effectively measuring rank correlation.
RESULTS AND DISCUSSION
Reconstruction of the phylogenetic tree based on the distance matrix
Distance matrix can be directly obtained from the correlation coefficient value computed by Kendalls tau method. If the correlation coefficient value is  , the distance matrix will be (
 ).
).
Neighbour-joining algorithm
We applied a neighbour-joining algorithm (22) to reconstruct phylogenetic trees using matrix of pairwise evolutionary between distance. Our objective here was to define distance between genomes by using the rank-sum tests of conserved k-mers.
Visualize phylogenetic tree
Using the Newick format data, we used the on-line phylogeny drawing tool, called PHY-FI (25). A phylogenetic tree using top ranked 64 3-mers is shown in Figure 3, which is consistent with the evolutionary history of the 10 mammalian genomes. Additional results using different k-mers and k-flanks are available at http://biohealth.snu.ac.kr/wiki/index.php/PhylogeneticTree
Figure 3.

Phylogenetic tree using top ranked 64 3-mers.
Machine learning analysis of CpG island sequence using k-mer as features
In the previous section, the k-mer/k-flank rank method was used to reconstruct a phylogenetic tree based on their sequence pattern. To investigate further relationships among CpG island sequence patterns and evolutionary relationship between species, we performed machine learning analysis on the CpG island sequences using the same k-mer frequency approach.
Machine learning algorithms
We performed the machine learning analysis using representative algorithms including Random forest (RF), naïve bayes (NB), support vector machine (SVM) and radial basis function network (RBF) implemented in Weka package (26). We did not use the artificial neural network (ANN) algorithm, as it is exceptionally time consuming. In the machine learning analysis, statistically significant k-mers were used as features, and CpG island sequences from each species were used as class.
Positive and negative data set
Based on the k-th order, the frequency of each k-mers in the CpG islands was counted and used as the positive data set to represent CpG island sequence. We used Markov model (MM) in seq++ package (27) to generate the negative data set. From CpG island sequences, the Markov model parameters were estimated and the negative sequences were generated using the Markov model. We generated random sequences of the same length as original CpG island sequences to make the positive and negative data of the same size. The ratio between positive and negative data set was one to one. Using the positive and negative data sets, we performed a 10-fold cross validation to evaluate machine learning models to characterize CpG island sequences.
Feature selections
To select statistically significant k-mers, t-tests were used and a P-value of 0.05 was used as a cut-off value. For the machine learning models, only statistically significant k-mers were used.
MM order and k-mer selection
Selecting the appropriate k-mer length and the order of MM for generating random sequence are critically important. Thus, we investigated the number of statistically significant k-mers between original CpG island sequences and random sequences from varying degrees of MM. Table 3 shows the relationship between the orders of MM and k-mer lengths.
Table 3.
Relation between MM order and k-mer
| MM-order | 2-mer | 3-mer | 4-mer | 5-mer | 6-mer | 7-mer |
|---|---|---|---|---|---|---|
| 1st | 0 | 50 | 202 | 830 | 2992 | 9570 |
| 2nd | 0 | 0 | 193 | 699 | 2444 | 7950 |
| 3rd | 0 | 0 | 0 | 456 | 1826 | 6120 |
| 4th | 0 | 0 | 0 | 7 | 947 | 4707 |
| 5th | 0 | 0 | 0 | 0 | 38 | 3520 |
| 6th | 0 | 0 | 0 | 0 | 0 | 230 |
Number of significant k-mer filtered by t-test with P < 0.05.
Results of machine learning on k-mer as a human CpG island sequence feature
To investigate predictive power of the machine learning models, we tested all possible combinations of the order of MM and k-mer length (Figures 4–11). Overall, SVM and RF performed better than NB and RBF, achieving prediction accuracies between 0.8 and 0.9. This result shows that CpG island sequences in humans contain distinctive k-mer patterns and are not random sequences.
Figure 4.

Machine learning performance with 4-mer as features using 2nd order MM random set.
Figure 5.

Machine learning performance with 5-mer as features using 2nd order MM random set.
Figure 6.

Machine learning performance with 6-mer as features using 2nd order MM random set.
Figure 7.

Machine learning performance with 5-mer as features using 3rd order MM random set.
Figure 8.

Machine learning performance with 6-mer as features using 3rd order MM random set.
Figure 9.

Machine learning performance with 6-mer as features using 4th order MM random set.
Figure 10.

Accuracy change over different k-mer length with 2nd order MM as negative set.
Figure 11.

Accuracy change over different k-mer length with different MM order using SVM.
Analysis of CpG island sequences in nine mammalian genomes
We next extended the k-mer pattern analysis method used for the human to the other mammalian species (Table 2). We fixed the machine learning algorithm as SVM, because it showed the best performance in our previous analysis. We also fixed parameters as 4-mer and the 2nd order for the MM negative data set, as 4-mer is the smallest k-mer to get meaningful result and at least 2nd order for the MM is required to simulate dinucleotide characteristics of CpG sites in CpG islands sequence. Figure 12 shows the trained machines performance for other species. The overall performance was determined to be between 75–80%, demonstrating that the CpG island sequences contain certain unique pattern in each of the species.
Figure 12.

Machine learning k-mer analysis on each species.
Analysis of CpG island sequences using common k-mer patterns between species
Previous machine learning analysis showed that CpG island sequences of all species contained distinct and non-random k-mer pattern. To further investigate the k-mers, we analyzed the similarity k-mer patterns between species. The number of k-mer patterns in each species is conserved (Table 4); in addition, k-mer patterns were shared between each species, ranging from 67 to 100% (Table 5).
Table 4.
Number of existing k-mer pattern in each species
| Chimp | Cow | Dog | Human | Marmoset | Mouse | Opossum | Pig | Rat | Rhesus | |
|---|---|---|---|---|---|---|---|---|---|---|
| Total (255) | 215 | 204 | 179 | 222 | 211 | 215 | 200 | 182 | 216 | 204 |
Among total possible combination of 4-mer pattern (255), each species contains different number of k-mer pattern (P < 0.05).
Table 5.
Number of common k-mers between species
| Species | Chimp | Cow | Dog | Human | Marmoset | Mouse | Opossum | Pig | Rat | Rhesus |
|---|---|---|---|---|---|---|---|---|---|---|
| Chimp | 215/100% | 197/88.7% | 169/75.1% | 213/95.0% | 196/85.2% | 200/86.9% | 182/78.1% | 173/77.2% | 196/83.4% | 202/93.0% |
| Cow | 197/88.7% | 204/100% | 166/76.4% | 200/88.4% | 184/79.6% | 190/82.9% | 181/81.1% | 174/82.0% | 188/81.0% | 192/88.8% |
| Dog | 169/75.1% | 166/76.4% | 179/100% | 171/74.3% | 159/68.8% | 165/72.0% | 153/67.6% | 164/83.2% | 162/69.5% | 162/73.3% |
| Human | 213/95.0% | 200/88.4% | 171/74.3% | 222/100% | 197/83.4% | 204/87.5% | 186/78.8% | 175/76.4% | 201/84.8% | 203/91.0% |
| Marmoset | 196/85.2% | 184/79.6% | 159/68.8% | 197/83.4% | 211/100% | 190/80.5% | 178/76.3% | 165/72.3% | 191/80.9% | 190/84.4% |
| Mouse | 200/86.9% | 190/82.9% | 165/72.0% | 204/87.5% | 190/80.5% | 215/100% | 175/72.9% | 168/73.3% | 201/87.3% | 191/83.7% |
| Opossum | 182/78.1% | 181/81.1% | 153/67.6% | 186/78.8% | 178/76.3% | 175/72.9% | 200/100% | 158/70.5% | 178/74.7% | 176/77.1% |
| Pig | 173/77.2% | 174/82.0% | 164/83.2% | 175/76.4% | 165/72.3% | 168/73.3% | 158/70.5% | 182/100% | 168/73.0% | 170/78.7% |
| Rat | 196/83.4% | 188/81.0% | 162/69.5% | 201/84.8% | 191/80.9% | 201/87.3% | 178/74.7% | 168/73.0% | 216/100% | 189/81.8% |
| Rhesus | 202/93.0% | 192/88.8% | 162/73.3% | 203/91.0% | 190/84.4% | 191/83.7% | 176/77.1% | 170/78.7% | 189/81.8% | 204/100% |
(Number of common k-mer)/(Percentage of common k-mer). Evolutionarily closer genome pairs retain higher percentage of common k-mer pattern.
Comparison between species I: applying a human model to other species
To compare CpG island sequences among species, we used a human model of 4-mer and the 2nd order MM background model to classify CpG island sequences in nine mammalian genomes. In this case, the human CpG island sequences were used as the training data, and CpG island sequences in other species served as the test data. The experimental procedure is summarized in Figure 13. We predicted the predictive power of the human model to decrease as the evolutionary distance increased between species. As shown in Figure 14, the results are consistent with evolutionary history.
Figure 13.

Applying human CpG island model to different species.
Figure 14.

Result of applying a human model to different species.
Comparison between species II: models between human and other species
To further compare CpG island sequences among species, we used the human CpG island sequences as the positive data set and other species sequences as the negative data set and performed 10-fold cross validation experiments. Figure 15 illustrates the experimental scheme. The result in Figure 16 is consistent with evolutionary history: prediction accuracy was low for close species (e.g., human versus chimp), and high prediction accuracy was observed for distant species, e.g., human versus opossum.
Figure 15.

Machine learning analysis human as positive data set and others as negative data set.
Figure 16.

Result of machine learning analysis human as positive data set and other species as negative data set. The result is consistent with evolutionary history since when two species are close, e.g., human versus chimp, the prediction accuracy is low while two species are distant, e.g., human versus opossum, the prediction accuracy is high.
CONCLUSION
CpG island sequences play critical roles in development and disease biology. Despite the number of important analytical studies on CpG island sequence characteristics, no comparative analysis exists on CpG island sequences among different species. One possible reason is conventional sequence analysis techniques are currently ineffective for analyzing highly biased character composition of CpG island sequences. In this article, we proposed new approaches using exact patterns of CpG island sequence called k-mer and k-flank. By using genome distance based on rank correlation tests, we show that k-mer and k-flank patterns nearby CpG sites can correctly reconstruct the phylogeny of 10 mammalian genomes. We further report that k-mers, by using various machine learning algorithms, can be used to characterize CpG islands sequences. Conserved k-mers mean conservation of short sequence in CpG island sequences. Thus, our findings of conserved k-mers in CpG island sequences extend our current knowledge of CpG islands as CpG over-represented sequences to partially conserved sequences. In addition, human model testing on nine additional mammalian genomes confirms that k-mers indeed are signatures consistent with their evolutionary history. We conclude for the first time that CpG islands sequences of 10 mammalian genomes contain evolutionary evidence for non-random pattern characteristics.
FUNDING
Next-Generation Information Computing Development Program through the National Research Foundation of Korea (NRF) funded by the Ministry of Education, Science and Technology [2012M3C4A7033341]; Next-Generation BioGreen 21 Program [PJ009037022012]; Rural Development Administration, Republic of Korea; World Class University Program through the National Research Foundation of Korea funded by the Ministry of Education, Science, and Technology, under Grant R31-10008; National Institutes of Health [CA113001]. Funding for open access charge: Seoul National University.
Conflict of interest statement. None declared.
ACKNOWLEDGEMENTS
Thanks to Craig Jackson at Indiana University for the earlier work of the rank based analysis of CpG island sequences.
REFERENCES
- 1.Jabbari K, Bernardi G. Cytosine methylation and CpG, TpG (CpA) and TpA frequencies. Gene. 2004;333:143–149. doi: 10.1016/j.gene.2004.02.043. [DOI] [PubMed] [Google Scholar]
- 2.Jones PA. Functions of DNA methylation: islands, start sites, gene bodies and beyond. Nat. Rev. Genet. 2012;13:484–492. doi: 10.1038/nrg3230. [DOI] [PubMed] [Google Scholar]
- 3.Bell CG, Wilson GA, Butcher LM, Roos C, Walter L, Beck S. Human-specific CpG “beacons” identify loci associated with human-specific traits and disease. Epigenetics. 2012;7:1188–1199. doi: 10.4161/epi.22127. [DOI] [PMC free article] [PubMed] [Google Scholar]
- 4.Portela A, Esteller M. Epigenetic modifications and human disease [Review] Nat. Biotechnol. 2010;28:1057–1068. doi: 10.1038/nbt.1685. [DOI] [PubMed] [Google Scholar]
- 5.Feinberg AP. Epigenomics reveals a functional genome anatomy and a new approach to common disease. Nat. Biotechnol. 2010;28:1049–1052. doi: 10.1038/nbt1010-1049. [DOI] [PMC free article] [PubMed] [Google Scholar]
- 6.Burge C, Campbell AM, Karlin S. Over- and under-representation of short oligonucleotides in DNA sequences. Proc. Natl Acad. Sci. USA. 1992;89:1358–1362. doi: 10.1073/pnas.89.4.1358. [DOI] [PMC free article] [PubMed] [Google Scholar]
- 7.Scarano E, Iaccarino M, Grippo P, Parisi E. The heterogeneity of thymine methyl group origin in DNA pyrimidine isostichs of developing sea urchin embryos. Proc. Natl Acad. Sci. USA. 1967;57:1394–1400. doi: 10.1073/pnas.57.5.1394. [DOI] [PMC free article] [PubMed] [Google Scholar]
- 8.Bock C, Paulsen M, Tierling S, Mikeska T, Lengauer T, Walter J. CpG island methylation in human lymphocytes is highly correlated with DNA sequence, repeats, and predicted DNA structure. PLoS Genet. 2006;2:e26. doi: 10.1371/journal.pgen.0020026. [DOI] [PMC free article] [PubMed] [Google Scholar]
- 9.Fatemi M, Pao MM, Jeong S, Gal-Yam EN, Egger G, Weisenberger DJ, Jones PA. Footprinting of mammalian promoters: use of a CpG DNA methyltransferase revealing nucleosome positions at a single molecule level. Nucleic Acids Res. 2005;33:e176. doi: 10.1093/nar/gni180. [DOI] [PMC free article] [PubMed] [Google Scholar]
- 10.Larsen F, et al. CpG islands as gene markers in the human genome. Genomics. 1992;13:1095–1107. doi: 10.1016/0888-7543(92)90024-m. [DOI] [PubMed] [Google Scholar]
- 11.Saxonov S, Berg P, Brutlag DL. A genome-wide analysis of CpG dinucleotides in the human genome distinguishes two distinct classes of promoters. Proc. Natl Acad. Sci. USA. 2006;103:1412–1417. doi: 10.1073/pnas.0510310103. [DOI] [PMC free article] [PubMed] [Google Scholar]
- 12.Antequera F. Structure, function and evolution of CpG island promoters. Cell Mol. Life Sci. 2003;60:1647–1658. doi: 10.1007/s00018-003-3088-6. [DOI] [PMC free article] [PubMed] [Google Scholar]
- 13.Sharif J, Endo TA, Toyoda T, Koseki H. Divergence of CpG island promoters: a consequence or cause of evolution? Dev. Growth Differ. 2010;52:545–554. doi: 10.1111/j.1440-169X.2010.01193.x. [DOI] [PubMed] [Google Scholar]
- 14.Yan Q, Masson R, Ren Y, Rosati B, McKinnon D. Evolution of CpG island promoter function underlies changes in KChIP2 potassium channel subunit gene expression in mammalian heart. Proc. Natl Acad. Sci. USA. 2012;109:1601–1606. doi: 10.1073/pnas.1114516109. [DOI] [PMC free article] [PubMed] [Google Scholar]
- 15.Gardiner-Garden M, Frommer M. CpG islands in vertebrate genomes. J. Mol. Biol. 1987;196:261–282. doi: 10.1016/0022-2836(87)90689-9. [DOI] [PubMed] [Google Scholar]
- 16.Takai D, Jones PA. Comprehensive analysis of CpG islands in human chromosomes 21 and 22. Proc. Natl Acad. Sci. USA. 2002;99:3740–3745. doi: 10.1073/pnas.052410099. [DOI] [PMC free article] [PubMed] [Google Scholar]
- 17.Bock C. Analysing and interpreting DNA methylation data. Nat. Rev. Genet. 2012;13:705–719. doi: 10.1038/nrg3273. [DOI] [PubMed] [Google Scholar]
- 18.Wu H, Caffo B, Jaffee HA, Irizarry RA, Feinberg AP. Redefining CpG islands using hidden Markov models. Biostatistics. 2010;11:499–514. doi: 10.1093/biostatistics/kxq005. [DOI] [PMC free article] [PubMed] [Google Scholar]
- 19.Feuerbach L, Halachev K, Assenov Y, Mller F, Bock C, Lengauer T. Analyzing epigenome data in context of genome evolution and human diseases. Methods Mol. Biol. 2012;856:431–467. doi: 10.1007/978-1-61779-585-5_18. [DOI] [PubMed] [Google Scholar]
- 20.Cohen NM, Kenigsberg E, Tanay A. Primate CpG islands are maintained by heterogeneous evolutionary regimes involving minimal selection. Cell. 2011;145:773–786. doi: 10.1016/j.cell.2011.04.024. [DOI] [PubMed] [Google Scholar]
- 21.Nussinov R. Compositional variations in DNA sequences. Comput. Appl. Biosci. 1991;7:287–293. doi: 10.1093/bioinformatics/7.3.287. [DOI] [PubMed] [Google Scholar]
- 22.Saitou N, Nei M. The neighbor-joining method: a new method for reconstructing phylogenetic trees. Mol. Biol. Evol. 1987;4:406–425. doi: 10.1093/oxfordjournals.molbev.a040454. [DOI] [PubMed] [Google Scholar]
- 23.Kendall MG. A new measure of rank correlation. Biometrika. 1983;30:81–93. [Google Scholar]
- 24.Kendall MG. Rank Correlation Methods. 1970. 4th edn. Charles Griffin, London. [Google Scholar]
- 25.Fredsiund J. PHY-FI: fast and easy online creation and manipulation of phylogeny color figures. BMC Bioinformatics. 2006;7:315. doi: 10.1186/1471-2105-7-315. [DOI] [PMC free article] [PubMed] [Google Scholar]
- 26.Witten LH, Frank E. Data Mining: Practical Machine Learning Tools and Techniques with Java Implementations. San Francisco, CA: Morgan Kaufmann Publishers Inc.; 2000. [Google Scholar]
- 27.Miele V, Bourguignon PY, Robelin D, Nuel G, Richard H. seq++: analyzing biological sequences with a range of Markov-related models. Bioinformatics. 2005;21:2783–2784. doi: 10.1093/bioinformatics/bti389. [DOI] [PubMed] [Google Scholar]