


Abstract
Cell-to-cell variations in protein abundance, called noise, give rise to phenotypic variability between isogenic cells. Studies of noise have focused on stochasticity introduced at transcription, yet the effects of post-transcriptional regulatory processes on noise remain unknown. We study the effects of RyhB, a small-RNA of Escherichia coli produced on iron stress, on the phenotypic variability of two of its downregulated target proteins, using dual chromosomal fusions to fluorescent reporters and measurements in live individual cells. The total noise of each of the target proteins is remarkably constant over a wide range of RyhB production rates despite cells being in stress. In fact, coordinate downregulation of the two target proteins by RyhB reduces the correlation between their levels. Hence, an increase in phenotypic variability under stress is achieved by decoupling the expression of different target proteins in the same cell, rather than by an increase in the total noise of each. Extrinsic noise provides the dominant contribution to the total protein noise over the total range of RyhB production rates. Stochastic simulations reproduce qualitatively key features of our observations and show that a feed-forward loop formed by transcriptional extrinsic noise, an sRNA and its target genes exhibits strong noise filtration capabilities.
INTRODUCTION
The origins and functional roles of the phenotypic variability of genetically identical cells, or noise, have attracted intense attention in recent years (1–4). This variability, which plays a key role in determining developmental decisions and fates (5–7), is expected to grow under conditions of stress (8–11), allowing cells to adapt to changing environments. Noise sources, stemming from fluctuations in the number of proteins and RNA molecules, have been classified into intrinsic and extrinsic types (4,12–14). Intrinsic noise, originating from the stochastic nature of biochemical processes, such as transcription and translation (15), manifests itself as differences in expression between two copies of the same promoter, each labeled with a different reporter, within the same cell. Cell-to-cell variations in factors, such as RNA polymerases, ribosomes and metabolites, affect the expression of all genes equally; therefore, they constitute sources of extrinsic noise (4,12–14).
Gene expression in both prokaryotes and eukaryotes can also be controlled by layers of regulation beyond transcription, e.g. through changes in the levels of mRNAs competent for translation. In bacteria, such as Escherichia coli, this is carried out by small RNA (sRNA) regulators, which are found to be involved in a wide range of responses to environmental cues and stress (16,17). Downregulation of gene expression by sRNAs, their most prevalent mode of action, occurs primarily by the association of an sRNA with a target mRNA, mediated by the RNA chaperone Hfq. Coupled stoichiometric degradation of the paired sRNA–mRNAs then ensues (18). Stoichiometric degradation gives rise to unique regulatory features, such as a linear-threshold switching behavior between an efficiently silenced regime in which the rate of production of the sRNA exceeds that of an mRNA, and thus to low levels of protein, and a regime in which the production rate of the sRNA is smaller than that of the mRNA, leading to a linear increase of mRNA levels with the transcription rate (19,20). Stoichiometric degradation can also lead to an indirect interaction between different targets of an sRNA termed cross-talk, as targets with a higher affinity for the sRNA may reduce the latter’s level (19,20).
The possible consequences of stoichiometric-coupled systems, such as sRNA regulation on noise, have been explored theoretically in a regime dominated by intrinsic noise (19–22). It was found that protein noise  , where
  is the standard deviation and
  the mean of protein number, goes through a maximum at a finite value of
  that corresponds to the regime where the production rates of the sRNA and mRNAs are comparable. This prediction has not been experimentally tested yet.
We report the results of a study of the effects of regulation by an sRNA on protein noise and on the mutual correlation between its targets, using the iron homeostasis network of E. coli as a model system. The network is controlled by the master repressor Fur, a transcription factor that senses the intracellular free iron concentration. In its iron-bound form, Fur represses the expression of genes involved in iron acquisition, storage, oxidative stress and more. When iron is limiting, Fur becomes iron-free, relieving the repression of its target genes, including RyhB, an sRNA that coordinately regulates the expression of ∼20 iron-using proteins (16), by promoting the degradation of their mRNAs (18,23). We focus on the coupled degradation of RyhB with the transcripts of sodB and fumA, coding for iron-superoxide dismutase and fumarase A, an iron-binding enzyme within the trichloroacetic acid cycle, respectively. The concentrations of both proteins were measured simultaneously in individual cells, using chromosomal fusions to fluorescent reporters, sodB-cfp and fumA-yfp, after prolonged exposure to different levels of iron-limiting conditions. This system has allowed us to address the key question of how post-transcriptional regulation by RyhB affects the noise of the two target genes, as well as their mutual correlation under coordinate downregulation (1).
The major findings of our study are that the total noise remains constant within experimental error for most of the natural range of expression of sodB and fumA; second, extrinsic noise sources are the main contribution to the total noise even for the highest levels of RyhB production induced by iron deprivation; third, RyhB production reduces the correlation between the expression levels of the SodB and FumA target proteins in the same cells, and we propose a mechanism that accounts for this behavior under transcriptional extrinsic noise dominance; finally, our stochastic simulations incorporating both extrinsic and intrinsic noise sources show that a feed-forward loop formed by transcriptional extrinsic noise, an sRNA and its target genes strongly attenuates noise, and reproduce qualitatively the key features of our experimental observations.
MATERIALS AND METHODS
Growth conditions
Cells were propagated in LB medium at 37°C overnight from a single-colony inoculum. The cultures were diluted 1:100 into fresh LB medium and grown to OD600 of 0.2–0.4 before the indicated treatment. Cells were then diluted 1:100 into LB medium with different concentrations of diethylene triamine pentaacetic acid (DTPA) (Sigma) and were allowed to grow for 3–4 h to OD600 of 0.2–0.4. Cells were deposited on an agarose gel pad (1.5%) prepared with M9 medium supplemented with casamino acids (0.1%), biotin (1 µg/ml) and glucose (0.5%) and covered with glass slides before mounting on the microscope.
Construction of E. coli reporter strains
The E. coli reporter strain contains sodB::cfp and fumA::yfp genes that bear a translational cfp-fusion to the chromosomal sodB allele and yfp-fusion to the chromosomal fumA allele (Gene Bridges), for additional details see Supplementary Methods.
Experimental set-up
Microscopy was performed on a Zeiss Axiovert 135 epifluorescence microscope with an NA 1.4 phase contrast objective (Zeiss, Germany). Images were recorded with an iXon EMCCD camera (Andor Technology, Northern Ireland). For additional details on the experimental set-up, image acquisition and processing, see Supplementary Methods.
Data corpus and analysis
Images were recorded in four independent runs carried out on different days, probing ∼600 cells per DTPA concentration per run. Means and standard deviations of protein concentrations were calculated from descriptive statistics, whereas error bars were calculated using 1000 bootstrap samplings of the data. For details on correction for cell auto-fluorescence, calculation of fluorescence protein concentrations, parameter estimation and stochastic simulations see Supplementary Methods.
RESULTS
Protein distributions change with iron deprivation
We show in Figure 1 histograms of protein concentrations of SodB-CFP and FumA-YFP (CFP and YFP: cyan and yellow fluorescent protein respectively) measured in the same individual cells (Supplementary Figure S1), grown under different levels of iron deprivation that allow cells to maintain logarithmic cell growth, although with a reduced growth rate (Supplementary Figure S2). As E. coli cells exposed to sudden low-iron conditions exhibit oscillations in the expression of RyhB and other Fur-controlled genes that die out six to seven generations later (25), fluorescence levels were measured 3.5 h after exposing cells to different concentrations of the cell-impermeable iron chelator DTPA (Supplementary Figure S3). The yield of both fluorescently labeled proteins decreased as iron is decreased, as illustrated by a plot of the mean protein concentration  , normalized by the mean value
  when no DTPA is added (Figure 2).
  is equal to 350 ± 50 nM and 130 ± 13 nM for SodB-CFP and FumA-YFP, respectively; the corresponding numbers of mRNA molecules [4.9 ± 0.6 and 1.2 ± 0.2 (mean ± standard error from seven experiments)] as measured by smFISH (single-molecule fluorescence in situ hybridization) techniques are much smaller (Supplementary Figure S4).
Figure 1.
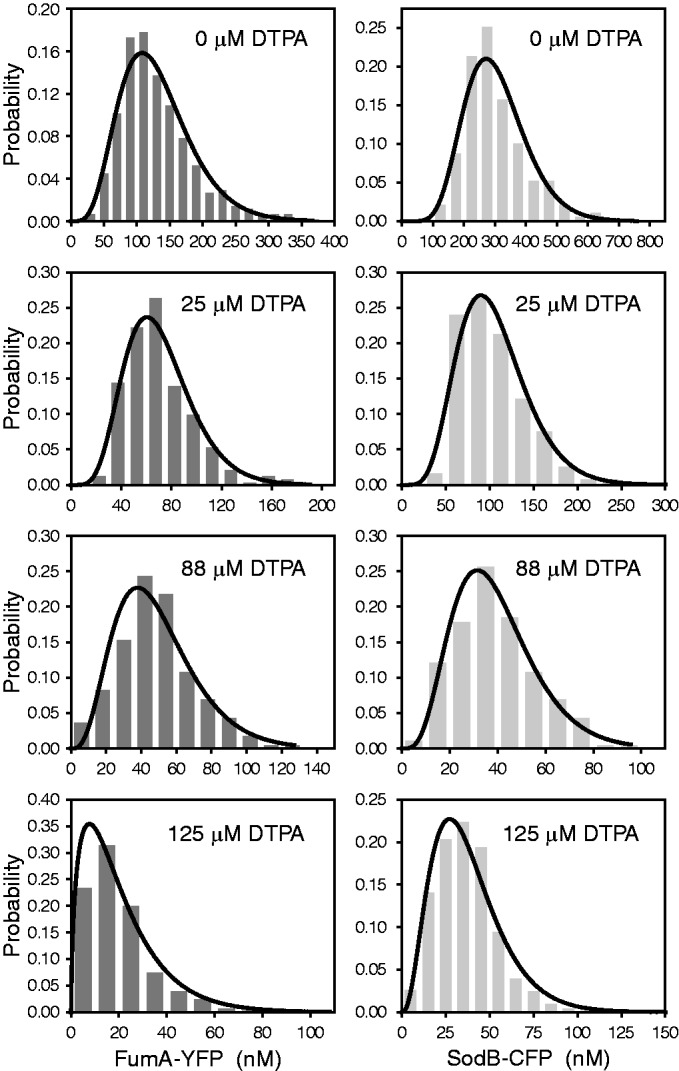
Protein concentration histograms of FumA-YFP and SodB-CFP for different DTPA concentrations in a typical experiment. The concentrations of FumA-YFP (dark gray) and SodB-CFP (light gray) were measured in the same individual cells ∼3.5 h after exposure to the indicated concentrations of DTPA. In a typical run, ∼600 cells were probed on average per DTPA concentration. Protein concentrations were determined from measured fluorescence levels using properties of the binomial distribution (24). Fits of the histograms by Gamma distributions serve as a guide to the eye.
Figure 2.
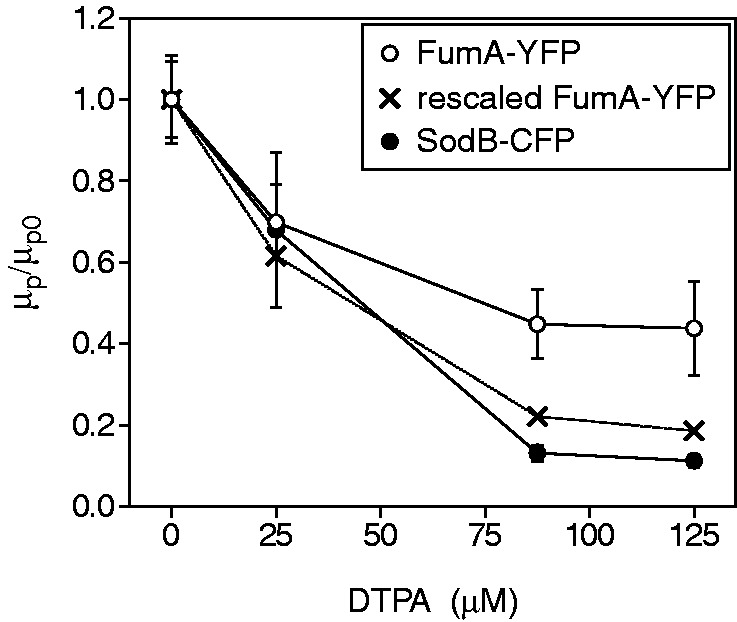
Effects of iron deprivation on mean protein concentration of RyhB targets. Mean intracellular concentrations  of SodB-CFP (full circles) and FumA-YFP (empty circles), normalized by their values at 0 µM DTPA as a function of DTPA concentration. The data for FumA-YFP have also been normalized (crosses) by the ratio of fluorescence density of cells bearing promoter fusion plasmids with either PsodB–YFP or PfumA–YFP (Supplementary Figure S5). Data points represent an average over three independent experimental runs, and error bars represent standard errors.
To ascertain that the observed reduction in mean expression is due to RyhB and not to a possible iron-induced decrease in sodB and fumA transcription, we compared the steady-state fluorescence production from YFP fusions with the promoters of sodB, fumA and ryhB (PsodB–YFP, PfumA–YFP and PryhB–YFP, respectively) at different iron levels, under the same conditions as in the experiments aforementioned (Supplementary Figure S5). The measurements show that production from both PsodB–YFP and PfumA–YFP varies less than a factor of two over the range of the DTPA concentrations used, which is much less than the change in SodB-CFP and FumA-YFP concentrations with added DTPA. In contrast, the average fluorescence production from PryhB–YFP increases by a factor of ∼20 over the same range of DTPA concentrations. Finally, measurements of the mean SodB-CFP and FumA-YFP concentrations in a strain in which RyhB has been deleted show little dependence on iron concentration (Supplementary Figure S6). Together, these findings support the notion that the effects seen in Figures 1 and 2 can largely be attributed to RyhB-induced degradation of its targets.
We note that the difference in magnitude between the effects of iron deprivation on the cell concentrations of SodB and FumA in Figure 2 is accounted for by the difference in activity of their respective promoters (Supplementary Figure S5). Normalization of the mean FumA-YFP concentration by the ratio of the fluorescence production in cells bearing plasmids with PsodB–YFP and PfumA–YFP reporters closely follows the behavior of the mean SodB-CFP concentration (Figure 2).
Extrinsic sources provide the dominant contribution to protein noise
To analyze cell-to-cell variability, we calculated the mean  and standard deviation
  from the data. In most studies of phenotypic variability, noise is quantified by the ratio
  . This quantity exhibits large fluctuations for small
  , i.e. when fluorescence intensities are close to the background, which occurs when iron levels are very low. To avoid dividing by small numbers, we plotted
  as a function of
  . We plot
  as a function of
  for distributions of SodB-CFP and FumA-YFP concentrations measured under different levels of iron deprivation in Figure 3. There are two salient features in the data. First, the dependence of
  on
on  is approximately linear in both cases, implying that the noise ratio
  should be rather insensitive to the level of iron deprivation (Supplementary Figure S7). Second, linear fits to the data of both proteins coincide within experimental error: both the slopes (0.33 ± 0.02 for SodB-CFP and 0.31 ± 0.04 for FumA-YFP), as well as their intercept on the
  axis (
 nM for both proteins, equivalent to approximately seven copies of each protein per cell), are essentially the same (Supplementary Text). Together, these features suggest a common gene-independent mechanism governing the protein phenotypic variability of the two RyhB target genes, as iron deprivation is changed (Supplementary Text).
Figure 3.
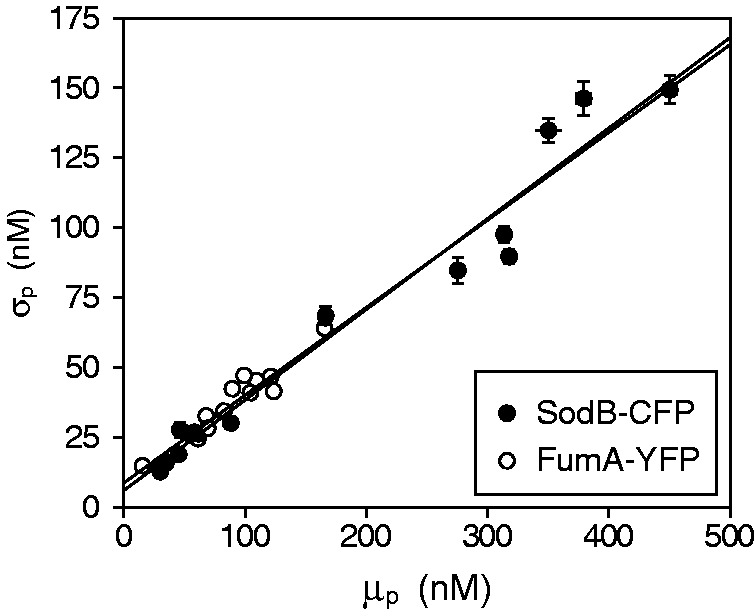
Effects of iron deprivation on the statistics of protein concentration distributions of RyhB targets. Standard deviation  as a function of mean protein concentration
  of SodB-CFP (full circles) and FumA-YFP (empty circles), for different production of RyhB induced by iron deprivation. Lines represent linear fits to the data (R2 = 0.957 and R2 = 0.877, respectively). Error bars were calculated using 1000 bootstrap samplings of the data. Cells were exposed to different concentrations of DTPA in four independent experiments, each carried out under the same conditions as in Figure 1. The data were corrected for cell auto-fluorescence.
Intrinsic noise constitutes the dominant source of cell-to-cell variability of proteins expressed at low levels (26,27). In E. coli, the crossover regime between intrinsically and extrinsically dominated regimes lies at a concentration of ∼10 protein copies per cell (26). As SodB-CFP and FumA-YFP protein levels reach ∼350 and 130 copies per cell, respectively, under iron-rich conditions (Figure 1), their cell-to-cell variability is expected to be dominated by extrinsic sources. The levels of both proteins remain at >10 copies per cell (one protein within a typical E. coli volume corresponds to a concentration of ∼1 nM), even at the lowest intracellular levels of iron probed by our experiments (Figure 3). Furthermore, under iron-rich conditions, the global extrinsic noise extracted from the normalized correlation function of SodB-CFP and FumA-YFP concentrations (Supplementary Methods) yields 0.08 ± 0.01, a value that agrees well with the average value 0.09 ± 0.03 obtained for 13 different pairs of independent protein combinations in doubly labeled strains (26). It has been shown that extrinsic noise when calculated from two independent genes rather than by two copies of the same gene depends solely on global extrinsic sources, such as RNA polymerase and ribosome fluctuations affecting the expression of all genes, and not on sources, such as gene-specific upstream transcription factors (26). Together, these facts constitute further evidence for the fundamental role extrinsic noise sources play in determining the phenotypic variability of RyhB-controlled genes under iron deprivation.
Global extrinsic fluctuations are insensitive to iron deprivation
To test whether global extrinsic fluctuations are directly affected by iron deprivation, we studied cell-to-cell variations in the expression of a gene outside the iron homeostasis network. We show in Figure 4A a scatter plot of normalized fluorescence levels of CFP and YFP reporters measured in the same individual cells for different DTPA concentrations in a representative experimental run. The reporters were expressed from two identical Lac promoters in the chromosome (4). There is considerable overlap between the clusters of points corresponding to different DTPA concentrations. Given that extrinsic noise is measured by the extent of the clusters along the main diagonal, this suggests a low sensitivity of extrinsic noise on iron deprivation. This is confirmed by calculating the extrinsic noise  for each DTPA concentration (Figure 4B), following previous methods (4). We note that also the means of both CFP and YFP themselves are rather insensitive to changes in DTPA concentration (Supplementary Figure S8), as expected for genes outside the iron homeostasis network. One can account for this insensitivity by the balance between a reduction in the number of global factors, such as RNA polymerases and ribosomes (28), and the slower cell growth rate observed in our experiments (Supplementary Figure S2).
Figure 4.
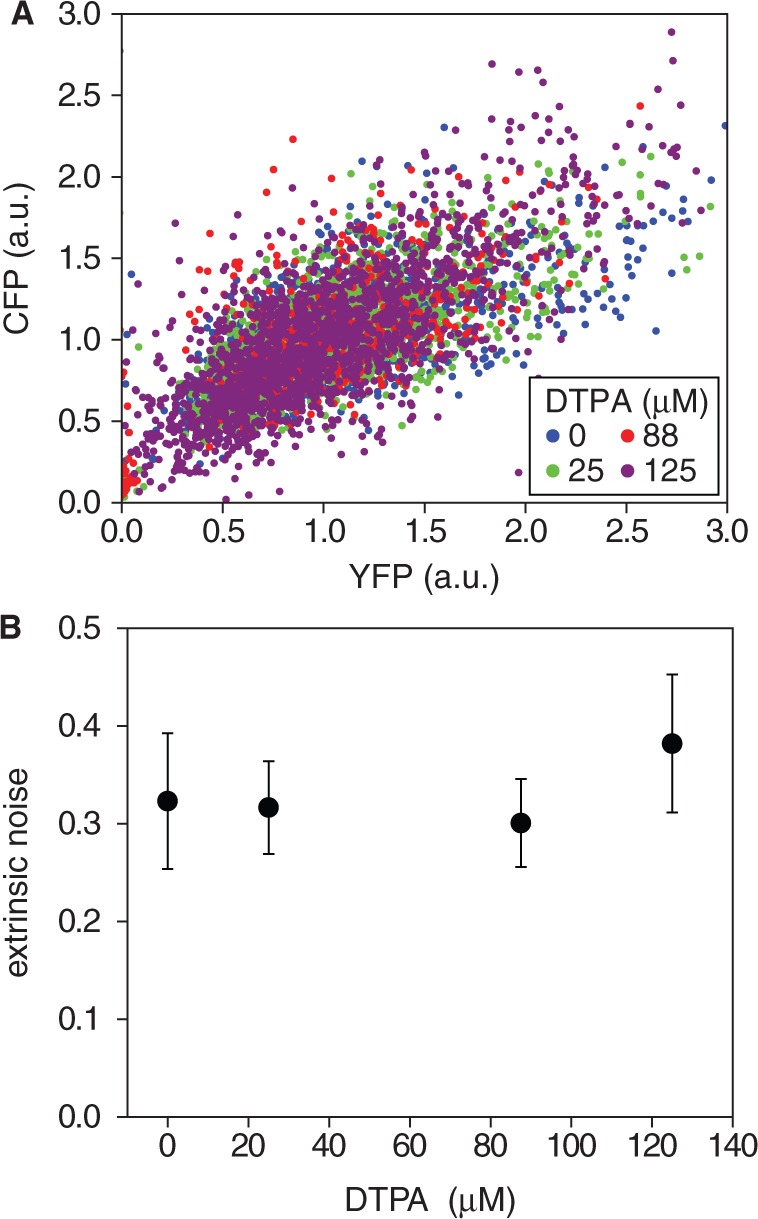
Robustness of extrinsic noise to different levels of iron deprivation. (A) Representative scatter plot of fluorescence intensities of CFP and YFP reporters fused to different copies of the pLac promoter in the same cell, measured at different DTPA concentrations: 0 µM (blue), 25 µM (green), 88 µM (red) and 125 µM (violet). Intensities were normalized both by cell volume and by the mean over the population. (B) Extrinsic noise  as a function of DTPA concentration (4). The data represent averages over two independent experimental runs, each consisting of ∼1300 cells. Error bars represent standard errors.
RyhB reduces the correlation between SodB-CFP and FumA-YFP concentrations
Evidence for RyhB-mediated cross-talk between two RyhB targets has been reported in a study using plasmids that allow independent expression of RyhB and of one of its target genes from inducible promoters (20). To study the effects of extrinsic noise sources on cross-talk, we quantified the extent of correlation between SodB-CFP and FumA-YFP concentrations when expressed in single copy from their native locations. Scatter plots of SodB-CFP and FumA-YFP concentrations measured in the same cells for different concentrations of DTPA are shown in Figure 5A. The clusters of points contract as the DTPA concentration is increased, whereas the slopes of the main diagonals become progressively smaller (Figure 5A).
Figure 5.
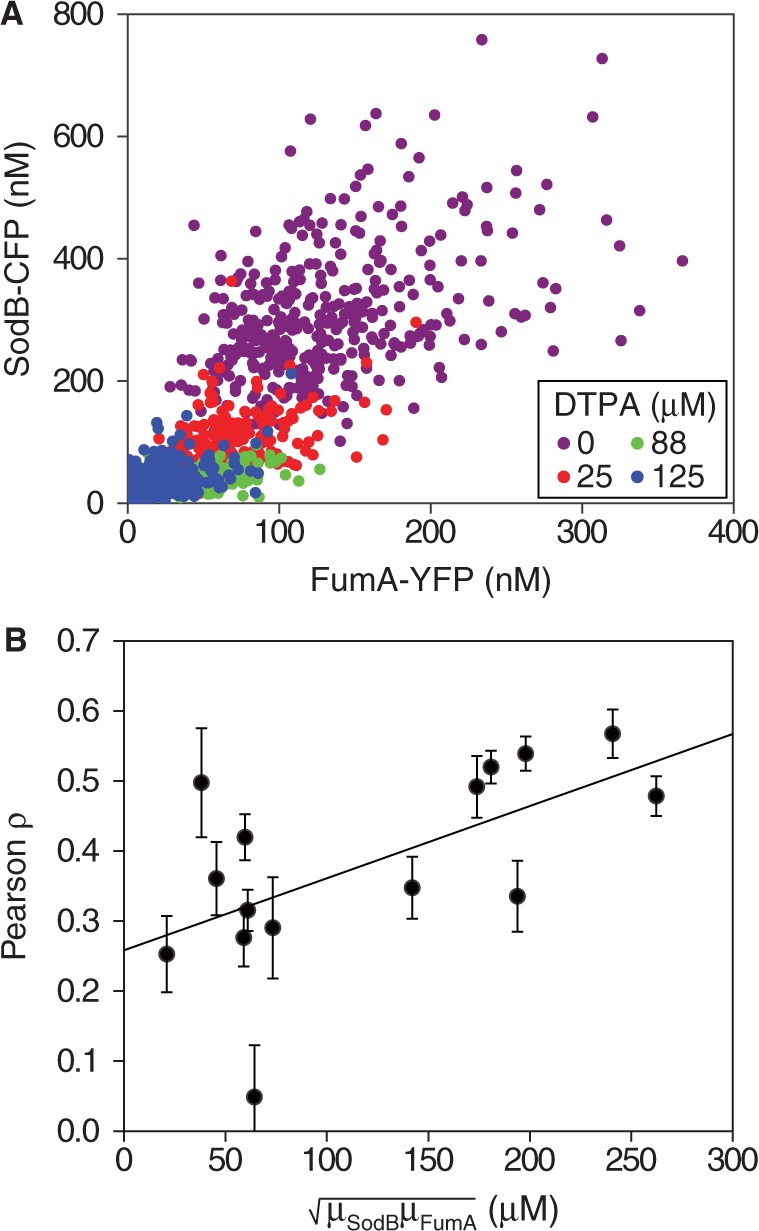
Correlation between the expressions of two RyhB targets for different levels of iron deprivation. (A) Scatter plot of SodB-CFP and FumA-YFP concentrations measured in the same individual cells, for different concentrations of DTPA chelator: 0 µM (violet), 25 µM (red), 88 µM (green) and 125 µM (blue) in a representative experiment. (B) Pearson correlation coefficient ρ between SodB-CFP and FumA-YFP concentrations measured within the same cells as a function of the geometric mean of SodB-CFP and FumA-YFP concentrations ( ), corresponding to the data shown in Figure 3. Error bars represent standard errors computed from 10 000 bootstrap samples. The straight line, a linear fit to the data serving as a guide to the eye, highlights the decreasing trend of ρ with increasing RyhB production. The data were obtained in four independent experiments, each carried out under the same conditions as in Figure 1.
The degradation of both sodB and fumA transcripts by a common factor, namely, RyhB, led us to expect increasing correlation between SodB-CFP and FumA-YFP concentrations as iron conditions become more limiting and the amount of RyhB increases. Contrary to these expectations, we observe that RyhB-induced degradation actually reduces correlations. The Pearson correlation coefficient  between SodB-CFP and FumA-YFP concentrations measured within the same cells is plotted as function of the geometric mean of the respective mean concentrations in Figure 5B. The correlation decreases from a value
  set by extrinsic noise sources when RyhB is low, to
  when RyhB is high, because of iron depletion.
Stochastic simulations that include extrinsic noise reproduce the observed experimental behavior
We simulated the stochastic dynamics of a network consisting of two protein-coding genes and a third gene encoding for an sRNA that promotes the mutual degradation of each of the target transcripts with itself, using Gillespie’s method (29) (Supplementary Methods). It is noteworthy that the protein-coding genes are transcriptionally independent, as no upstream common regulatory components, such as transcription factors correlate their transcription. Pathway-specific extrinsic noise is only introduced by RyhB. In addition to the intrinsic noise stemming from stochastic effects in transcription, translation, sRNA–mRNA interaction and degradation, we introduced extrinsic cell-to-cell variations in either transcription or translation by multiplying the respective rates in each cell by a random number drawn from a Gamma distribution with mean equal to one and the variance chosen so that protein noise is comparable with the measured values. Plots of  as function of the mean protein number
  in simulations, including intrinsic noise alone, or intrinsic noise with extrinsic noise added either in transcription or in translation, are shown in Figure 6A. The dependence of
  on
on  when intrinsic noise alone is included exhibits the expected Poissonian scaling
  . When extrinsic noise in translation is included in addition to intrinsic noise, the behavior of
  is linear for large enough
  as experimentally observed and expected from a theoretical argument (Supplementary Text). At small
  , intrinsic noise becomes dominant, and the data deviate from linearity, so that
  approaches zero asymptotically with
  . A straight line fit to the large
  portion of the data crosses the y-axis at a non-zero value of
  (Figure 6A), as observed experimentally (Figure 3). Finally, when extrinsic noise in transcription is included, the behavior of
  approaches linearity asymptotically for large
  and deviates from linearity at small and intermediate values of
  because of the coupled sRNA–mRNA degradation terms (21). The behavior of the standard deviation
  of the transcript distribution as a function of the mean transcript number
  under the three sources of noise is illustrated in Supplementary Figure S9.
Figure 6.
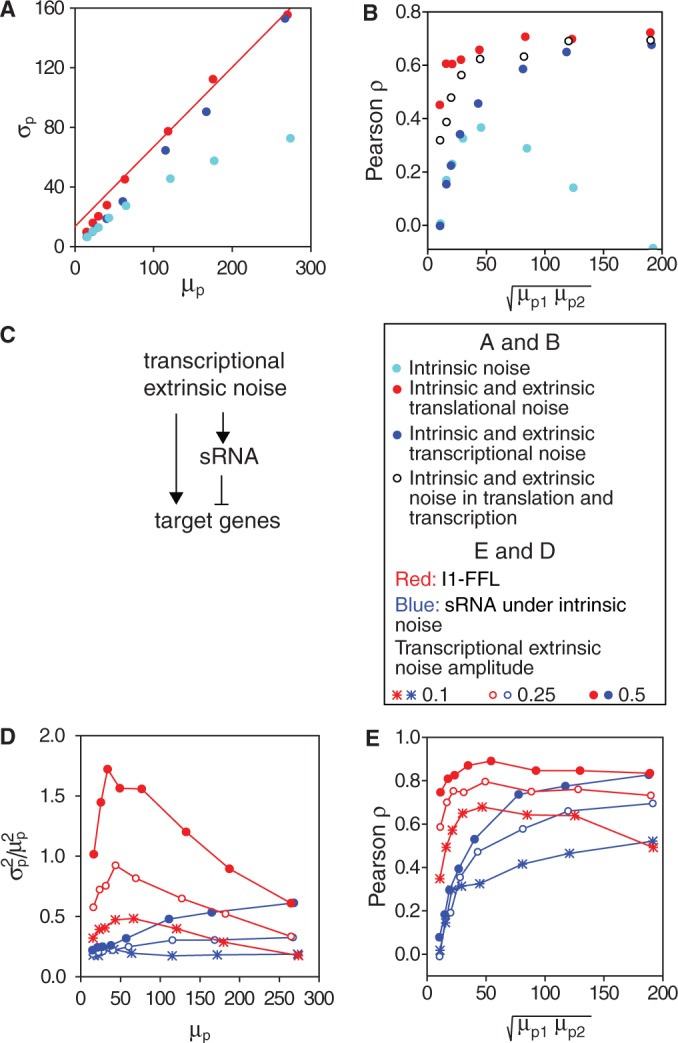
Stochastic simulations of protein variability of two genes downregulated by the same sRNA. (A) Standard deviation of protein number  as a function of the mean protein number
  of one of the two target proteins (the behavior of the second protein is qualitatively similar), in simulations including intrinsic noise alone (cyan); intrinsic plus extrinsic noise in translation (red); intrinsic plus extrinsic noise in transcription (blue). The red line is a linear fit to the four points obtained with intrinsic plus extrinsic noise in translation, with largest value of
  . (B) Pearson correlation coefficient ρ between the protein concentrations of two genes whose transcripts are targets of the same sRNAs, as a function of the mean protein number
  . Empty circles represent simulation results including in addition to intrinsic noise both transcriptional and translational extrinsic noise of comparable contribution. (C) Transcriptional extrinsic noise affects directly the transcription of target genes, as well as indirectly, via the sRNA in one of the arms of an incoherent feed-forward loop configuration. (D) Total protein noise
  as function of
  of one of two target proteins for three different levels of transcriptional extrinsic noise, set by three values of the variance of the Gamma distribution out of which random numbers multiplying transcription rates are drawn: 0.10 (asterisks), 0.25 (empty circles) and 0.50 (full circles). Simulations were carried out when sRNA transcription is subject to transcriptional extrinsic noise in addition to intrinsic noise (blue) and when sRNA production fluctuates due to intrinsic noise alone (red). (E) Pearson correlation coefficient ρ between the concentrations of two target proteins as a function of the geometric average of the respective mean concentrations. Colors and symbols are as in D. The simulations include transcriptional bursting, as well as stochasticity effects due to binomially distributed partition of mRNA and proteins during cell division. All the simulation parameters are listed in Supplementary Table S1.
We also studied the correlated behavior between protein numbers of the two target genes as function of sRNA production. We show in Figure 6B the Pearson correlation coefficient  as function of
  corresponding to the simulations shown in Figure 6A. When intrinsic noise is the only source of stochasticity and no sRNA is present, the expression from the two target genes is uncorrelated. However, a non-zero number of sRNA molecules that induce the degradation of the genes’ transcripts can correlate their protein numbers when the sRNA is limiting. Consequently,
  increases from a small value and then peaks. Conversely, when the number of sRNA molecules is abundant relative to the number of target transcripts, the correlation decreases again.
The behavior of  when extrinsic noise sources are present and dominant over intrinsic noise is different. The expression from the two targets is correlated by the extrinsic noise sources and is maximal in the absence of sRNA. As sRNA synthesis is not affected by extrinsic noise sources in translation,
  is rather insensitive to the presence of sRNA and only decreases when the influence of intrinsic noise of target proteins kicks in. In contrast, extrinsic noise sources in transcription affect not only the transcription from the target genes but also sRNA production, leading to a significant decrease in correlation as sRNA synthesis increases. Although we have analyzed separately the contribution of extrinsic noise at the levels of transcription and translation, both contributions play a role in live cells. They may both be correlated and their relative contributions, which are unknown, may vary with iron deprivation (we plot for illustration purposes the results of simulations, including equal contributions of transcriptional and translational extrinsic noise, in Figure 6B). Even with these caveats in mind, our simulations reproduce the trend observed in our experiments. We note in passing that including more than two targets in our simulations do not affect our conclusions (Supplementary Figure S10).
Incoherent feed-forward loop motif formed by transcriptional extrinsic noise, the sRNA and its targets
Our system can also be viewed as a multi-output incoherent type 1 feed-forward loop (I1-FFL) (30), with global transcriptional control positively regulating the synthesis of both sRNA and mRNA, and the sRNA downregulating the target transcripts (Figure 6C). A similar motif incorporating a transcription factor instead of an sRNA has been shown to reduce transcriptional extrinsic noise in simulations (31). In such an I1-FFL, extrinsic transcriptional fluctuations increase or decrease the transcription rates of both mRNA and sRNA in a coordinated fashion. To study the characteristics of this I1-FFL, we monitored both the protein noise at the output, as well as the Pearson correlation between the levels of two target proteins in response to changing levels of transcriptional extrinsic noise.
Plots of protein noise  as function of the mean of one of the target proteins
  are shown in Figure 6D for three different levels of transcriptional extrinsic noise. These levels were set by changing the variance of the Gamma function out from which the random numbers that multiply transcription rates are drawn. Each plot shows a moderate decrease in noise, as
  decreases due to sRNA production. As expected, noise at the output increases with noise at the input. We compare this response with that obtained when sRNA production is refractory to transcriptional extrinsic noise and thus is only subject to intrinsic fluctuations, also shown in Figure 6D. This breaks the feed-forward loop by de-correlating the transcription rates of the sRNA and target genes. The protein noise in this case is markedly higher than in the I1-FFL configuration for the same level of input noise, demonstrating the strong filtering capabilities of the I1-FFL motif. The peak in noise when sRNA production is only subject to intrinsic fluctuations is a direct result of the stoichiometric degradation of the sRNA and mRNA (see Supplementary Figure S11). Moreover, this peak is unrelated to the theoretically predicted peak in noise that results when only intrinsic sources affect the production of the sRNA and its mRNA targets (21).
We plot in Figure 6E the Pearson correlation coefficient ρ between the levels of two target proteins as a function of the geometric average of the mean protein concentrations  , for three different levels of transcriptional extrinsic noise. When sRNA production is subject to transcriptional extrinsic noise, fluctuations in sRNA levels largely cancel out those in mRNA by mutual degradation, thereby reducing the correlations between the target proteins induced by extrinsic noise. Consequently, ρ decreases with increasing sRNA production and the concomitant reduction of
  . In contrast, when sRNA production is only subject to intrinsic noise, the correlation induced between the two target transcripts and their respective proteins by transcriptional extrinsic noise is preserved and thus ρ is nearly independent of sRNA production. Further support for viewing transcriptional extrinsic noise, an sRNA and target genes as forming an I1-FFL is provided by studying the correlation between the levels of the sRNA and one of its target mRNAs (Supplementary Figure S12). The mutual degradation of the sRNA and its target mRNA is expected to cause a negative correlation. However, transcriptional extrinsic noise correlating their expression largely cancels out this negative correlation.
DISCUSSION
Protein noise is the final outcome of variability introduced at all stages in gene expression. In the present study, we addressed the question of how post-transcriptional regulation by an sRNA affects noise and the correlation between two proteins corresponding to mRNA targets in isogenic cells, within the iron homeostasis network of E. coli. Our results show that extrinsic noise sources are the dominant mechanism driving phenotypic variability of RyhB-controlled genes over most of the natural range of expression of these genes. Extrinsic noise gives rise to a linear dependence between the standard deviation and mean protein concentration, in accordance with another study (32); therefore, the protein noise  is rather insensitive to RyhB production. Cellular parameters are tuned so that intrinsic noise effects become appreciable only at levels of iron deprivation for which growth is impaired. Such robustness of protein noise to reductions in iron levels over a large range is surprising, given the essential character of iron as a trace element and the stress to which cells are submitted in its scarcity. Noise is widely expected to increase under situations of stress (8–11).
Our stochastic simulations reproduce both the linear dependence of distribution width  on mean protein concentration
  for large
  , and the fact that this linear dependence does not cross the origin. As
  must tend to zero with
  , this is a signature of a regime in which intrinsic noise effects should become dominant. This regime is not accessible because of cell toxicity at high-chelator concentrations and low–signal-to-noise considerations. Although extrinsic noise sources introduce variability both through transcription and translation processes, the precision of our experiments does not allow us to determine the relative weight of these two contributions, given that the respective dependences of
  on
on  seen in the simulations are so close (Figure 6).
The predominance of extrinsic noise has also precluded the observation of the predicted enhanced fluctuations in the crossover regime separating the strongly repressed from the expressing regime, characteristic of intrinsic noise in stoichiometrically dominated systems (19,21, 33,34). Direct fluorescence measurements using strains bearing two chromosomal copies of sodB genes tagged with different fluorescent reporters could not separate intrinsic noise from other effects under our experimental conditions (Supplementary Text). We argue that the observation of this non-monotonic behavior of intrinsic noise is unlikely within the context of the iron homeostasis network for two reasons. First, measurements of the protein abundance of genes whose expression is controlled by RyhB (35–37) (e.g. acnB, iscS and sdhCDAB) show that these proteins are present in more than a hundred copies per cell in rich medium (Supplementary Table S3); therefore, their noise is also expected to be dominated by extrinsic sources. Indeed, RyhB downregulates the expression of non-essential iron-using proteins to channel iron to indispensable pathways (38). This function of RyhB is effective only if the downregulated proteins are abundant. Second, the effects of RyhB on transcripts other than mRNAsodB are expected to be weaker (23).
Our simulations also show that a multi-output I1-FFL in which extrinsic noise affects target gene expression both directly and indirectly via an sRNA, effectively reduces input fluctuations of transcriptional extrinsic noise. Noise reduction in I1-FFLs incorporating sRNAs has also been observed when studying their response as a function of the strength of the sRNA–mRNA coupling (39). Finally, we note that filtration of fluctuations in the presence of extrinsic noise sources takes place in I1-FFLs consisting solely of transcription factors (31).
The observed reduction in correlation between SodB and FumA concentrations as RyhB production increases is unexpected. FumA and SodB play roles in distinct biological pathways. We, therefore, expected their degree of correlation, as measured by the Pearson coefficient, to increase when an upstream common factor, i.e. RyhB, downregulates their production in a coordinate fashion. The Pearson correlation coefficient we obtained in our simulations under conditions in which only intrinsic noise sources are present indeed conforms to this expectation: genes that are uncorrelated in the absence of the sRNA become correlated in its presence, at low-to-intermediate levels. When production of sRNA is high, the levels of mRNA are consequently small, increasing intrinsic noise significantly, and thus decreasing the correlation between the concentrations of both proteins (Figure 6B).
Extrinsic noise sources correlate the expression of two target proteins even in the absence of sRNA, drastically altering the picture expected from intrinsic noise alone. For simplicity, we discuss the two contributions, extrinsic noise in translation and transcription separately. Translational extrinsic noise strongly correlates the concentrations of the two proteins by fluctuations in the translation rate, overshadowing the weak intrinsic correlation induced by fluctuations in RyhB levels. Note that sRNA production is refractory to extrinsic noise in translation. The Pearson correlation is rather insensitive to changes in sRNA levels except at high sRNA production rates, when mRNA levels are very low, and intrinsic noise effects lead to a minor decrease in correlation (Figure 6B).
Extrinsic noise in transcription, which affects sRNA synthesis in addition to protein production, does lead to a reduction in the Pearson correlation with sRNA synthesis as observed experimentally. We outline now the mechanism behind the reduction in correlation we observe. Under transcriptional extrinsic noise dominance, there is a positive correlation between the production rates of the sRNA and its target transcripts. Therefore, the sRNA-induced degradation rate of the target transcripts will be larger in cells that have a higher transcription rate. Assuming translation to be proportional to the amount of transcript for each protein, the correlation is preserved for the respective proteins. Consequently, a cigar-shaped cluster of cells in a scatter of protein concentrations obtained under iron-rich conditions will tend to become more circular under iron-poor conditions, thereby reducing the Pearson correlation between both target proteins. This mechanism is illustrated schematically in Supplementary Figure S13.
The behavior of SodB and FumA observed in our experiments does not depend on any specific features of these proteins, but only on their being abundant and downregulated by an sRNA. We, therefore, expect our conclusions to be more general and applicable to other proteins in E. coli that are downregulated by an sRNA, and whose abundance is such that cell-to-cell differences are dominated by extrinsic noise sources. Further support for this claim is provided by the fact that our simulations depend only on generic features of sRNA regulation, and that the qualitative nature of the results is robust to changes in parameters over a wide range. We have compiled a list of diverse sRNAs, some of their respective target genes and their abundance, for which the same behavior might be observed in the Supplementary Table S3. It is also noteworthy that the reduction in correlation we observed both in experiments and in the simulations does not depend on features unique to sRNA regulation, such as the stoichiometric degradation with their target transcripts. It is, therefore, conceivable that a reduction in correlation may also be observed between proteins in incoherent feed-forward loops that incorporate repressors instead of sRNAs. In the case of a transcriptional repressor, which also requires translation for the synthesis of the repressor protein, extrinsic noise in translation can be similarly filtered out by the I1-FFL as transcriptional noise.
In this study, we addressed the question of how the post-transcriptional downregulation of gene expression by an sRNA affects the cell-to-cell variability of target proteins. The picture that emerges is that protein noise is highly robust to downregulation by sRNA over a wide range of sRNA production rates, in spite of considerable metabolic remodeling revealed by the large reduction in the mean concentrations of the iron-using proteins we probed. An unexpected reduction in the correlation between the concentrations of two RyhB protein targets in the same cells was observed under iron deprivation. Extrinsic noise affecting the expression of all genes in the cell, particularly in transcription, affords the most parsimonious explanation for these results. Intrinsic effects stemming from the very small numbers of the molecular species involved only become significant for severe iron-limiting conditions, under which toxicity effects cannot be neglected. The reduction in the correlation between FumA and SodB under iron deprivation allows for larger independent variations of both proteins within cells, leading to a wider range of cell variants in a population. Thus, an increase in phenotypic variability is achieved by decoupling between protein concentrations in the same cell, rather than by an increase in the total noise of each protein. This increase in phenotypic variability may enhance the probability of survival under stress conditions (9), an advantage from an evolutionary standpoint.
SUPPLEMENTARY DATA
Supplementary Data are available at NAR Online: Supplementary Tables 1–4, Supplementary Figures 1–13, Supplementary Methods 1–9, Supplementary Text 1–3 and Supplementary References [40–46].
FUNDING
Funding for open access charge: Israel Science Foundation (842/08 to J.S.); Clore fellowship (to T.F.); Intramural Research Program of the National Institutes of Health, National Cancer Institute, Center for Cancer Research (in part) and Trans National Institutes of Health/Food and Drug Administration Intramural Biodefense Program Grant of National Institutes of Allergy and Infectious Disease (in part) (to D.L.C.).
Conflict of interest statement. None declared.
Supplementary Material
ACKNOWLEDGEMENTS
The authors are grateful to an anonymous reviewer for drawing our attention to the analogy between sRNA regulation transducing extrinsic noise and a feed-forward loop and to A. Amir for illuminating discussions. Furthermore, they thank N. Friedman for careful reading of the manuscript, M. Elowitz for the kind gift of strain MG22, N. Brenner for valuable discussions and D. Zeevi for considerable help.
REFERENCES
- 1.Eldar A, Elowitz MB. Functional roles for noise in genetic circuits. Nature. 2010;467:167–173. doi: 10.1038/nature09326. [DOI] [PMC free article] [PubMed] [Google Scholar]
- 2.Balazsi G, van Oudenaarden A, Collins JJ. Cellular decision making and biological noise: from microbes to mammals. Cell. 2011;144:910–925. doi: 10.1016/j.cell.2011.01.030. [DOI] [PMC free article] [PubMed] [Google Scholar]
- 3.Raser JM, O'Shea EK. Noise in gene expression: origins, consequences, and control. Science. 2005;309:2010–2013. doi: 10.1126/science.1105891. [DOI] [PMC free article] [PubMed] [Google Scholar]
- 4.Elowitz MB, Levine AJ, Siggia ED, Swain PS. Stochastic gene expression in a single cell. Science. 2002;297:1183–1186. doi: 10.1126/science.1070919. [DOI] [PubMed] [Google Scholar]
- 5.Zeng L, Skinner SO, Zong C, Sippy J, Feiss M, Golding I. Decision making at a subcellular level determines the outcome of bacteriophage infection. Cell. 2010;141:682–691. doi: 10.1016/j.cell.2010.03.034. [DOI] [PMC free article] [PubMed] [Google Scholar]
- 6.Wernet MF, Mazzoni EO, Celik A, Duncan DM, Duncan I, Desplan C. Stochastic spineless expression creates the retinal mosaic for colour vision. Nature. 2006;440:174–180. doi: 10.1038/nature04615. [DOI] [PMC free article] [PubMed] [Google Scholar]
- 7.Suel GM, Kulkarni RP, Dworkin J, Garcia-Ojalvo J, Elowitz MB. Tunability and noise dependence in differentiation dynamics. Science. 2007;315:1716–1719. doi: 10.1126/science.1137455. [DOI] [PubMed] [Google Scholar]
- 8.Booth IR. Stress and the single cell: intrapopulation diversity is a mechanism to ensure survival upon exposure to stress. Int. J. Food Microbiol. 2002;78:19–30. doi: 10.1016/s0168-1605(02)00239-8. [DOI] [PubMed] [Google Scholar]
- 9.Pigliucci M, Murren CJ. Perspective: genetic assimilation and a possible evolutionary paradox: can macroevolution sometimes be so fast as to pass us by? Evolution. 2003;57:1455–1464. doi: 10.1111/j.0014-3820.2003.tb00354.x. [DOI] [PubMed] [Google Scholar]
- 10.Lopez-Maury L, Marguerat S, Bahler J. Tuning gene expression to changing environments: from rapid responses to evolutionary adaptation. Nat. Rev. Genet. 2008;9:583–593. doi: 10.1038/nrg2398. [DOI] [PubMed] [Google Scholar]
- 11.Fraser D, Kaern M. A chance at survival: gene expression noise and phenotypic diversification strategies. Mol. Microbiol. 2009;71:1333–1340. doi: 10.1111/j.1365-2958.2009.06605.x. [DOI] [PubMed] [Google Scholar]
- 12.Swain PS, Elowitz MB, Siggia ED. Intrinsic and extrinsic contributions to stochasticity in gene expression. Proc. Natl Acad. Sci. USA. 2002;99:12795–12800. doi: 10.1073/pnas.162041399. [DOI] [PMC free article] [PubMed] [Google Scholar]
- 13.Becskei A, Kaufmann BB, van Oudenaarden A. Contributions of low molecule number and chromosomal positioning to stochastic gene expression. Nat. Genet. 2005;37:937–944. doi: 10.1038/ng1616. [DOI] [PubMed] [Google Scholar]
- 14.Volfson D, Marciniak J, Blake WJ, Ostroff N, Tsimring LS, Hasty J. Origins of extrinsic variability in eukaryotic gene expression. Nature. 2006;439:861–864. doi: 10.1038/nature04281. [DOI] [PubMed] [Google Scholar]
- 15.Cai L, Friedman N, Xie XS. Stochastic protein expression in individual cells at the single molecule level. Nature. 2006;440:358–362. doi: 10.1038/nature04599. [DOI] [PubMed] [Google Scholar]
- 16.Beisel CL, Storz G. Base pairing small RNAs and their roles in global regulatory networks. FEMS Microbiol. Rev. 2010;34:866–882. doi: 10.1111/j.1574-6976.2010.00241.x. [DOI] [PMC free article] [PubMed] [Google Scholar]
- 17.Gottesman S, Storz G. Bacterial small RNA regulators: versatile roles and rapidly evolving variations. Cold Spring Harb. Perspect. Biol. 2010;3 doi: 10.1101/cshperspect.a003798. pii: a003798. [DOI] [PMC free article] [PubMed] [Google Scholar]
- 18.Masse E, Escorcia FE, Gottesman S. Coupled degradation of a small regulatory RNA and its mRNA targets in Escherichia coli. Genes Dev. 2003;17:2374–2383. doi: 10.1101/gad.1127103. [DOI] [PMC free article] [PubMed] [Google Scholar]
- 19.Elf J, Paulsson J, Berg OG, Eherenberg M. Mesoscopic kinetics with applications in protein synthesis. Topics in current genetics. In: Alberghina L, Westerhoff HV, editors. Systems Biology: Definitions and Perspectives. Berlin, Germany: Springer-Verlag; 2005. pp. 95–116. [Google Scholar]
- 20.Levine E, Zhang Z, Kuhlman T, Hwa T. Quantitative characteristics of gene regulation by small RNA. PLoS Biol. 2007;5:e229. doi: 10.1371/journal.pbio.0050229. [DOI] [PMC free article] [PubMed] [Google Scholar]
- 21.Mehta P, Goyal S, Wingreen NS. A quantitative comparison of sRNA-based and protein-based gene regulation. Mol. Syst. Biol. 2008;4:221. doi: 10.1038/msb.2008.58. [DOI] [PMC free article] [PubMed] [Google Scholar]
- 22.Jia T, Kulkarni RV. Post-transcriptional regulation of noise in protein distributions during gene expression. Phys. Rev. Lett. 2010;105:018101. doi: 10.1103/PhysRevLett.105.018101. [DOI] [PubMed] [Google Scholar]
- 23.Masse E, Vanderpool CK, Gottesman S. Effect of RyhB small RNA on global iron use in Escherichia coli. J. Bacteriol. 2005;187:6962–6971. doi: 10.1128/JB.187.20.6962-6971.2005. [DOI] [PMC free article] [PubMed] [Google Scholar]
- 24.Rosenfeld N, Perkins TJ, Alon U, Elowitz MB, Swain PS. A fluctuation method to quantify in vivo fluorescence data. Biophys. J. 2006;91:759–766. doi: 10.1529/biophysj.105.073098. [DOI] [PMC free article] [PubMed] [Google Scholar]
- 25.Amir A, Meshner S, Beatus T, Stavans J. Damped oscillations in the adaptive response of the iron homeostasis network of E. coli. Mol. Microbiol. 2010;76:428–436. doi: 10.1111/j.1365-2958.2010.07111.x. [DOI] [PubMed] [Google Scholar]
- 26.Taniguchi Y, Choi PJ, Li GW, Chen H, Babu M, Hearn J, Emili A, Xie XS. Quantifying E. coli proteome and transcriptome with single-molecule sensitivity in single cells. Science. 2010;329:533–538. doi: 10.1126/science.1188308. [DOI] [PMC free article] [PubMed] [Google Scholar]
- 27.Bar-Even A, Paulsson J, Maheshri N, Carmi M, O'Shea E, Pilpel Y, Barkai N. Noise in protein expression scales with natural protein abundance. Nat. Genet. 2006;38:636–643. doi: 10.1038/ng1807. [DOI] [PubMed] [Google Scholar]
- 28.Bremer H, Dennis PP. In: Escherichia coli and Salmonella: cellular and molecular biology. 2nd edn. Neidhardt FC, Curtiss IR, Ingraham JL, Lin EC, Low KB, Magasanik B, Reznikoff WS, Riley M, Schaechter M, Umbarger HE, editors. Washington, DC: ASM Press; 1996. pp. 1553–1569. [Google Scholar]
- 29.Gillespie DT. Exact stochastic simulation of coupled chemical-reactions J. Phys. Chem. 1977;81:2340–2361. [Google Scholar]
- 30.Alon U. Network motifs: theory and experimental approaches. Nat. Rev. Genet. 2007;8:450–461. doi: 10.1038/nrg2102. [DOI] [PubMed] [Google Scholar]
- 31.Shahrezaei V, Ollivier JF, Swain PS. Colored extrinsic fluctuations and stochastic gene expression. Mol. Syst. Biol. 2008;4:196. doi: 10.1038/msb.2008.31. [DOI] [PMC free article] [PubMed] [Google Scholar]
- 32.Salman H, Brenner N, Tung C, Elyahu N, Stolovicki E, Moore L, Libchaber A, Braun E. Universal protein fluctuations in populations of microorganisms. Phys. Rev. Lett. 2012;108:e238105. doi: 10.1103/PhysRevLett.108.238105. [DOI] [PubMed] [Google Scholar]
- 33.Paulsson J, Ehrenberg M. Noise in a minimal regulatory network: plasmid copy number control. Q. Rev. Biophys. 2001;34:1–59. doi: 10.1017/s0033583501003663. [DOI] [PubMed] [Google Scholar]
- 34.Jia Y, Liu W, Li A, Yang L, Zhan X. Intrinsic noise in post-transcriptional gene regulation by small non-coding RNA. Biophys. Chem. 2009;143:60–69. doi: 10.1016/j.bpc.2009.04.001. [DOI] [PubMed] [Google Scholar]
- 35.Caron MP, Lafontaine DA, Masse E. Small RNA-mediated regulation at the level of transcript stability. RNA Biol. 2010;7:140–144. doi: 10.4161/rna.7.2.11056. [DOI] [PubMed] [Google Scholar]
- 36.Prevost K, Desnoyers G, Jacques JF, Lavoie F, Masse E. Small RNA-induced mRNA degradation achieved through both translation block and activated cleavage. Genes Dev. 2011;25:385–396. doi: 10.1101/gad.2001711. [DOI] [PMC free article] [PubMed] [Google Scholar]
- 37.Masse E, Gottesman S. A small RNA regulates the expression of genes involved in iron metabolism in Escherichia coli. Proc. Natl Acad. Sci. USA. 2002;99:4620–4625. doi: 10.1073/pnas.032066599. [DOI] [PMC free article] [PubMed] [Google Scholar]
- 38.Jacques JF, Jang S, Prevost K, Desnoyers G, Desmarais M, Imlay J, Masse E. RyhB small RNA modulates the free intracellular iron pool and is essential for normal growth during iron limitation in Escherichia coli. Mol. Microbiol. 2006;62:1181–1190. doi: 10.1111/j.1365-2958.2006.05439.x. [DOI] [PubMed] [Google Scholar]
- 39.Osella M, Bosia C, Cora D, Caselle M. The role of incoherent microRNA-mediated feedforward loops in noise buffering. PLoS Comput. Biol. 2011;7:e1001101. doi: 10.1371/journal.pcbi.1001101. [DOI] [PMC free article] [PubMed] [Google Scholar]
- 40.Guzman LM, Belin D, Carson MJ, Beckwith J. Tight regulation, modulation, and high-level expression by vectors containing the arabinose PBAD promoter. J. Bacteriol. 1995;177:4121–4130. doi: 10.1128/jb.177.14.4121-4130.1995. [DOI] [PMC free article] [PubMed] [Google Scholar]
- 41.So LH, Ghosh A, Zong C, Sepulveda LA, Segev R, Golding I. General properties of transcriptional time series in Escherichia coli. Nat. Genet. 2011;43:554–560. doi: 10.1038/ng.821. [DOI] [PMC free article] [PubMed] [Google Scholar]
- 42.Noll S, Hampp G, Bausbacher H, Pellegata N, Kranz H. Site-directed mutagenesis of multi-copy-number plasmids: Red/ET recombination and unique restriction site elimination. Biotechniques. 2009;46:527–533. doi: 10.2144/000113150. [DOI] [PubMed] [Google Scholar]
- 43.Sharan SK, Thomason LC, Kuznetsov SG, Court DL. Recombineering: a homologous recombination-based method of genetic engineering. Nat. Protoc. 2009;4:206–223. doi: 10.1038/nprot.2008.227. [DOI] [PMC free article] [PubMed] [Google Scholar]
- 44.Svenningsen SL, Costantino N, Court DL, Adhya S. On the role of Cro in lambda prophage induction. Proc. Natl Acad. Sci. USA. 2005;102:4465–4469. doi: 10.1073/pnas.0409839102. [DOI] [PMC free article] [PubMed] [Google Scholar]
- 45.Bubunenko M, Baker T, Court DL. Essentiality of ribosomal and transcription antitermination proteins analyzed by systematic gene replacement in Escherichia coli. J. Bacteriol. 2007;189:2844–2853. doi: 10.1128/JB.01713-06. [DOI] [PMC free article] [PubMed] [Google Scholar]
- 46.Baba T, Ara T, Hasegawa M, Takai Y, Okumura Y, Baba M, Datsenko KA, Tomita M, Wanner BL, Mori H. Construction of Escherichia coli K-12 in-frame, single-gene knockout mutants: the Keio collection. Mol. Syst. Biol. 2006;2:2006–0008. doi: 10.1038/msb4100050. [DOI] [PMC free article] [PubMed] [Google Scholar]
Associated Data
This section collects any data citations, data availability statements, or supplementary materials included in this article.