


Abstract
DNA methyltransferase 1 (Dnmt1) reestablishes methylation of hemimethylated CpG sites generated during DNA replication in mammalian cells. Two subdomains, the proliferating cell nuclear antigen (PCNA)-binding domain (PBD) and the targeting sequence (TS) domain, target Dnmt1 to the replication sites in S phase. We aimed to dissect the details of the cell cycle–dependent coordinated activity of both domains. To that end, we combined super-resolution 3D-structured illumination microscopy and fluorescence recovery after photobleaching (FRAP) experiments of GFP-Dnmt1 wild type and mutant constructs in somatic mouse cells. To interpret the differences in FRAP kinetics, we refined existing data analysis and modeling approaches to (i) account for the heterogeneous and variable distribution of Dnmt1-binding sites in different cell cycle stages; (ii) allow diffusion-coupled dynamics; (iii) accommodate multiple binding classes. We find that transient PBD-dependent interaction directly at replication sites is the predominant specific interaction in early S phase (residence time Tres ≤10 s). In late S phase, this binding class is taken over by a substantially stronger (Tres ∼22 s) TS domain-dependent interaction at PCNA-enriched replication sites and at nearby pericentromeric heterochromatin subregions. We propose a two-loading-platform-model of additional PCNA-independent loading at postreplicative, heterochromatic Dnmt1 target sites to ensure faithful maintenance of densely methylated genomic regions.
INTRODUCTION
DNA methylation is an essential epigenetic mechanism in mammals involved in gene regulation, genomic imprinting, X inactivation and carcinogenesis (1–3). Once established de novo during cell differentiation, the genomic methylation pattern is maintained by the DNA methyltransferase 1 (Dnmt1), a 183 kDa–sized enzyme that transfers methyl groups to hemimethylated substrate CpG sites generated during DNA synthesis in S phase (2,4,5). Hence, it seems obvious that the regulation of Dnmt1 is tightly coupled to DNA replication. In fact, using fluorescence recovery after photobleaching (FRAP), we have previously reported that Dnmt1 associates with replication foci (RF) by a highly transient interaction with the replication clamp proliferating cell nuclear antigen (PCNA) in early S phase via the PCNA-binding domain (PBD) of Dnmt1, enhancing the efficiency of covalent complex formation at its substrate sites (6,7). PCNA forms a homotrimeric ring around the DNA at replication forks and operates as a quasi-immobile loading platform for various replication-associated factors (8,9). Furthermore, the targeting sequence (TS) domain has been found to mediate association of Dnmt1 to constitutive heterochromatin from late S phase into G2 (10,11), the latter finding challenging the strict coupling to the replication process. In addition, the TS domain was implicated in the interaction with Uhrf1 (12). Uhrf1 is an essential cofactor in the DNA methylation process and it has been proposed that Uhrf1 targets Dnmt1 to hemimethylated sites (13–17). Although the role and regulation of Dnmt1 has been a popular field of research for many years, the details and functional implications of the cell cycle–dependent coordinated binding activity of the PBD and the TS domain still remain elusive.
FRAP techniques offer an effective tool to study in vivo the mobility of cellular proteins and to gain a better understanding of molecular interactions that drive or limit the mobility of fluorescent fusions expressed in cells (18–21). By bleaching a subpopulation of fluorescent proteins and by analyzing the redistribution of fluorescence over time, one can obtain measures of the half-time of recovery and the size of mobile fractions. To furthermore extract kinetic parameters from fluorescence recovery curves, one can describe the underlying dynamics of the proteins by a set of differential equations and apply a fitting procedure. Such kinetic modeling approaches can be useful to detect and quantify distinct dynamic populations [mobility classes (MCs)] and have been successfully used to quantitatively characterize diffusion and to some extent interactions inside living cells (22–24). Within the nucleus, the mobility of protein factors can be limited by binding to rather immobile structures, most prominently to chromatin, or to stationary enzyme complexes, such as the replication machinery, transcription domains or splicing speckles (25–27). The majority of these interactions are surprisingly transient to accommodate dynamic exchange, which is pivotal to provide cellular plasticity and efficient responses to external signals (28–30).
We aimed to extract quantitative measures of the binding properties of Dnmt1 in vivo. Unlike for many other nuclear factors, Dnmt1-binding sites are non-homogeneously distributed with association sites constantly changing their location throughout the cell cycle. To characterize the contribution of the PBD and TS domain on these changing interactions, we analyzed the mobility of wild type and mutants of GFP-tagged Dnmt1. In particular, we interpreted the differences between the mutants by modeling FRAP experiments where half of the nucleus is bleached. As the spatial distribution of the different binding sites is unknown a priori, we modified classical reaction-diffusion models in a way that diffusion is simplified into a two-compartment exchange model and binding events are averaged over the entire half-nucleus. This model also takes into account potential multiple binding partners of proteins with different binding affinities.
Our results provide evidence that the collective integrity of the PBD and TS domain is necessary and sufficient for the entire S phase–dependent targeting of Dnmt1 to its localization sites. Transient PBD-mediated interaction at RF is the predominant specific interaction in early S phase, while in late S phase, this binding class is relegated by an ∼2-fold stronger TS domain-dependent binding. Supported by super-resolution imaging with 3D-structured illumination microscopy (3D-SIM) (31,32) we show that TS binding is not restricted to replication sites but also occurs PCNA/PBD-independently at postreplicative constitutive heterochromatin. We propose a two-loading-platform-model in which the increasing density of hemimethylated CpG sites in conjunction with increased level of heterochromatin marks at postreplicative heterochromatin in late S phase provides high-affinity binding sites for TS-mediated binding of Dnmt1. PCNA-independent loading downstream of replication thus provides a mechanism to ensure maintenance of densely methylated heterochromatic DNA sequences.
MATERIALS AND METHODS
Expression constructs and cell culture
The expression constructs, 1xGFP, 2xGFP, 4xGFP, GFP-Dnmt1wt, GFP-Dnmt1Q162E and GFP-Dnmt1ΔTS have been described previously (6,33,34). GFP-Dnmt1Q162E/ΔTS was derived from GFP-Dnmt1ΔTS by overlap extension PCR. Mouse C2C12 myoblast cells were cultured in DMEM supplemented with 20% fetal bovine serum and 50 µg/ml gentamycine. For live cell experiments, cells were seeded in Lab-Tek chamber slides (Nunc) or µ-slides (Ibidi), using either pools of stably expressing cells or transiently transfected cells.
Creation of stably expressing cells has been described before (6). For transient transfections, cells were grown up to 30-40% confluence and transfected with TransFectin transfection reagent (Bio-Rad) or FuGENE HD (Roche) according to the manufacturer’s instructions. Cells were then incubated overnight (TransFectin) or ∼40 h (FuGENE HD) before performing FRAP experiments (6).
Only moderately expressing cells with unsuspicious morphology were chosen for further analysis. The overall Dnmt1 level of endogenous and ectopically expressed protein was determined for all analyzed constructs and cell lines by immunofluorescence labeling using a novel Dnmt1-specific rat monoclonal antibody 5A10. Quantitative analysis of labeling intensities revealed on average 2-fold increased protein levels compared with non-transfected control cells confirming no major overexpression of the GFP-Dnmt1 fusion constructs (see Supplementary Methods and Supplementary Figure S1 for details on the antibody characterization and the immunofluorescence assay).
EdU pulse labeling, immunofluorescence staining and structured illumination microscopy
Cells, stably expressing GFP-Dnmt1 fusions were seeded on No. 1.5H precision coverslips (Marienfeld Superior), formaldehyde fixed and permeabilized with ice-cold methanol. For labeling of postreplicative DNA, 5 µM 5-ethnyl-2’-deoxyuridine (EdU) was added to the growth medium 60 min before fixation. Endogenous PCNA was fluorescently labeled either with a rat monoclonal antibody 16D10 (35) or a mouse monoclonal antibody PC10 (Abcam) and secondary antibodies conjugated to Alexa Fluor 594 (Invitrogen) or CF405S (Biotium). GFP was postlabeled with ATTO488 conjugated GFP-Booster (ChromoTek). EdU was detected by Cu (I) catalyzed cycloaddition (‘click-chemistry’) of 20 µM Alexa Fluor 594 Azide (Invitrogen) diluted in 0.1 M Tris/HCl (pH 8.6) containing 4 mM CuSO4 and 50 mM Na-ascorbate. Cells were counterstained with 1 µg/ml 4',6-diamidino-2-phenylindole and embedded in Vectashield (Vector Laboratories).
3D-SIM was performed on a DeltaVision OMX V3 (Applied Precision) system equipped with a 100×/1.40 NA PlanApo oil immersion objective (Olympus), Cascade II:512 EMCCD cameras (Photometrics) and 405, 488 and 593 nm diode lasers. Structured illumination (SI) image stacks were acquired with a z-distance of 125 nm and with 15 raw SI images per plane (5 phases, 3 angles). The SI raw data were then computationally reconstructed with channel specifically measured optical transfer functions using the softWoRX 4.0 software package (Applied Precision) to obtain a super-resolution image stack with a lateral (x,y) resolution of ∼120 nm and an axial (z) resolution of ∼300 nm (31). Images from the different color channels were registered with alignment parameter obtained from calibration measurements with 0.2 µm diameter TetraSpeck beads (Invitrogen).
Live cell microscopy and quantitative FRAP analysis
Live cell imaging and FRAP experiments were typically performed on an UltraVIEW VoX spinning disc microscope with integrated FRAP PhotoKinesis accessory (PerkinElmer) assembled to an Axio Observer D1 inverted stand (Zeiss) and using a 63×/1.4 NA Plan-Apochromat oil immersion objective. The microscope was equipped with a heated environmental chamber set to 37°C. Fluorophores were excited with 488 nm or 561 nm solid-state diode laser lines. Confocal image series were typically recorded with 14-bit image depth, a frame size of 256 × 256 pixels, a pixel size of 110 nm and with time intervals of 154 ms. For photobleaching experiments, the bleach regions, typically with a length of 8–10 µm, were chosen to cover the anterior half of the oval-shaped nucleus. Photobleaching was performed using two iterations with the acousto-optical tunable filter (AOTF) of the 488 nm and the 514 nm laser line set to 100% transmission. Typically, 20 prebleach and 780 postbleach frames were recorded for each series. In some cases, FRAP experiments were performed on a TCS SP5 AOBS confocal laser scanning microscope (Leica) using comparable settings as previously described (6).
Data correction, normalization and quantitative evaluations were performed by automated processing with ImageJ (http://rsb.info.nih.gov/ij/) using a set of self-developed macros followed by calculations in Excel. Details are provided in the Supplementary Methods and in Supplementary Figure S4.
Mathematical model
The mathematical models used to statistically infer the kinetic parameters from corrected and normalized FRAP datasets are based on a compartmental approach and biochemical kinetic principles. The model for diffusion-uncoupled FRAP, i.e. for molecules that diffuse much more rapidly than they bind or unbind, has previously been described (22,36). A model for diffusion-coupled FRAP is developed in this work and illustrated in Figure 4A; a similar approach has been taken in (37). The model considers transitions between the bound and the free state of a protein with association rate constant kon and dissociation rate constant koff . As substantiated in the Supplementary Methods, the association and dissociation dynamics can be expressed in terms of linear ordinary differential equations (ODEs) when replacing kon by an effective association rate constant
 . The ODEs are given below. While bound proteins remain fixed at the respective binding sites, free proteins diffuse through the nucleus, thus changing their locations. Movements between the bleached and the unbleached section are modeled with a diffusion rate constant kdiff. Its value depends on the geometry of the cell and is not immediately eligible for interpretation purposes. See the Supplementary Methods for details on the modeling of the movement of proteins.
Figure 4.

Refined diffusion-coupled compartmental model for three MCs and determination of kdiff from GFP multimer measurements. (A) The nuclear compartment is divided into four main compartments: bleached and unbleached molecules in the bound or free state, respectively. The bound state can be subdivided into three compartments with specific properties. For Dnmt1, we choose two DMCs (DMC1 and DMC2, blue and green frame, respectively) and one CMC (red frame) with a fixed koff. Molecules bind and unbind with association and dissociation rates given by kon,i and koff,i, respectively. In our refined modeling approach, the parameter fbl is experimentally determined for each individual FRAP series. Migration of molecules is implemented in the model by introducing a new diffusion rate constant kdiff. This parameter corrects for the size-dependent exchange of the free molecules between the bleached and unbleached compartment. Parameter and variables entering the sets of differential equations are written in bold; predetermined/fixed values are indicated. (B) Quantitative FRAP evaluation of GFP multimers. The GFP mobility of the dimer and the tetramer decreases stepwise as compared with the monomer. The kdiff factor for the GFP constructs is estimated from the model with no DMC/CMC. From these values, the corresponding kdiff factor for the size of GFP-Dnmt1 is estimated using an exponential regression curve (inset diagram).
Bleached and unbleached molecules are assumed to behave identically, and therefore it suffices to focus on one type only. Hence, let  ,
,  ,
,  and
and  denote the fractions of unbleached free and bound proteins in the bleached and unbleached sections, measured with respect to all unbleached proteins in the nucleus. These four parameters sum up to one such that one of them can be left out. Define
  and
and  . The overall dynamics of unbleached proteins is described by
 |
(1) |
 |
(2) |
| (3) |
The recovery curve equals  . This term was adjusted to the data normalization procedure described in the Supplementary Methods and approaches the value one as time progresses.
There is possibly more than one type of binding partner for Dnmt1, i.e. the protein may sometimes associate to a partner of one type and sometimes to a partner of another type. These partners may differ with respect to the affinity of Dnmt1 to enter the bound state and the mean residence times in this state. All binding partners with identical or similar kinetic properties are gathered in one MC. This term seems more appropriate than classes of binding sites (22) because different sites with identical kinetic properties cannot be distinguished using FRAP data. The number of MCs could hence be smaller than the number of different binding partners. Furthermore binding-unrelated processes like anomalous diffusion can fall into an MC.
Suppose there are M classes of kinetically different binding partners for the protein of interest, labeled with numbers  . For all i, define
  and
and  as the fractions of type-i bound proteins in the bleached and unbleached sections, respectively, with
 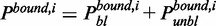 . Let
. Let  be the fraction of type-i bound proteins with respect to all bound proteins. Furthermore, denote by
  and
and  the association and dissociation rate constants corresponding to the ith MC. Then, the recovery is described by
 |
(4) |
 |
(5) |
| (6) |
| (7) |
where  . The fluorescence intensity is
  .
.
Parameter estimation
The mathematical model contains several unknowns: The model parameters  ,
,  and
and  , the initial values
  ,
,  ,
,  for the components
  ,
,  ,
,  , etc. and the fractions
  ,
,  of bleached proteins, bound proteins of type i, etc. Due to computational effort, parameter redundancies and strong correlation between some parameters, it is not meaningful to statistically infer all these unknowns simultaneously. Instead, some values were fixed as follows:
  and
and  were experimentally determined (see Supplementary Table S3, Figure 4B and the data normalization description above). The smallest
  value was set to 0.005 (see the Results section).
  was chosen equal to the first value of the FRAP curve.
  was set equal to
  . The association rates result from the other estimates as
  . Statistical inference of all remaining variables was carried out by least squares estimation. The ODEs (1)–(3) and (4)–(7) were numerically solved with the Euler scheme with step length 0.03, which corresponded to one-fifth of the observation interval. All software was written in R (R Development Core Team, 2011, R Foundation for Statistical Computing, Vienna, Austria).
We estimated the model parameters for each FRAP curve separately and compared the estimates for curves from the same cell cycle phase and Dnmt1 construct afterwards. For more details about the numerics, see the Supplementary Methods.
Model choice
In our analysis, we estimate models with different numbers of MCs. Because the models are nested, the inclusion of more MCs always leads to a better or at least equally good fit. However, one may ask whether the additional computational effort for multiple MCs is worth the improved matching of the data. At first glance, model choice criteria like the Akaike information criterion (AIC) (38) seem appropriate. In our application, however, the difference in the mean squared residuals for different models is typically small owing to parameter redundancies. Because of the large number of model parameters, the AIC will often favor less MCs although the curvature of the recovery curves is better described by more complex models. For that reason, we developed a model selection criterion that penalizes complexity less rigorously and is specific to our application. Due to the relatively small noise in the FRAP curves (Figure 3B and Supplementary Figure S6), we do not expect to overfit the data. The criterion reads as follows.
Figure 3.

Quantitative FRAP evaluation of GFP and GFP-Dnmt1 constructs. (A) Representative time frames of exemplary half-nucleus FRAP series recorded with spinning disk confocal microscopy. Scale bar: 5 µm. (B) Mean recovery curves displayed for all measured constructs and cell cycle stages. The inset illustrates cycle-dependent kinetics of GFP and GFP-Dnmt1wt alone (a), and in comparison with GFP-Dnmt1Q162E (b), GFP-Dnmt1ΔTS (c) and GFP-Dnmt1Q162E/ΔTS (d). GFP-Dnmt1wt in cells with diffuse localization shows a decreased mobility compared with GFP. The GFP-Dnmt1wt mobility decreases stepwise in early S phase and in late S phase. The mobility of GFP-Dnmt1Q162E in G1 (late G2) and early S cells (diffuse nuclear localization, pooled) is almost identical to GFP-Dnmt1wt G1 (late G2) cells. In late S phase, a moderately increased mobility is observed for both, GFP-Dnmt1Q162E and GFP-Dnmt1ΔTS mutants compared with GFP-Dnmt1wt. Of note, despite comparable overall kinetics, both curves (dark green, dark orange) are clearly different in their shape. In early S phase, the t1/2 of GFP-Dnmt1ΔTS is reduced compared to GFP-Dnmt1wt. GFP-Dnmt1Q162E/ΔTS (all interphase stages, pooled) displays kinetics almost identical to GFP-Dnmt1wt in cells with diffuse localization. For clarity, error bars are omitted here, but shown in Supplementary Figure S6. (C) Half-times of recovery (t1/2) determined for each construct and distribution pattern. Error bars represent SEM.
As explained in the Results section, the up to three MCs are further distinguished into one or two distinctive mobility classes (DMCs) and up to one catalytic mobility class (CMC). These have to fulfill three rules:
-
(1)If a DMC or CMC is present, the fraction
 of bound proteins should be above a certain threshold:

Otherwise the DMCs and CMC are discarded, and we assume no MCs for this FRAP curve.
-
(2)Two distinct MCs should differ substantially in their dissociation rates. In the model with two DMCs that means that one should have

Otherwise we assume the effective number of DMCs to be one.
-
(3)An MC only truly contributes to the model if it reaches a certain size:

Otherwise we assume the effective number of DMCs to be one.
We derive appropriate values for the above thresholds by cluster analysis; see the Supplementary Methods for details and results. For each measured curve, we now select the model that yields the best fit. This is typically the model with two DMCs and one CMC, but in many cases, the fit of the model with one DMC and one CMC is equally good and hence preferred. For the chosen model, the original number of DMCs is replaced by the effective number of DMCs as determined by the above rules (Supplementary Figure S9). Then, for each cell cycle phase and protein construct, the primarily chosen effective number of DMCs is determined. The model with the according number of DMCs is chosen for this phase and construct. Supplementary Table S3 displays the mean estimates for the selected model for all FRAP curves. These results always assume the original number of DMCs and do not further reduce it to an effective number.
RESULTS
Necessity and sufficiency of the PBD and TS domain for S phase–specific targeting of Dnmt1
Our aim was to analyze the S phase–dependent regulation of the Dnmt1-binding behavior. To that end, we investigated four GFP fusions: wild type Dnmt1 (GFP-Dnmt1wt), the full-length Dnmt1 carrying a point mutation (GFP-Dnmt1Q162E) within the PBD (6), a Dnmt1 mutant carrying a deletion of a highly conserved part of the TS domain comprising the amino acids 459–501 (GFP-Dnmt1ΔTS) and a Dnmt1 double mutant containing both mutations (GFP-Dnmt1Q162E/ΔTS) (Figure 1A). To identify different cell cycle stages, we first co-expressed GFP-Dnmt1 constructs with PCNA fused to monomeric red fluorescent protein (RFP-PCNA) in mouse C2C12 myoblast cells and acquired confocal mid sections of the living cells (Figure 1B). As previously described (6), GFP-Dnmt1wt co-localized with RFP-PCNA at RF in early S phase. Co-localization with RF was also apparent in late S phase, when DNA of pericentromeric heterochromatin (pHC) is replicated. In contrast, the double mutant GFP-Dnmt1Q162E/ΔTS was diffusely distributed within nuclei throughout interphase, suggesting a deficiency to target RF during S phase. GFP-Dnmt1ΔTS still accumulated at RF in early and late S phase, but showed a slightly weaker association compared with GFP-Dnmt1wt, indicating the activity of PBD-mediated targeting in all S phase stages, independent of the presence of the TS domain (Figure 1B and Supplementary Figure S2). As previously reported, GFP-Dnmt1Q162E showed a diffuse nuclear distribution in early S phase but notable association to pHC replicating in late S phase (6). Together, this suggests that the PBD-mediated interaction with PCNA is necessary for the Dnmt1 localization in early S phase, but evidently not for the association at pHC in late S phase.
Figure 1.

Domain structure and subnuclear localization of GFP-Dnmt1 constructs. (A) Dnmt1 consists of a large N-terminal regulatory domain containing PBD, TS domain and a CXXC zinc finger (ZnF) domain, and a conserved C-terminal catalytic domain. The point mutation of a highly conserved glutamine to glutamic acid introduced within the PBD eliminates interaction with the replication machinery (GFP-Dnmt1Q162E). A deletion in the central part of the TS domain (GFP-Dnmt1ΔTS) was introduced to abolish interaction with constitutive heterochromatin. Furthermore a construct containing both mutations was generated (GFP-Dnmt1Q162E/ΔTS). GFP alone is used as a control for a non-binding protein. (B) Spinning disk confocal mid sections of GFP-Dnmt1 wild type (wt) and mutant constructs in live mouse C2C12 cells co-expressing RFP-PCNA to mark RF. In early S phase, GFP-Dnmt1wt accumulates at RF, whereas PCNA-binding deficient GFP-Dnmt1Q162E is diffusely distributed throughout the nucleus. GFP-Dnmt1ΔTS is still associated with RF, but not as prominently as GFP-Dnmt1wt. In late S phase GFP-Dnmt1wt, GFP-Dnmt1Q162E and GFP-Dnmt1ΔTS accumulate at larger RF of late replicating pHC, although with slightly less strong enrichment observed for both mutants. GFP-Dnmt1Q162E/ΔTS is distributed diffusely in the nucleus throughout interphase. Scale bar: 5 µm.
For a more detailed view on the spatial relationships of wild-type and mutant Dnmt1 and PCNA at RF, we used super-resolution 3D-SIM (31,32). Owing to the ∼8-fold improved volumetric resolution of 3D-SIM (39), we could clearly notice subtle variations in the Dnmt1 localization that escaped detection with conventional imaging (Figure 2 and Supplementary Figure S3). In late S phase, GFP-Dnmt1wt coincides to a large extent with immunofluorescently labeled endogenous PCNA foci in locally decondensed parts of otherwise homogenously compacted chromocenters with some Dnmt1 signal extending slightly (by a few 100 nm) beyond the PCNA signal. Interestingly, RF outside of chromocenters showed almost no enrichment of Dnmt1 (Figure 2A). In contrast, early S phase cells showed a more balanced co-localization at RF (Supplementary Figure S3A). Co-immunostaining of non-transfected cells with the Dnmt1-specific monoclonal antibody 5A10 confirmed the same localization characteristics for the endogenous Dnmt1, hence excluding potential artifacts by the GFP-tagging or overexpression (Supplementary Figure S3B). As opposed to this, GFP-Dnmt1ΔTS precisely co-localized with all PCNA marked RF inside and outside of chromocenters (Figure 2B). GFP-Dnmt1Q162E, similar to the wild type, displayed an enrichment at chromocenter-associated RF but also in the nearby regions of the chromocenters that were more compacted. We further noted these regions to become larger toward the end of late S phase, indicating that TS-mediated binding primarily occurs at postreplicative pHC (Supplementary Figure S3C). Pulse replication labeling with 5-ethenyl-2’-deoxyuridine and co-staining with PCNA confirmed the association of both, wild type and the PBD mutant Dnmt1 to postreplicative pHC (Figure 2D). Hence, we conclude a strict co-localization of the ΔTS mutant with PCNA at replication sites in late S phase, whereas both TS domain-containing constructs (GFP-Dnmt1Q162E stronger than GFP-Dnmt1wt) show a non-strict co-localization and a tendency to bind adjacent postreplicative pHC.
Figure 2.

Super-resolution imaging of heterochromatin association of GFP-Dnmt1 constructs in late S phase. (A–C) 3D-SIM optical mid sections and z-projections from of C2C12 cells expressing GFP-Dnmt1 wild type and mutant constructs immunostained with antibodies against endogenous PCNA. Profile plots were scaled between minimum and maximum intensity values for each nucleus. (A) GFP-Dnmt1wt co-localizes largely but not strictly with PCNA inside ∼200 nm wide lacunas within otherwise densely packed DAPI-intense chromocenters of clustered pHC (inset a1, arrowheads in profile plot 1 and inset a3). Anti-PCNA-labeled RF outside of chromocenters show only minor or no association of Dnmt1 (inset a2, arrows in profile plot 2 and inset a3). (B) GFP-Dnmt1ΔTS strictly co-localizes with PCNA at RF inside and outside chromocenters (insets b1 + b2 and profile plots 3 + 4). An increased diffuse fraction is visible as small grainy evenly distributed nucleoplasmic background. (C) GFP-Dnmt1Q162E does not strictly co-localize with PCNA, but also associates with adjacent regions of pHC (arrowheads, inset c3 and profile plot 5). No association is detected in RF outside chromocenters (arrows, inset c3 and profile plot 6). (D) Additional replication labeling with a 60-min EdU pulse prior fixation. Association of GFP-Dnmt1wt and GFP-Dnmt1Q162E to chromocenter regions outside of PCNA foci is restricted to the bulk of EdU-labeled postreplicative chromatin (insets, arrows), while unlabeled, presumably not yet replicated chromocenter regions are still void of GFP-Dnmt1 (insets, arrowheads). Scale bars: 5 µm and 1 µm (insets).
To gain further knowledge about the cell cycle–dependent dynamics of Dnmt1, we compared FRAP kinetics of mutant proteins with those of GFP-Dnmt1wt in early S phase, late S phase and non-S phase cells with diffuse localization. The latter comprises mostly G1 cells but may also contain a smaller subset of late G2 phase cells, according to the different lengths of both stages. The comparison was done by half-nucleus FRAP analyses to quantify the strength and contribution of the PBD- and TS domain–mediated interactions in the distinct stages (Figure 3A). For a thorough quantitative evaluation of half-nucleus FRAP data, which preceded the application of the mathematical model, we developed an improved protocol for image registration, nuclear segmentation and data normalization (details described in Supplementary Methods and Supplementary Figure S4).
Initial controls revealed that the additional expression of RFP-PCNA influenced the kinetics of GFP-Dnmt1wt (Supplementary Figure S5). Hence, to avoid any biasing effects, we decided not to co-express RFP-PCNA, but instead to collectively analyze all nuclei with diffuse nuclear distribution of the respective GFP fusion protein. Control measurements of diffusely localized GFP-Dnmt1Q162E in RFP-PCNA co-expressing cells revealed no difference between the ‘early S phase’ and ‘G1/late G2’ group (data not shown). We quantitatively analyzed half-nucleus FRAP experiments of 10–20 datasets for each construct and categorized cell cycle stage(s) (Figure 3B and Supplementary Figure S6) and determined half-times of the recovery (t1/2) and mobile fractions (MF) (Supplementary Table S1)
In accordance with our previous observations (6), GFP-Dnmt1wt showed a moderately reduced mobility in early S phase (t1/2 6.3 ± 0.3 s) compared with G1/late G2 phase (t1/2 3.3 ± 0.1 s) (Figure 3B and C). In late S phase, the recovery was even more reduced (t1/2 8.3 ± 0.6 s). Recovery kinetics of the GFP-Dnmt1Q162E/ΔTS double mutant comprising all interphase stages revealed the same fast recovery kinetics (t1/2 3.6 ± 0.3 s) as observed for GFP-Dnmt1wt in G1/late G2 phase, suggesting the complete loss of any S phase–specific interaction. The result implies that the collective integrity of PBD and the TS domain is necessary and sufficient for the entire S phase–dependent targeting of Dnmt1 to its localization sites.
Next, we analyzed both single mutants, GFP-Dnmt1Q162E and GFP-Dnmt1ΔTS, to dissect the specific role of both domains in early S phase and late S phase. In agreement with our previous analyses of GFP-Dnmt1Q162E, the kinetics measured for the pooled G1/late G2 and early S phase cells showing a diffuse distribution, was almost identical to that of GFP-Dnmt1wt diffusely distributed only in G1/late G2 phase (t1/2 3.1 ± 0.2 s versus 3.3 ± 0.1 s) consistent with the loss of PCNA interaction in early S phase. In late S phase, despite localizing similar to GFP-Dnmt1wt, the kinetics was slightly faster (t1/2 5.4 ± 0.4 s), indicating a contribution of the PBD to the binding behavior of Dnmt1wt also in late S phase. However, the recovery was still slower as compared with the cells with diffuse localization, pointing toward an additional TS domain interaction. Comparing the wild-type construct with GFP-Dnmt1ΔTS, the mutant showed also faster kinetics in late S phase (t1/2 6.0 ± 0.4 s), suggesting that the TS domain together with the PBD are necessary for the wild-type kinetics in late S phase. Besides the role of the TS domain in late S phase, this mutation also enhanced the mobility in early S phase (t1/2 4.2 ± 0.3 s) in accordance with the fact that the early S phase pattern of RF association was less prominent (Figure 1B). This result indicates that the binding by the PBD domain to RF is necessary, but not sufficient for the early S phase–specific localization of Dnmt1.
We also noted that the mobile fractions (MF) of the wild-type construct within the observation time of 2 min dropped from around 100% in non-S phase to ∼98% in early and late S phase. This directs to a small immobile fraction of covalently bound Dnmt1 involved in the covalent complex formation during the enzymatic reaction (Supplementary Table S1). This observation is consistent with a rather slow speed of the enzyme reaction measured in vitro with hemimethylated substrate (40–43). A small immobile fraction (∼1%) was also noted for the Dnmt1 mutant construct.
To test the general ability as well as differences in the efficiency of the investigated regulatory Dnmt1 mutants to undergo covalent complex formation in vivo, we measured the time-dependent immobilization by FRAP on incubation with the mechanism-based inhibitor 5-aza-2’-deoxycytidine (44) (see Supplementary Methods for details on the trapping assay). In agreement with the observed small immobile fractions, all mutants became immobilized albeit with variable efficiencies, with GFP-Dnmt1wt being already fully immobilized within 30–45 min (corresponding to a trapping rate of ∼3% min−1), followed by GFP-Dnmt1Q162E, GFP-Dnmt1ΔTS and GFP-Dnmt1Q162E/ΔTS (only ∼10% h−1) (Supplementary Figure S7).
We conclude that the PBD and the TS domain are the only domains directly involved in S phase–specific targeting of Dnmt1 with respect to localization and kinetics and that both domains contribute to enhance the efficiency to initiate the catalytic reaction in vivo. To decipher the exact relationship of PBD- and TS domain–mediated binding in early and late S phase, however, a more sophisticated analysis is needed.
Kinetic modeling of half-nucleus FRAP with multiple binding classes and diffusion-coupled dynamics
We next sought to characterize the contribution of the PBD- and TS domain–mediated interactions in different stages of the cell cycle in a more precise quantitative manner. Hence, we utilized mathematical modeling to estimate the fraction of protein bound by these domains and the binding strength in the different cell cycle stages.
The choice of the model was based on several considerations. First, to take account for the heterogeneous spatial distribution of binding sites that strongly varies in different cell cycle stages. Second, to correct for diffusion-related effects. Third, to deal with multiple potentially superimposing interactions, or binding classes, respectively, including a small fraction of protein covalently bound during the catalytic reaction (Figure 4A). Such a level of complexity goes beyond the assumptions of FRAP analysis based on present reaction-diffusion models (45–48). Therefore, we decided to use a compartmental approach with size-calibrated diffusion correction, suitable for experiments with half-nucleus bleaching, which ensure representative distribution of binding sites in all cell cycle stages. Each of the two halves was then considered as a well-mixed homogeneous interaction system where proteins can bind to different binding partners (22,36).
Taking diffusion into account is especially important for assessing nuclear proteins as most of them undergo transient interactions in a diffusion-coupled behavior (18,46). This is also true for Dnmt1 (Supplementary Figure S8). To approximate the diffusion of the protein, we introduced a size-dependent correction factor (kdiff) as a measure for the exchange of free molecules between the bleached and unbleached half to approximate the diffusion of the protein as similarly performed in (37) (Figure 4A; see Materials and Methods). To estimate this exchange parameter, we performed FRAP calibration measurements of GFP monomers, dimers and tetramers, as they have known sizes and are presumably inert in cells (Figure 4B). The kdiff value corresponding to the size of GFP-Dnmt1 was extrapolated from the kdiff values experimentally determined for the other three constructs in the same cell line using an exponential regression curve (Figure 4B and Supplementary Table S2).
We noted that the normalized FRAP curves of GFP-Dnmt1 constructs, in particular those from S phase cells, typically did not reach a straight plateau after 2-min observation time. Instead, they still followed a slight incline. As outlined above, this might be attributed to a small fraction of molecules actively involved in covalent complex formation during methyl group transfer. In vitro measurements have previously demonstrated a rather slow catalytic reaction of human DNMT1 on hemimethylated DNA in the range of 1–22 min per CpG (40–43). To account for this possibility, we added a class with variable fraction size but a small fixed dissociation rate (koff). This class is referred to as CMC. As opposed to that, classes with free koff values will be referred to as DMC. The koff value for the CMC was chosen to be 0.005 s−1, which is equivalent to a mean residence time of 200 s (40). By fixing it, we avoided an additional free parameter in our fitting procedure. To further decrease the number of free parameters in our model, we also fixed the bleached fraction fbl to an experimentally determined value for each FRAP experiment (see Materials and Methods). Altogether we estimated the koff values of up to two DMCs, the fraction sizes of bound proteins (one CMC and two DMCs), and the remaining pool of free molecules (ffree).
Although this modeling approach does not cover the whole details of our experimental system, it concentrates on the characterization of the interactions while still integrating some essential information on the diffusion process and therefore provides a way to interpret the differences between the different forms of Dnmt1 during the different phases of the cell cycle. In conclusion, our compartmental model uses an experimentally determined cell type–specific correction for size-dependent diffusion effects and can extract up to three dissociation rates and the sizes of all bound pools and the remaining free pool. This way we took into account several interaction partners, diffusion-coupled dynamics and the irregular distribution of binding sites of the protein.
Quantifying the properties of the PBD- and TS domain–mediated binding by FRAP modeling
We applied the enhanced kinetic model to our FRAP data of GFP-Dnmt1wt and mutants. For each FRAP curve, the parameters of three differential equation models were determined using least squares estimation. These models accounted for (i) no DMC/CMC, i.e. free proteins only, (ii) one DMC plus CMC or (iii) two DMCs plus CMC. The kdiff values were chosen according to the respective protein sizes (Supplementary Table S2). For each individual FRAP curve, the most appropriate model was determined based on the mean squared residuals and certain restrictions on the fraction sizes and magnitudes of the dissociation rates (see Materials and Methods). Then, for each construct and cell cycle phase, we identified the model that was preferentially chosen for the majority of datasets (Supplementary Figure S9). This model was then used to determine the final mean koff values, the reciprocal mean residence times Tres= 1/ koff as well as the corresponding fraction sizes for all measured constructs and cell cycle stages (Figure 5 and Supplementary Table S3).
Figure 5.

Parameters extracted from the kinetic modeling of GFP-Dnmt1 constructs. (A) Mean residence times (Tres, upper panel) and fractions of bound molecules (fbound, lower panel) in three different classes (DMC1, DMC2, CMC) are displayed (not displayed free fractions add to 100% total amount). In all analyzed GFP-Dnmt1 constructs, a fast population of molecules was identified with mean residence times between 6 s and 10 s (DMC1). The fraction of this fast population (DMC1) typically varies between 10% and 22%, but rises for GFP-Dnmt1wt in early S phase (40%) and for GFP-Dnmt1ΔTS in early and late S phase (30 and 40%, respectively) due to the interaction with PCNA. A second, slower class (DMC2) was determined for both constructs with intact TS domain in late S phase with residence times varying from 19 to 22 s (DMC2) and an average size between 23 and 28%, respectively. The size of the CMC with a fixed Tres of 200 s varies between 0 and 4.1%. Bars indicate SEM. (B) Parameters are sorted according to their targets PCNA and pHC and the constitutively present unspecified MC (constitutive class, CC).
Model estimation for our reference FRAP measurements with GFP monomers and dimers provided a clear tendency of having no DMC (100% free fraction), whereas most FRAP curves of GFP-tetramers were best explained by a large free fraction (>91%) plus a smaller fraction of reduced mobility (<8%). Notably, the Tres determined for this fraction was rather high and showed a large variation indicating a GFP-multimer–specific effect. Analyzing the GFP-Dnmt1 constructs, we observed that a small fraction (fCMC 1–4%) was always assigned to the class of molecules potentially involved in the catalytic process (CMC). Estimation of the size of the CMC is numerically difficult owing to the small fraction size. We hence do not interpret those estimates here.
For GFP-Dnmt1wt expressing cells in G1/late G2, our model likewise estimated a large free fraction of ∼80% and a population of ∼19% with a relatively low mean residence time (Tres ∼8 s). In early S phase, the bound fraction doubled to ∼40% owing to binding to immobilized PCNA trimeric rings at replication forks (6, 49). The mean residence time measured for this class was with Tres ∼10 s slightly higher. The largest fraction of 56% was still assigned to the free pool. In late S phase cells, the bound fraction remained in a similar range with 48%. Importantly, concomitant with binding to pHC at chromocenters, the model identified two distinct DMCs: 18% of the proteins were still bound with an intermediate strength (DMC1: Tres ∼10 s), and an additional 28% with a substantially higher strength (DMC2: Tres ∼22 s).
An 18–22% fraction with consistent kinetics was constitutively present in all cell cycle stages of the investigated GFP-Dnmt1 constructs. The nature of this constitutive MC remains unclear. In addition to the mutants described here, we performed FRAP analyses of a series of mutant constructs with deletions of potential interacting regions within the regulatory domain of Dnmt1, which included N-terminal truncations of various length (data not shown) and deletion within the ZnF domain (50). None of these mutants showed faster kinetics than GFP-Dnmt1wt in diffuse cells. We therefore attribute this constitutive class to an anomalous diffusive behavior (see discussion) and not to particular DNA/chromatin binding mediated by a specific domain.
The modeling of FRAP data of the GFP-Dnmt1Q162E mutant revealed a modest reduction of the DMC1 fraction size as compared with the level of GFP-Dnmt1wt in all measured phases (diffuse, late S) (DMC1: 10–14%; Tres ∼9 s). In late S phase cells, a second slower DMC with similar strength was still retained (DMC2: 23%; Tres ∼19 s). From these results, we conclude that Dnmt1 binds PCNA at replication sites of early S phase cells with a mean residence time of ∼10 s and with no more than 20–25% of the nuclear Dnmt1 pool being involved in this reaction. The binding of the Dnmt1 constructs with intact PBD to PCNA, as well as complete loss of the interaction by introduction of the Q162E point mutation was confirmed biochemically by co-immunoprecipitation (Supplementary Figure S10). In late S phase, only a minor decrease in the mean residence times of the first and second DMC was observable for GFP-Dnmt1Q162E as compared with the wild type, indicating that the PBD does contribute, if only to a small extent, to the binding strength in late S phase. However, the overall bound fraction of molecules decreased compared with GFP-Dnmt1wt in late S phase (66% versus 52%) causing an overall faster FRAP kinetics. The double mutant GFP-Dnmt1Q162E/ΔTS did not establish any association pattern throughout interphase. In accordance, the extracted kinetic properties were almost identical to those of GFP-Dnmt1wt in G1/late G2 (19%; Tres ∼8 s).
Modeling of GFP-Dnmt1ΔTS in early S phase revealed a modest reduction of the fraction size and binding strength (DMC1: 30%; Tres ∼8.5 s compared with 39%; Tres ∼10 s in the wild type). This could argue for either a stabilization of the PCNA complex at the replication sites by the TS domain or may hint to the presence of a minor fraction of strong binding sites, which is too small to be identified as a distinct class. In late S phase, still only one DMC was identified for GFP-Dnmt1ΔTS (DMC1: 40%, Tres ∼9 s), similar to GFP-Dnmt1wt in early S phase. This suggests a prevalence of TS domain–mediated binding over PBD mediated, provided that the conditions for TS binding are complied (i.e. high density of hemimethylated CpG sites in conjunction with heterochromatic marks; see discussion below). In this case, binding to PCNA does only seem to play a supportive role. This view is also in accordance with the finding that in late S phase, the Q162E mutation alone does not change the DMC1 or DMC2 substantially, but only leads to a moderate increase in free protein.
DISCUSSION
We addressed the complex problem of dissecting the cell cycle–dependent regulation of Dnmt1 by super-resolution 3D imaging, FRAP and kinetic modeling. Two main factors add to the complexity of the analysis. First, Dnmt1 is a large enzyme with multiple regulatory subdomains, interaction partners and cell cycle–dependent regulation. Second, the distribution pattern of Dnmt1 is highly variable throughout the cell cycle. Hence, we chose a global approach using half-nucleus FRAP to capture in all cases representative fractions of bound molecules and binding sites. Previous studies often used spot bleaching with a defined geometry that allowed the extraction of diffusion coefficients (24,51,52). However, such models typically only included no more than one additional binding class, while we expected multiple interactions. Therefore, none of the previous models was immediately applicable to our case, which prompted us to devise a customized model.
To eliminate a weak point of diffusion-uncoupled approaches, we further corrected for size-dependent diffusion using a calibration factor that was experimentally determined from measurements of GFP multimer proteins. Anomalous diffusion behavior has previously been shown for GFP and dextran in the nucleus (53–55). This indicates that calculation of size-dependent diffusion differences according to the Stokes-Einstein relation might lead to wrong parameter estimates for proteins in the nucleus (56), especially when large size differences like between GFP and Dnmt1 are taken into account.
FRAP measurements are sensitive to experimental conditions and set-ups (57). We tried to correct for most conceivable external influences during image evaluation by using a tailored workflow of postprocessing steps (see Supplementary Materials and Methods). This involved image registration, constrained automated nuclear segmentation and three-step normalization/correction. Altogether, this allows us to compensate for lateral cell movement, nuclear import and export, bleaching due to image acquisition and variations in bleaching depth, which otherwise potentially affect the raw data and subsequent modeling results. Moreover, we modeled a slow CMC using a low fixed koff value, taking into account that a small fraction of molecules is likely to be involved in catalysis and thereby transiently immobilized by a covalent complex formation (40,43). Finally, we also reduced the number of free parameters by fixing the size of the bleached fraction to a value experimentally determined for each FRAP series. The number of DMCs was determined by model choice rules, which are oriented toward the numerical properties of the model.
Although our model allows for three distinct MC, we possibly cannot estimate their number and properties beyond all doubt, mostly because two or more distinct interactions may fall into one MC (see Materials and Methods). If interaction strengths of multiple interactions are relatively close to each other, they may not be detected as separate classes but be captured as one with an intermediate mixed koff. The appearance of such parameter redundancies depends on the model and the values of the underlying parameters (e.g. 58). However, different dynamics can still be distinguished indirectly by a changed fraction size. An example for mixed interactions in one class is the similar kinetics of the non-specified constitutive class and of GFP-Dnmt1wt binding to PCNA. This rather small constitutive fraction may be attributed to one or more residual transient interactions. So far, we could not detect any specific subdomain of Dnmt1 that would be responsible for a transient interaction throughout the cell cycle (data not shown). Thus, we tend to attribute this to an anomalous diffusive behavior within the nucleus that is identified as a pseudo-binding class. This may be caused by restrained accessibility of dense chromatin domains and transient trapping inside of small chromatin lacunas (‘corralling’) generating a ‘pseudo’ binding effect and/or by unspecific transient binding with a broad distribution of binding affinities (53,54,59). Dnmt1 could also be constitutively present in a free diffusing complex including interacting proteins like PCNA or Uhrf1. In fact, Dnmt1 interactions have been described for a variety of proteins including other DNA methyltransferases, chromatin modifiers and transcriptional regulators (60). Interactions with high molecular weight complexes could potentially slow down diffusion of GFP-Dnmt1 and thus contribute to the observed dynamics.
Another limitation of our method is the precision limit imposed by a still large cell-to-cell variability due to (i) technical reasons like residual uncorrected cell motion or z-drift, irradiation/transfection-induced DNA damage or cell cycle arrest or (ii) biological reasons such as variations in endogenous expression and methylation levels or local environment. Therefore, for example, the quantification of the apparently small CMC gives no robust results. However, by estimating the kinetic parameters for each FRAP curve separately, we take into account this extrinsic noise and quantify it through standard errors. Finally, using experimental FRAP data, it can never be ruled out that the kinetics are influenced by variations in kon rates. However, the method does not allow assessing changes in the accessibility of the binding sites. These technical limitations could only be solved using large-scale simulations and even more complex models.
Despite these potential shortcomings, by application of our method, one can still obtain a detailed picture of the distinct cell cycle–dependent dynamics of proteins. We have shown that the PBD and the TS domain are the only domains involved in direct S phase-dependent targeting of Dnmt1 and responsible for delaying its mobility. Furthermore, we discriminated two different MCs that could be matched to these two different domains of Dnmt1. In this study, we quantified the time they bind on average and found the binding via the TS domain to be >2-fold stronger than via the PBD, whereas the corresponding fractions of bound protein were in a similar size range between 20 and 30%.
In accordance with previous studies, we show that the more transient interaction with PCNA increases the concentration of Dnmt1 at replication sites to enhance the efficiency of maintenance DNA methylation (7). In addition, we have characterized the stronger binding properties of the TS domain. The related MC was only present in late S phase, when pericentric heterochromatin (pHC) clustered in DAPI dense chromocenters is replicated, suggesting a switch between PBD-mediated binding in early S phase to the TS domain–mediated binding in late S phase. The analysis of the single mutants, however, hinted at a somewhat more complex situation, as the deletion within the TS domain also influenced GFP-Dnmt1 kinetics in early S phase and the mutation in the PBD influenced the GFP-Dnmt1 localization in late S phase. This rather argues for a more subtle continuous change in binding balance instead of a simple on/off switching. Hence, association via the TS domain might occur also in early S phase, but at much lower abundance. Indeed a substantial minority (8/21) of early S phase cells could be better fitted with two respective distinct MCs, indicating some cell-to-cell variability, possibly in transition to mid S phase. On the other hand, PBD-mediated co-localization with PCNA is also observed in late S phase. However, as the fraction size with the respective faster off-rate is reduced to non-S phase level, this Dnmt1 fraction may be handed over to form a late S phase–specific, more stable complex, such that the TS domain–specific off-rate becomes predominant. In this stage, PCNA binding would thus be an auxiliary factor for TS-mediated binding of a Dnmt1 subfraction. Besides, supported by super-resolution microscopy, we provide evidence for additional PCNA/PBD-independent binding to pHC. The latter seems to be dependent not only on the heterochromatic context alone, but also on the presence of hemimethylated postreplicative DNA as precondition. Accordingly we did not observe any pHC association in early S phase. It is tempting to speculate that the observed kinetics reflect the binding of the TS domain to Uhrf1, an essential epigenetic factor that has previously been shown to target Dnmt1 to hemimethylated CpG sites and to bind trimethylated H3K9 (13–17). However, we cannot rule out other/additional modes of binding of the TS domain to pHC. In support of a role of Uhrf1 as a docking platform for Dnmt1, a previous FRAP study demonstrated a much slower recovery of GFP-Uhrf1 compared to GFP-Dnmt1wt in mouse embryonic stem cells (61).
In light of our data we propose a conceptual two-loading-platform model (outlined in Figure 6). According to this, the kinetic balance would shift from predominant PCNA/PBD binding in early S phase, toward TS-mediated binding in later S phase stages when replicating densely methylated heterochromatic sequences. This shift would be triggered by the strongly increased appearance of hemimethylated CpG sites in conjunction with heterochromatic marks (e.g., H3K9me3). These would then offer the target for the formation of a stable complex (involving e.g. Uhrf1) that acts as a second Dnmt1 loading platform on postreplicative chromatin sites. PCNA-independent loading complexes may persist also beyond S phase, until all hemimethylated Dnmt1 target sites are fully methylated, which in turn triggers complex disassembly and gradual loss of TS-mediated binding in G2 phase. Such a mechanism would thus safeguard faithful maintenance of dense methylation at constitutive heterochromatin important for genome stability (3), against the backdrop of a rather slow and inefficient catalytic reaction (40).
Figure 6.

Two-loading-platform-model for the cell cycle–dependent targeting of Dnmt1 to RF and pHC. Schematic representation not drawn to scale. Closed and open lollipops indicate methylated and non-methylated CpG sites, respectively; flags indicate heterochromatin specific marker (e.g. H3K9me3). Dnmt1 is depicted in green. The model postulates two auxiliary factors that act as immobilizing platforms under certain conditions: PCNA (red) that assembles as trimeric ring at the replication fork throughout S phase, and a second unspecified factor (e.g. Uhrf1, blue) that binds strongly to hemimethylated postreplicative heterochromatin. Independent of replication, most Dnmt1 molecules (∼80% in G1, >50% in S phase) are freely roaming the nucleoplasm (left column). In addition, a non-specified MC with a pseudo koff,1 is constitutively present throughout interphase, which may be attributed to either non-specific binding to chromatin or transient trapping (‘corralling’) of the large enzyme in the nucleoplasmic environment. When replicating euchromatic sequences in early S phase (upper row) an additional ∼20% fraction of the Dnmt1 pool transiently binds via the PBD to immobilized PCNA rings (red donut) with a mean residence time (1/koff,1) of ∼10 s (1). Targeting to PCNA at RF enhances the efficiency of a small fraction of Dnmt1 to form metastable covalent complexes (koff,1) with hemimethylated CpG substrate sites in close vicinity. This may occur on already assembled nucleosomes, likely involving complex formation with one or several auxiliary factors (2 a), or directly on the naked DNA substrate adjacent to PCNA (2 b) or to nucleosomes (2 c). In late S phase, replication through chromatin with now abundant heterochromatic marks in conjunction with dense CpG methylation triggers the generation of high-affinity binding sites for an auxiliary protein. These may then act as second loading platform (dark blue pentagons) for TS-mediated binding with mean residence time (1 / koff,2) of ∼22 s involving ∼25% of the Dnmt1 pool. Formation of this transient complex with subsequent substrate binding of a small subset of molecules occurs either directly at the replication fork promoted by PBD-mediated targeting, or PCNA independently at already displaced postreplicative heterochromatin chromatin that may have escaped loading in the first instance (3). This second PCNA-independent loading complex may be assembled well into G2 phase, until all hemimethylated Dnmt1 target sites are fully methylated, which finally triggers disassembly of the loading complex and dissociation of Dnmt1 (4). Of note, this conceptual model is based on the differential availability of binding sites and the free interplay of forces. While higher affinity binding sites are occasionally generated also in early S phase, they may be too sparse to constitute a separate MC.
While we favor a model of free interplay of forces in conjunction with a cell cycle dependent varying abundance of high affinity binding sites, we cannot rule out an effect by an induced conformational change of the Dnmt1 protein to expose the TS domain at the onset of late S phase. In this context, several modifications have been reported like acetylation, ubiquitination, phosphorylation, methylation and sumoylation, resulting in a change in activity and/or abundance of Dnmt1 (60,62–64). For example, it has been shown that Uhrf1 ubiquitinates Dnmt1 at the C-terminal part of the TS domain (33). Further studies will have to address the exact interplay of Uhrf1 and Dnmt1 as a function of variable (hemi)methylation density and the role of posttranslational modifications of Dnmt1.
In the present study, we have reached substantial improvements on the experimental conditions and workflow for the quantitative and qualitative evaluation of half-nucleus FRAP experiments. Still, extracting definite answers from modeling of such FRAP data remains difficult and to some extent limited. Of note, our analysis involved multiple decisions on the data normalization, fixation of parameters, model choice, etc. Although all steps have been carried out with greatest care, this deterministic approach will still fall to some extent short. New stochastic modeling approaches may be able to realistically take into account random events and may hence better explain intrinsic variability of the FRAP curves. Nonetheless, this article provides a framework for the global assessment and quantitative measurement of diffusion-coupled nuclear protein dynamics with heterogeneous and variable distribution of binding sites, e.g. during cell cycle and development.
Our approach provided new insights into the complex cell cycle dependent regulation of the multi-domain protein Dnmt1 in the epigenetic network. We arrived at a probabilistic two-loading-platform model that provides a possible explanation how PBD and TS domain act cooperatively to faithfully maintain genomic methylation patterns through cell cycle and cell divisions. Further studies will address the mechanistic nature of the complex formation involving the TS domain and the targeting of Dnmt1 to hemimethylated sites.
SUPPLEMENTARY DATA
Supplementary Data are available at NAR Online: Supplementary Tables 1–3, Supplementary Figures 1–10, Supplementary Methods and Supplementary References [65–68].
FUNDING
Deutsche Forschungsgemeinschaft [DFG SFB TR5 and SFB 684 to H.L and L.S.]; Nanosystems Initiative Munich [NIM to H.L.]; Bundesministerium für Bildung und Forschung (BMBF) Episys program [to H.L.]. K.S. was supported by the International Doctorate Program NanoBioTechnology (IDK-NBT) and the International Max Planck Research School for Molecular and Cellular Life Sciences (IMPRS-LS). P.W. is a fellow of the Graduate School Life Science Munich (LSM). CF was supported by the European Union within the European Research Council (ERC) grant LatentCauses. Funding for open access charge: Deutsche Forschungsgemeinschaft [SFB TR5 to L.S.].
Conflict of interest statement. None declared.
Supplementary Material
ACKNOWLEDGMENTS
We thank Joachim Hermisson and Julia Sommer for helpful discussions. We are grateful to Florian Rieß, Susanne Giehler, Andreas Maiser, Anna Ullraum, Carina Frauer and Thomas Pyttel for technical help. We further thank Nikola Müller and Garwin Pichler for critical comments on the manuscript.
REFERENCES
- 1.Reik W. Stability and flexibility of epigenetic gene regulation in mammalian development. Nature. 2007;447:425–432. doi: 10.1038/nature05918. [DOI] [PubMed] [Google Scholar]
- 2.Bird A. DNA methylation patterns and epigenetic memory. Genes Dev. 2002;16:6–21. doi: 10.1101/gad.947102. [DOI] [PubMed] [Google Scholar]
- 3.Gaudet F, Hodgson JG, Eden A, Jackson-Grusby L, Dausman J, Gray JW, Leonhardt H, Jaenisch R. Induction of tumors in mice by genomic hypomethylation. Science. 2003;300:489–492. doi: 10.1126/science.1083558. [DOI] [PubMed] [Google Scholar]
- 4.Bestor TH. The DNA methyltransferases of mammals. Hum. Mol. Genet. 2000;9:2395–2402. doi: 10.1093/hmg/9.16.2395. [DOI] [PubMed] [Google Scholar]
- 5.Prokhortchouk E, Defossez PA. The cell biology of DNA methylation in mammals. Biochim. Biophys. Acta. 2008;1783:2167–2173. doi: 10.1016/j.bbamcr.2008.07.015. [DOI] [PubMed] [Google Scholar]
- 6.Schermelleh L, Haemmer A, Spada F, Rosing N, Meilinger D, Rothbauer U, Cardoso MC, Leonhardt H. Dynamics of Dnmt1 interaction with the replication machinery and its role in postreplicative maintenance of DNA methylation. Nucleic Acids Res. 2007;35:4301–4312. doi: 10.1093/nar/gkm432. [DOI] [PMC free article] [PubMed] [Google Scholar]
- 7.Spada F, Haemmer A, Kuch D, Rothbauer U, Schermelleh L, Kremmer E, Carell T, Langst G, Leonhardt H. DNMT1 but not its interaction with the replication machinery is required for maintenance of DNA methylation in human cells. J. Cell Biol. 2007;176:565–571. doi: 10.1083/jcb.200610062. [DOI] [PMC free article] [PubMed] [Google Scholar]
- 8.Chuang LS, Ian HI, Koh TW, Ng HH, Xu G, Li BF. Human DNA-(Cytosine-5) Methyltransferase-PCNA Complex as a Target for p21WAF1. Science. 1997;277:1996–2000. doi: 10.1126/science.277.5334.1996. [DOI] [PubMed] [Google Scholar]
- 9.Moldovan GL, Pfander B, Jentsch S. PCNA, the maestro of the replication fork. Cell. 2007;129:665–679. doi: 10.1016/j.cell.2007.05.003. [DOI] [PubMed] [Google Scholar]
- 10.Leonhardt H, Page AW, Weier HU, Bestor TH. A targeting sequence directs DNA methyltransferase to sites of DNA replication in mammalian nuclei. Cell. 1992;71:865–873. doi: 10.1016/0092-8674(92)90561-p. [DOI] [PubMed] [Google Scholar]
- 11.Easwaran HP, Schermelleh L, Leonhardt H, Cardoso MC. Replication-independent chromatin loading of Dnmt1 during G2 and M phases. EMBO Rep. 2004;5:1181–1186. doi: 10.1038/sj.embor.7400295. [DOI] [PMC free article] [PubMed] [Google Scholar]
- 12.Frauer C, Leonhardt H. Twists and turns of DNA methylation. Proc. Natl Acad. Sci. USA. 2011;108:8919–8920. doi: 10.1073/pnas.1105804108. [DOI] [PMC free article] [PubMed] [Google Scholar]
- 13.Sharif J, Muto M, Takebayashi S, Suetake I, Iwamatsu A, Endo TA, Shinga J, Mizutani-Koseki Y, Toyoda T, Okamura K, et al. The SRA protein Np95 mediates epigenetic inheritance by recruiting Dnmt1 to methylated DNA. Nature. 2007;450:908–912. doi: 10.1038/nature06397. [DOI] [PubMed] [Google Scholar]
- 14.Arita K, Ariyoshi M, Tochio H, Nakamura Y, Shirakawa M. Recognition of hemi-methylated DNA by the SRA protein UHRF1 by a base-flipping mechanism. Nature. 2008;455:818–821. doi: 10.1038/nature07249. [DOI] [PubMed] [Google Scholar]
- 15.Avvakumov GV, Walker JR, Xue S, Li Y, Duan S, Bronner C, Arrowsmith CH, Dhe-Paganon S. Structural basis for recognition of hemi-methylated DNA by the SRA domain of human UHRF1. Nature. 2008;455:822–825. doi: 10.1038/nature07273. [DOI] [PubMed] [Google Scholar]
- 16.Hashimoto H, Horton JR, Zhang X, Bostick M, Jacobsen SE, Cheng X. The SRA domain of UHRF1 flips 5-methylcytosine out of the DNA helix. Nature. 2008;455:826–829. doi: 10.1038/nature07280. [DOI] [PMC free article] [PubMed] [Google Scholar]
- 17.Bostick M, Kim JK, Esteve PO, Clark A, Pradhan S, Jacobsen SE. UHRF1 plays a role in maintaining DNA methylation in mammalian cells. Science. 2007;317:1760–1764. doi: 10.1126/science.1147939. [DOI] [PubMed] [Google Scholar]
- 18.Sprague BL, McNally JG. FRAP analysis of binding: proper and fitting. Trends Cell Biol. 2005;15:84–91. doi: 10.1016/j.tcb.2004.12.001. [DOI] [PubMed] [Google Scholar]
- 19.Reits EA, Neefjes JJ. From fixed to FRAP: measuring protein mobility and activity in living cells. Nat. Cell Biol. 2001;3:E145–E147. doi: 10.1038/35078615. [DOI] [PubMed] [Google Scholar]
- 20.Phair RD, Misteli T. Kinetic modelling approaches to in vivo imaging. Nat. Rev. Mol. Cell Biol. 2001;2:898–907. doi: 10.1038/35103000. [DOI] [PubMed] [Google Scholar]
- 21.Lippincott-Schwartz J, Patterson GH. Development and use of fluorescent protein markers in living cells. Science. 2003;300:87–91. doi: 10.1126/science.1082520. [DOI] [PubMed] [Google Scholar]
- 22.Phair RD, Scaffidi P, Elbi C, Vecerova J, Dey A, Ozato K, Brown DT, Hager G, Bustin M, Misteli T. Global nature of dynamic protein-chromatin interactions in vivo: three-dimensional genome scanning and dynamic interaction networks of chromatin proteins. Mol. Cell Biol. 2004;24:6393–6402. doi: 10.1128/MCB.24.14.6393-6402.2004. [DOI] [PMC free article] [PubMed] [Google Scholar]
- 23.Axelrod D, Koppel DE, Schlessinger J, Elson E, Webb WW. Mobility measurement by analysis of fluorescence photobleaching recovery kinetics. Biophys. J. 1976;16:1055–1069. doi: 10.1016/S0006-3495(76)85755-4. [DOI] [PMC free article] [PubMed] [Google Scholar]
- 24.Stasevich TJ, Mueller F, Brown DT, McNally JG. Dissecting the binding mechanism of the linker histone in live cells: an integrated FRAP analysis. EMBO J. 2010;29:1225–1234. doi: 10.1038/emboj.2010.24. [DOI] [PMC free article] [PubMed] [Google Scholar]
- 25.Houtsmuller AB, Vermeulen W. Macromolecular dynamics in living cell nuclei revealed by fluorescence redistribution after photobleaching. Histochem. Cell Biol. 2001;115:13–21. doi: 10.1007/s004180000234. [DOI] [PubMed] [Google Scholar]
- 26.Dundr M, Misteli T. Functional architecture in the cell nucleus. Biochem. J. 2001;356:297–310. doi: 10.1042/0264-6021:3560297. [DOI] [PMC free article] [PubMed] [Google Scholar]
- 27.Cardoso MC, Schneider K, Martin RM, Leonhardt H. Structure, function and dynamics of nuclear subcompartments. Curr. Opin. Cell Biol. 2012;24:79–85. doi: 10.1016/j.ceb.2011.12.009. [DOI] [PubMed] [Google Scholar]
- 28.Gorski SA, Dundr M, Misteli T. The road much traveled: trafficking in the cell nucleus. Curr. Opin. Cell Biol. 2006;18:284–290. doi: 10.1016/j.ceb.2006.03.002. [DOI] [PubMed] [Google Scholar]
- 29.Misteli T. Protein dynamics: implications for nuclear architecture and gene expression. Science. 2001;291:843–847. doi: 10.1126/science.291.5505.843. [DOI] [PubMed] [Google Scholar]
- 30.Meshorer E, Misteli T. Chromatin in pluripotent embryonic stem cells and differentiation. Nat. Rev. Mol. Cell Biol. 2006;7:540–546. doi: 10.1038/nrm1938. [DOI] [PubMed] [Google Scholar]
- 31.Schermelleh L, Carlton PM, Haase S, Shao L, Winoto L, Kner P, Burke B, Cardoso MC, Agard DA, Gustafsson MG, et al. Subdiffraction multicolor imaging of the nuclear periphery with 3D structured illumination microscopy. Science. 2008;320:1332–1336. doi: 10.1126/science.1156947. [DOI] [PMC free article] [PubMed] [Google Scholar]
- 32.Gustafsson MG, Shao L, Carlton PM, Wang CJ, Golubovskaya IN, Cande WZ, Agard DA, Sedat JW. Three-dimensional resolution doubling in wide-field fluorescence microscopy by structured illumination. Biophys. J. 2008;94:4957–4970. doi: 10.1529/biophysj.107.120345. [DOI] [PMC free article] [PubMed] [Google Scholar]
- 33.Qin W, Leonhardt H, Spada F. Usp7 and Uhrf1 control ubiquitination and stability of the maintenance DNA methyltransferase Dnmt1. J. Cell Biochem. 2011;112:439–444. doi: 10.1002/jcb.22998. [DOI] [PubMed] [Google Scholar]
- 34.Seibel NM, Eljouni J, Nalaskowski MM, Hampe W. Nuclear localization of enhanced green fluorescent protein homomultimers. Anal. Biochem. 2007;368:95–99. doi: 10.1016/j.ab.2007.05.025. [DOI] [PubMed] [Google Scholar]
- 35.Rottach A, Kremmer E, Nowak D, Boisguerin P, Volkmer R, Cardoso MC, Leonhardt H, Rothbauer U. Generation and characterization of a rat monoclonal antibody specific for PCNA. Hybridoma. 2008;27:91–98. doi: 10.1089/hyb.2007.0555. [DOI] [PubMed] [Google Scholar]
- 36.Phair RD, Gorski SA, Misteli T. Measurement of dynamic protein binding to chromatin in vivo, using photobleaching microscopy. Methods Enzymol. 2004;375:393–414. doi: 10.1016/s0076-6879(03)75025-3. [DOI] [PubMed] [Google Scholar]
- 37.Carrero G, Crawford E, Hendzel MJ, de Vries G. Characterizing fluorescence recovery curves for nuclear proteins undergoing binding events. Bull. Math. Biol. 2004;66:1515–1545. doi: 10.1016/j.bulm.2004.02.005. [DOI] [PubMed] [Google Scholar]
- 38.Akaike H. Information theory and an extension of the maximum likelihood principle. In: Petrov BN, Csaki F, editors. 2nd International Symposium on Information Theory. Budapest: Akademiai Kiado; 1973. pp. 267–281. [Google Scholar]
- 39.Schermelleh L, Heintzmann R, Leonhardt H. A guide to super-resolution fluorescence microscopy. J. Cell Biol. 2010;190:165–175. doi: 10.1083/jcb.201002018. [DOI] [PMC free article] [PubMed] [Google Scholar]
- 40.Song J, Rechkoblit O, Bestor TH, Patel DJ. Structure of DNMT1-DNA complex reveals a role for autoinhibition in maintenance DNA methylation. Science. 2011;331:1036–1040. doi: 10.1126/science.1195380. [DOI] [PMC free article] [PubMed] [Google Scholar]
- 41.Bacolla A, Pradhan S, Roberts RJ, Wells RD. Recombinant human DNA (cytosine-5) methyltransferase. II. Steady-state kinetics reveal allosteric activation by methylated dna. J. Biol. Chem. 1999;274:33011–33019. doi: 10.1074/jbc.274.46.33011. [DOI] [PubMed] [Google Scholar]
- 42.Wood RJ, McKelvie JC, Maynard-Smith MD, Roach PL. A real-time assay for CpG-specific cytosine-C5 methyltransferase activity. Nucleic Acids Res. 2010;38:e107. doi: 10.1093/nar/gkq047. [DOI] [PMC free article] [PubMed] [Google Scholar]
- 43.Pradhan S, Bacolla A, Wells RD, Roberts RJ. Recombinant human DNA (cytosine-5) methyltransferase. I. Expression, purification, and comparison of de novo and maintenance methylation. J. Biol. Chem. 1999;274:33002–33010. doi: 10.1074/jbc.274.46.33002. [DOI] [PubMed] [Google Scholar]
- 44.Schermelleh L, Spada F, Easwaran HP, Zolghadr K, Margot JB, Cardoso MC, Leonhardt H. Trapped in action: direct visualization of DNA methyltransferase activity in living cells. Nat. Methods. 2005;2:751–756. doi: 10.1038/nmeth794. [DOI] [PubMed] [Google Scholar]
- 45.Braga J, McNally JG, Carmo-Fonseca M. A reaction-diffusion model to study RNA motion by quantitative fluorescence recovery after photobleaching. Biophys. J. 2007;92:2694–2703. doi: 10.1529/biophysj.106.096693. [DOI] [PMC free article] [PubMed] [Google Scholar]
- 46.Beaudouin J, Mora-Bermudez F, Klee T, Daigle N, Ellenberg J. Dissecting the contribution of diffusion and interactions to the mobility of nuclear proteins. Biophys. J. 2006;90:1878–1894. doi: 10.1529/biophysj.105.071241. [DOI] [PMC free article] [PubMed] [Google Scholar]
- 47.Sprague BL, Pego RL, Stavreva DA, McNally JG. Analysis of binding reactions by fluorescence recovery after photobleaching. Biophys. J. 2004;86:3473–3495. doi: 10.1529/biophysj.103.026765. [DOI] [PMC free article] [PubMed] [Google Scholar]
- 48.Mai J, Trump S, Ali R, Schiltz RL, Hager G, Hanke T, Lehmann I, Attinger S. Are assumptions about the model type necessary in reaction-diffusion modeling? A FRAP application. Biophys. J. 2011;100:1178–1188. doi: 10.1016/j.bpj.2011.01.041. [DOI] [PMC free article] [PubMed] [Google Scholar]
- 49.Sporbert A, Domaing P, Leonhardt H, Cardoso MC. PCNA acts as a stationary loading platform for transiently interacting Okazaki fragment maturation proteins. Nucleic Acids Res. 2005;33:3521–3528. doi: 10.1093/nar/gki665. [DOI] [PMC free article] [PubMed] [Google Scholar]
- 50.Frauer C, Rottach A, Meilinger D, Bultmann S, Fellinger K, Hasenoder S, Wang M, Qin W, Soding J, Spada F, et al. Different binding properties and function of CXXC zinc finger domains in Dnmt1 and Tet1. PLoS One. 2011;6:e16627. doi: 10.1371/journal.pone.0016627. [DOI] [PMC free article] [PubMed] [Google Scholar]
- 51.Erdel F, Schubert T, Marth C, Langst G, Rippe K. Human ISWI chromatin-remodeling complexes sample nucleosomes via transient binding reactions and become immobilized at active sites. Proc. Natl Acad. Sci. USA. 2010;107:19873–19878. doi: 10.1073/pnas.1003438107. [DOI] [PMC free article] [PubMed] [Google Scholar]
- 52.Xouri G, Squire A, Dimaki M, Geverts B, Verveer PJ, Taraviras S, Nishitani H, Houtsmuller AB, Bastiaens PI, Lygerou Z. Cdt1 associates dynamically with chromatin throughout G1 and recruits Geminin onto chromatin. EMBO J. 2007;26:1303–1314. doi: 10.1038/sj.emboj.7601597. [DOI] [PMC free article] [PubMed] [Google Scholar]
- 53.Wachsmuth M, Waldeck W, Langowski J. Anomalous diffusion of fluorescent probes inside living cell nuclei investigated by spatially-resolved fluorescence correlation spectroscopy. J. Mol. Biol. 2000;298:677–689. doi: 10.1006/jmbi.2000.3692. [DOI] [PubMed] [Google Scholar]
- 54.Bancaud A, Huet S, Daigle N, Mozziconacci J, Beaudouin J, Ellenberg J. Molecular crowding affects diffusion and binding of nuclear proteins in heterochromatin and reveals the fractal organization of chromatin. EMBO J. 2009;28:3785–3798. doi: 10.1038/emboj.2009.340. [DOI] [PMC free article] [PubMed] [Google Scholar]
- 55.Banks DS, Fradin C. Anomalous diffusion of proteins due to molecular crowding. Biophys. J. 2005;89:2960–2971. doi: 10.1529/biophysj.104.051078. [DOI] [PMC free article] [PubMed] [Google Scholar]
- 56.Dross N, Spriet C, Zwerger M, Muller G, Waldeck W, Langowski J. Mapping eGFP oligomer mobility in living cell nuclei. PLoS One. 2009;4:e5041. doi: 10.1371/journal.pone.0005041. [DOI] [PMC free article] [PubMed] [Google Scholar]
- 57.Trembecka DO, Kuzak M, Dobrucki JW. Conditions for using FRAP as a quantitative technique—influence of the bleaching protocol. Cytometry A. 2010;77:366–370. doi: 10.1002/cyto.a.20866. [DOI] [PubMed] [Google Scholar]
- 58.Seber GAF, Wild CJ. Nonlinear Regression. New York: John Wiley; 1989. [Google Scholar]
- 59.Weiss M, Elsner M, Kartberg F, Nilsson T. Anomalous subdiffusion is a measure for cytoplasmic crowding in living cells. Biophys. J. 2004;87:3518–3524. doi: 10.1529/biophysj.104.044263. [DOI] [PMC free article] [PubMed] [Google Scholar]
- 60.Qin W, Leonhardt H, Pichler G. Regulation of DNA methyltransferase 1 by interactions and modifications. Nucleus. 2011;2:392–402. doi: 10.4161/nucl.2.5.17928. [DOI] [PubMed] [Google Scholar]
- 61.Rottach A, Frauer C, Pichler G, Bonapace IM, Spada F, Leonhardt H. The multi-domain protein Np95 connects DNA methylation and histone modification. Nucleic Acids Res. 2010;38:1796–1804. doi: 10.1093/nar/gkp1152. [DOI] [PMC free article] [PubMed] [Google Scholar]
- 62.Lee B, Muller MT. SUMOylation enhances DNA methyltransferase 1 activity. Biochem. J. 2009;421:449–461. doi: 10.1042/BJ20090142. [DOI] [PubMed] [Google Scholar]
- 63.Esteve PO, Chang Y, Samaranayake M, Upadhyay AK, Horton JR, Feehery GR, Cheng X, Pradhan S. A methylation and phosphorylation switch between an adjacent lysine and serine determines human DNMT1 stability. Nat. Struct. Mol. Biol. 2011;18:42–48. doi: 10.1038/nsmb.1939. [DOI] [PMC free article] [PubMed] [Google Scholar]
- 64.Du Z, Song J, Wang Y, Zhao Y, Guda K, Yang S, Kao HY, Xu Y, Willis J, Markowitz SD, et al. DNMT1 stability is regulated by proteins coordinating deubiquitination and acetylation-driven ubiquitination. Sci. Signal. 2010;3:ra80. doi: 10.1126/scisignal.2001462. [DOI] [PMC free article] [PubMed] [Google Scholar]
- 65.Nelder JA, Mead R. A simplex method for function minimization. Comput. J. 1965;7:308–313. [Google Scholar]
- 66.Fuchs C. Inference for Diffusion Processes. Heidelberg: Springer; 2013. [Google Scholar]
- 67.Lei H, Oh SP, Okano M, Juttermann R, Goss KA, Jaenisch R, Li E. De novo DNA cytosine methyltransferase activities in mouse embryonic stem cells. Development. 1996;122:3195–3205. doi: 10.1242/dev.122.10.3195. [DOI] [PubMed] [Google Scholar]
- 68.Meilinger D, Fellinger K, Bultmann S, Rothbauer U, Bonapace IM, Klinkert WE, Spada F, Leonhardt H. Np95 interacts with de novo DNA methyltransferases, Dnmt3a and Dnmt3b, and mediates epigenetic silencing of the viral CMV promoter in embryonic stem cells. EMBO Rep. 2009;10:1259–1264. doi: 10.1038/embor.2009.201. [DOI] [PMC free article] [PubMed] [Google Scholar]
Associated Data
This section collects any data citations, data availability statements, or supplementary materials included in this article.