

Abstract
Successful integration of auditory and visual inputs is crucial for both basic perceptual functions and for higher-order processes related to social cognition. Autism spectrum disorders (ASD) are characterized by impairments in social cognition and are associated with abnormalities in sensory and perceptual processes. Several groups have reported that individuals with ASD are impaired in their ability to integrate socially relevant audiovisual (AV) information, and it has been suggested that this contributes to the higher-order social and cognitive deficits observed in ASD. However, successful integration of auditory and visual inputs also influences detection and perception of nonsocial stimuli, and integration deficits may impair earlier stages of information processing, with cascading downstream effects. To assess the integrity of basic AV integration, we recorded high-density electrophysiology from a cohort of high-functioning children with ASD (7–16 years) while they performed a simple AV reaction time task. Children with ASD showed considerably less behavioral facilitation to multisensory inputs, deficits that were paralleled by less effective neural integration. Evidence for processing differences relative to typically developing children was seen as early as 100 ms poststimulation, and topographic analysis suggested that children with ASD relied on different cortical networks during this early multisensory processing stage.
Keywords: auditory, electrophysiology, ERPs, multimodal, visual
Introduction
Autism spectrum disorders (ASD) are characterized by impairments in social communication and by restricted, repetitive, and stereotyped behavioral patterns (APA 2000). Unusual sensory symptoms, though not included in the current diagnostic formulation, have long been noted in individuals with ASD (Kanner 1943; Asperger 1944; Bergman and Escalona 1949; Wing 1969; Hermelin and O'Connor 1970; Ayres and Tickle 1980; Kientz and Dunn 1997; O'Neill and Jones 1997; Kern et al. 2006, 2007; Ben-Sasson et al. 2009; Cheung and Sui 2009; Crane et al. 2009; Lane et al. 2010, 2011). Anecdotal and clinical reports suggest that individuals with ASD may also have problems integrating sensory information (O'Neill and Jones 1997). Given that fundamental functions such as detecting and localizing an object, as well as higher-order processes such as object identification and social communication (e.g., speech and emotion recognition), are enhanced by complementary multisensory inputs (Stein et al. 1988, 1989; Molholm et al. 2002, 2004; Ross et al. 2007a, 2007b, 2011; Gingras et al. 2009; Werner and Noppeney 2010; Fiebelkorn et al. 2011), impairments in the ability to integrate multisensory information could have potentially devastating consequences for perceptual, cognitive, and social functioning (Foxe and Molholm 2009).
A surge in investigations into multisensory influences on perception and cognition has led to significant progress in our understanding of how the brain processes and benefits from multisensory inputs (Foxe et al. 2002; Foxe and Schroeder 2005; Foxe and Molholm 2009; Stein et al. 2009; Klemen and Chambers 2012). These insights combined with renewed interest in the role of sensory integration in autism have sparked research directed at empirically testing the basis of subjective reports of multisensory processing deficits in ASD (for a review, see Marco et al. 2011). The preponderance of this research has been behavioral and has largely focused on the processing of multisensory audiovisual (AV) social stimuli related to communication, such as speech sounds accompanied by their requisite lip movements. Results from the majority of these studies indicate that the ability to integrate AV speech is impaired in individuals with ASD (de Gelder et al. 1991; Smith and Bennetto 2007; Magnee et al. 2008; Mongillo et al. 2008; Taylor et al. 2010; Irwin et al. 2011; but also see Iarocci et al. 2010; Williams et al. 2004). Only a few studies have considered AV integration in ASD for nonsocial stimuli (van der Smagt et al. 2007; Mongillo et al. 2008; Foss-Feig et al. 2010; Kwakye et al. 2011) and these have yielded mixed and somewhat conflicting results. Thus, the question remains as to whether impairments in AV integration are specific to complex social stimuli, which are by definition problematic in ASD, or if instead they are rooted in more basic deficits in multisensory processing. This has obvious implications for understanding the basis of impairments in higher-order cognitive processes in ASD (e.g., social communication), as well as for neurobiological theories of ASD such as the disordered connectivity account (Just et al. 2004).
Decades of brain imaging research on the neural underpinnings of ASD strongly suggest that autism is not a strictly localized brain disorder, but rather a disorder involving multiple functional neural networks (Muller 2007; Rippon et al. 2007). An accumulation of neuroanatomical and neurofunctional findings (see Courchesne et al. 2005; Schipul et al. 2011) have led to the proposal that the common pathway to the ASD phenotype is disordered brain connectivity (Belmonte et al. 2004; Just et al. 2007; Anagnostou and Taylor 2011; Wass 2011). Disordered connectivity has obvious implications for the integration of information from the different “processing nodes” within a functional network, perhaps especially so when these segregate into anatomically distant brain regions. Thus, whilst humans seamlessly integrate inputs from multiple sensory modalities to oftentimes dramatically influence perception and performance (Wallace et al. 2004; Ross et al. 2007a; Ma et al. 2009; Fiebelkorn et al. 2011), dysfunctional patterns of brain connectivity, as proposed for ASD, should lead to deficits in the integration of multisensory cues.
The present study investigated whether children and adolescents with a diagnosis of ASD show evidence of multisensory dysfunction for the integration of basic AV inputs. Previous work from our laboratory characterized the typical developmental course of AV integration for such stimuli, from middle childhood to adulthood, using both behavioral and electrophysiological indices of multisensory integration (MSI; Brandwein et al. 2011). To address whether individuals with autism have general deficits in their integration of AV information independent of social- or communication-related uses, we applied these well-defined metrics of MSI to a population of high-functioning children with a diagnosis of ASD. This allowed us to systematically assess the time course and underlying neuronal generators involved in the integration of simple AV stimuli in children with ASD and whether these are related to the ability to benefit behaviorally from multisensory cues. Because development is known to strongly influence the extent to which multisensory cues influence perception and behavior (Lewkowicz 2003; Neil et al. 2006; Bair et al. 2007; Flom and Bahrick 2007; Gori et al. 2008; Lewkowicz and Ghazanfar 2009; Brandwein et al. 2011; Hillock et al. 2011; Ross et al. 2011; Stein and Rowland 2011), we additionally considered the developmental course of these processes in ASD by comparing data from younger (7–10) and older (11–16) children.
Materials and Methods
Participants
Seventy-two individuals with typical development (TD) and 46 individuals with ASD between the ages of 7 and 16 years participated. An additional 13 individuals (3 TD, 10 ASD) were excluded from all behavioral and electrophysiological analyses because of hit rates 2.5 standard deviations below the sample's average or for an excessive number of button presses making it difficult to know whether they were attending to the stimuli. Two of the 118 individuals (1 TD, 1 ASD) that were included in the behavioral analyses were excluded from the electrophysiological analyses due to excessively noisy event-related potential (ERP) data (i.e., fewer than 50% of trials per condition were accepted). Exclusionary criteria for both the groups included a nonverbal IQ below 80 as assessed by the Wechsler Abbreviated Scale of Intelligence (Wechsler 1999) and a history of seizures or head trauma. All participants had normal or corrected-to-normal vision and passed a hearing screen. Exclusion criteria for the TD group included a history of developmental, psychiatric, or learning difficulties as assessed by a parent history questionnaire. All children were screened for attention deficit/hyperactivity disorder (ADHD). Only TD children were excluded if their parents endorsed six items or more of inattention or hyperactivity on a DSM-IV ADHD behavioral checklist. Children with ASD were not excluded for presenting with symptoms of inattention and hyperactivity, as such symptoms are very common in ASD, and DSM-IV holds that a diagnosis of an ASD precludes a comorbid diagnosis of ADHD. Children with TD were also excluded if they had a biological first-degree relative with a known developmental disorder.
For the ASD group, diagnoses of ASD were obtained using both the Autism Diagnostic Interview-R (Lord et al. 1994) and the Autism Diagnostic Observation Schedule (Lord et al. 1999), and were confirmed by clinical judgment for 42 of the 46 children. Diagnoses of the remaining four children were made by a licensed clinical psychologist external to this study using the DSM-IV TR's diagnostic criteria for ASD. All but 2 of the 46 children in the ASD group had also been diagnosed by a licensed clinician (typically a psychiatrist, psychologist, or a developmental pediatrician or neurologist) prior to entering the study. Of the 46 children in the ASD group, 13 had a diagnosis of autistic disorder, 24 of Asperger's disorder, and 9 of pervasive developmental disorder—not otherwise specified (PDD-NOS). Parents were asked to refrain from giving their children (n = 9) stimulant medication in the 24-h period preceding the testing session. Six children were taking other psychoactive medications (including SSRIs, aripiprazole, atomoxetine, lithium, guanfacine, and risperidone) at the time of testing. To ensure that medication was not a confounding factor, analyses were also performed excluding these six medicated individuals. Because the main between-group findings were maintained, the more inclusive analyses are reported.
In order to assess developmental changes in MSI, participants were divided into two age groups: 7–10 years and 11–16 years. Table 1 outlines participant characteristics. The distribution of males and females in the TD groups was fairly even (45% were male in the younger group and 49% were male in the older group), whereas the ASD groups consisted primarily of males (86% in the younger group and 79% in the older group), which is representative of the well-established male:female ratio (4:1) of ASD in the general population (Kogan et al. 2009). A comparison within the TD group of the dependent measures as a function of sex did not attain significance on our primary behavioral or electrophysiological measures of MSI. Further, in response to a reviewer's suggestion, all between-group analyses were performed on a smaller sample in which the sex ratio was matched between the ASD and TD groups (by excluding some of the females in the TD group). Because this yielded between-group effects that were essentially identical to that for the larger sample, we report the results from the original analyses of the full data set. Participants were group matched on the basis of performance IQ (PIQ) and age. An analysis of variance (ANOVA) revealed that there were no significant differences between the TD and the ASD groups in PIQ (young: F (1,53) = 0.076, P = 0.783; old: F (1,61) = 0.682, P = 0.412) or in Age (young: F (1,53) = 0.236, P = 0.629, old: F (1,61) = 3.432, P = 0.069).
Table 1.
Means and standard deviations (in parentheses) for the demographic data as a function of Diagnostic Group (TD versus ASD) and Age Group
| Younger children: 7–10 years |
Older children: 11–16 years |
|||
|---|---|---|---|---|
| TD | ASD | TD | ASD | |
| Age | 9.0 (1.2)a | 9.2 (1.3)a | 13.8 (1.6)b | 13.0 (1.6)b |
| VIQ | 114 (14) | 105 (20) | 114 (11) | 100 (24) |
| PIQ | 109 (13)c | 110 (18)c | 106 (10)c | 109 (14)c |
| FSIQ | 113 (14) | 108 (20) | 111 (10) | 104 (19) |
| N | 33 | 22 | 39 | 24 |
| No of males | 15 | 19 | 19 | 19 |
PIQ, performance intelligence quotient as measured by the Wechsler Abbreviated Scale of Intelligence (WASI). The PIQ of four children in the ASD group were measured using the Wechsler Intelligence Scale for Children (WISC-IV).
a,bAge of participants was not significantly different.
cPIQ of participants was not significantly different.
Before participation, informed written consent was obtained from every child's parent or legal guardian, and verbal or written assent was obtained from each child. All procedures were approved by the Institutional Review Boards of the City College of the City University of New York and the Albert Einstein College of Medicine. Participants were given $12.00 an hour for their time in the laboratory. All procedures were consistent with the ethical standards laid out in the Declaration of Helsinki.
Procedure
Participants performed a simple reaction time (RT) task at a computer in a dimly lit sound-attenuated and electrically shielded room. The task was identical to that described in Brandwein et al. (2011) and consisted of three stimulus conditions presented in random order with equal probability. To decrease predictability of the timing of stimulus presentation, the interstimulus interval (ISI) varied randomly between 1000 and 3000 ms according to a uniform (square-wave) distribution. Varying the ISI served to minimize the extent to which participants could predict and anticipate stimulus onset, thus reducing the contribution of anticipatory potentials to the ERP (see Teder-Salejarvi et al. 2002). The “auditory-alone” condition consisted of a 1000-Hz tone (duration, 60 ms; 75 dB SPL; rise/fall time, 5 ms) presented from a single Hartman Multimedia JBL Duet speaker located centrally atop the computer monitor from which the visual stimulus was presented. The “visual-alone” condition consisted of a red disc with a diameter of 3.2 cm (subtending 1.5° in diameter at a viewing distance of 122 cm) appearing on a black background and presented for 60 ms on a monitor (Dell Ultrasharp 1704FTP). The disc was located 0.4 cm above central fixation along the vertical meridian (0.9° at a viewing distance of 122 cm). The “audiovisual” condition consisted of the auditory-alone and visual-alone conditions presented simultaneously. The auditory and visual stimuli were presented in close spatial proximity, with the speaker placed in vertical alignment with the visual stimulus. Participants were instructed to press a button on a response pad (Logitech Wingman Precision) with their right thumb as quickly as possible when they saw the circle, heard the tone, or saw the circle and heard the tone. The same response key was used for all the three stimulus types. Stimuli were presented in blocks of ∼100 trials each (with all the three stimulus conditions presented in random order), and participants completed between 8 and 11 blocks (with the vast majority completing 10 blocks). In order to minimize excessive movement artifacts, participants were told to focus their eyes on a central fixation cross during all conditions.
Electroencephalography Acquisition
Continuous electroencephalography (EEG) was recorded from 70 scalp electrodes at a digitization rate of 512 Hz using the BioSemi ActiveTwo™ electrode system with an open pass-band from DC to 150 Hz. The continuous EEG was recorded referenced to a common mode sense (CMS) active electrode and a driven right leg (DRL) passive electrode. CMS and DRL, which replace the ground electrodes used in conventional systems, form a feedback loop, thus rendering them references (for a description of the BioSemi active electrode system referencing and grounding conventions, visit www.biosemi.com/faq/cms&drl.htm).
Behavioral Analyses
Button press responses to the three stimulus conditions were acquired during the recording of the EEG and were processed offline using Matlab. RT means and standard deviations were calculated for each condition for each participant. Only trials with RTs falling within 2 standard deviations of an individual's average RT were considered valid. Thus, the range of RTs accepted was determined at the individual participant level. Given the large age range and the inclusion of a clinical population, significant intersubject variability in RT was expected. Using a 95% cutoff to define the time window for acceptable trials rather than an absolute cutoff value allowed us to more accurately capture the range of RTs for each participant, an important factor in calculating the race model (described below). Hit rates, defined as the percent of trials on which a button press occurred within the individual's specific RT range, were calculated for each participant. Slow responses, that is, RTs more than 2.5 standard deviations below the individual's mean RT, were considered misses. A 2 × 2 × 3 mixed-design ANOVA (with factors of diagnostic group, age group, and stimulus condition) was performed to assess group differences in hit rates.
To compare RTs across the three stimulus conditions and to assess group differences, a three-way mixed-design ANOVA (factors as above) was conducted. Planned comparisons between each of the unisensory conditions and the multisensory condition tested for the presence of the “redundant signal effect” (RSE), that is, a faster reaction to multisensory than to unisensory stimuli, which, in this case, indicates behavioral facilitation for the multisensory condition compared with each of the unisensory conditions.
However, such facilitation may occur simply due to probability summation; therefore, the more stringent criteria of Miller's race model (Miller 1982) was implemented. According to the race model, mean RTs decrease because there are now two inputs (e.g., auditory and visual) to trigger a response, and the fastest input wins. In this model, facilitation can be explained in the absence of an interaction between the two inputs due to probability summation. However, when there is a violation of the race model, it can be assumed that the unisensory inputs interacted during processing to facilitate RT performance.
Testing the Race Model
Miller's (1982) model places an upper limit on the cumulative probability (CP) of a response at a given latency for redundant signals (i.e., the multisensory condition). For any latency, t, the race model holds when this CP value is less than or equal to the sum of the CP from each of the single-target stimulus conditions (the unisensory stimuli). For each individual, the range of valid RTs was calculated for the three stimulus types (auditory-alone, visual-alone, and audiovisual) and divided into quantiles from the 5th to 100th percentile in 5% increments (5, 10, … , 95, 100%). Violations were expected to occur at quantiles representing the shorter RTs because this is when it was most likely that interactions of the visual and auditory inputs would result in the fulfillment of a response criterion before either source alone satisfied the same criterion (Miller 1982; Ulrich et al. 2007). It is important to note that failure to violate the race model is not evidence that the two information sources did not interact, but rather it places an upper boundary on RT facilitation that can be accounted for by probability summation.
At the individual level, a participant was said to have shown race-model violation if the CP of his/her RT to the AV stimulus was larger than that predicted by the race model (see above) at any quantile within the first third of the distribution (represented by the first seven quantiles, i.e., the quantiles containing the lower end of RTs where violations are expected to occur).
A “Miller inequality” value is calculated by subtracting the value predicted by the race model from this CP value, and positive values represent the presence and amount of race-model violation. Figure 1 depicts unisensory, multisensory, and race-model values derived from the grand mean from all participants (N = 118) to help the reader visualize how these measures relate to one another. A secondary level of analysis was conducted at the group level. For each of the four subject groups (TD: 7–10 years, TD: 11–16 years, ASD: 7–10 years, ASD: 11–16 years), Miller inequality values (from each individual at each quantile considered) were submitted to a t-test. The group was said to violate the race model at quantiles in which the t-test was significant and the Miller inequality value was positive. A less conservative approach was also undertaken in which a 2 × 2 ANOVA directly tested for between-group differences in race-model violation as indexed by maximum Miller inequality value over the first third of the RT distribution.
Figure 1.
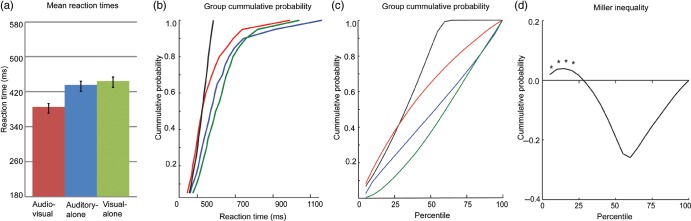
Testing the race model. Mean data across the full data set are presented (N = 118). (a) RTs and standard errors for the multisensory (AV) and unisensory conditions. (b, c) CP distributions for the multisensory (red trace), auditory-alone (blue trace), visual-alone (green trace) stimulus conditions, and the CP predicted by the race model (black trace) as a function of RTs (b) and percentile (c). When the CP for the multisensory condition is greater than that predicted by the race model, race-model violation has occurred. (d) Miller inequality: values greater than zero signify race-model violation. Miller inequality values at the first seven quantiles (equivalent to the 35th percentile) were submitted to t-tests. Asterisks indicate statistically significant race-model violation.
EEG/ERP Processing and Analyses
Matlab was used for offline processing and analyses. A low-pass filter of 45 Hz with a slope of 24 db/octave, and a high-pass filter of 1.6 Hz with a slope of 12 db/octave were applied to each participant's continuous EEG. To generate ERPs, the EEG was divided into 600 ms epochs (100 ms prestimulus to 500 ms poststimulus onset) with baseline defined as −50 to +10 ms relative to stimulus onset. Trials that did not meet criteria for inclusion in the behavioral analyses (described above) were also excluded from the ERP analysis. Electrode channels with amplitudes larger than ±120 µV during the epoch surrounding stimulus presentation were considered to have excessive electromuscular activity, including those resulting from large eye movements, and were interpolated on a trial-by-trial basis using the nearest-neighbor spline (Perrin et al. 1987, 1989). Channels with a standard deviation of <0.5 µV across the block were interpolated on a block-by-block basis. Finally, if there were more than four bad channels in a trial, then the trial was rejected (i.e., no more than four channels were interpolated for any given trial). Epochs were sorted according to stimulus condition and averaged for each participant. The resulting ERPs were rereferenced to an average of all electrodes. For each participant, the “sum” condition was created by summing the ERPs from the auditory-alone and the visual-alone conditions. Group-averaged ERPs for all conditions were imported into Brain Electric Source Analysis software for the purpose of visualizing the topographical distribution on the scalp.
An analysis of the unisensory responses was conducted to assess whether there were between-group differences in the componentry of the auditory-alone and visual-alone responses. The peak amplitudes of the auditory P1, N1a, N1b, N1c, and P2, and of the visual P1, and N1 were subjected to a multivariate ANOVA with Diagnostic Group (TD and ASD) and Age Group (young and old) as the between-group factors. The latency and electrodes used in the ANOVA were determined based on the grand averaged data for all participants (N = 116).
AV interactions were measured by comparing the ERPs to the audiovisual and the sum conditions. This commonly used measure of multisensory processing (e.g., Giard and Peronnet 1999; Foxe et al. 2000; Molholm et al. 2002; Teder-Salejarvi et al. 2002; Murray et al. 2005; Russo et al. 2010; Brandwein et al. 2011) is based on the principle of superposition of electrical fields and relies on nonlinear summation as evidence for multisensory interactions (e.g., that the auditory and visual inputs interacted). A benefit of using this measure, particularly when conducting between-group comparisons, as in the present study, is that MSI is always calculated relative to the individual's unisensory processing. This repeated-measures design provides a built-in control for between-subject differences in unisensory processing.
For the primary statistical analyses of the multisensory effects, mixed-design ANOVAs with factors of Diagnostic Group (TD and ASD), Age Group (7–10-year and 11–16-year age groups), and Condition (AV and sum) were used. The latency and regions included in the planned analyses were based on findings from previous work (Brandwein et al. 2011) which showed AV MSI in healthy children at 100–120 ms over fronto-central scalp and between 180 and 210 over left and right parieto-occipital areas (roughly corresponding to the visual N1). When appropriate, the results of the ANOVAs were based on Greenhouse–Geisser corrections, and significant effects were followed by post hoc comparisons with Bonferroni adjustments.
A second level of analysis was employed to more fully describe the multisensory data. This relatively unconstrained approach allows a snapshot view of effects across the full data set and serves as an important hypothesis generation tool for future studies. The so-called Statistical Cluster Plots (SCPs) were created by plotting the results of running t-tests comparing the AV and sum ERPs at each time point, for each electrode. The probability of Type-1 errors was decreased by only considering those data points that reached significance (at the P ≤ .05 level) for at least 10 subsequent consecutive time points (which, given the 512 Hz digitization rate, would exclude effects that did not last for at least 19.5 ms) and at three or more adjacent electrodes sites. Further explanation of this approach can be found elsewhere (e.g., Guthrie and Buchwald 1991; Molholm et al. 2002; Russo et al. 2010; Brandwein et al. 2011). Cluster plots of the AV compared with the sum ERP data were generated for each of the four participant groups.
Topographical Analysis
To assess differences in the underlying neural generator configuration responsible for observed multisensory effects across groups, we used the topographical non-parametric statistical analysis (TANOVA), as implemented in the Cartool software (http://sites.google.com/site/fbmlab/cartool), to test for differences in the neural generators of MSI between TD and ASD groups using global dissimilarity and nonparametric randomized testing for each age group. Global dissimilarity is an index of configuration differences between two scalp distributions, independent of their strength. For each subject and time point, a single value is generated, which varies between 0 and 2 (0, homogeneity; 2, inversion of topography). To create an empirical probability distribution against which the global dissimilarity can be tested for statistical significance, the Monte Carlo MANOVA was applied (for a more detailed description, see Manly 1991). To control for Type-I errors, a period of statistical significance was only considered significant if an alpha criterion of 0.05 or less was obtained for at least 11 consecutive sample points (∼21 ms) (Guthrie and Buchwald 1991; Foxe and Simpson 2002; Butler et al. 2011).
Correlation Analysis
To explore the relationship between neural and behavioral measures of AV integration, a partial correlation coefficient was computed for race-model violation (e.g., the largest Miller inequality value for each participant over the first third of the RT distribution) and the difference between the AV and the sum ERP between 100 and 120 ms over frontocentral scalp, controlling for age of the participant. This latency and region were chosen a priori based on significant MSI effects in previous studies of TD children (Brandwein et al. 2011).
Results
Behavioral Measures of MSI
Participants performed a simple RT task, responding with a button press to randomly presented auditory stimuli (a tone), visual stimuli (a red disc against a black background), and multisensory stimuli (both stimuli presented simultaneously). As detailed in Table 2, although all children performed well, children in the TD group had a higher hit rate than those in the ASD group (F (1,114) = 12.254, P < 0.01) and the older participants had higher hit rates than the younger participants (F (1, 114) = 9.414, P < 0.01). Within groups, hit rate was highest for the AV condition and lowest for the visual condition (F (1.536,175.134) = 60.058, P < 0.01). Mean RTs (Table 2) for all stimulus conditions were significantly faster in TD children than in the children with ASD (F (1,114) = 7.542, P < 0.01), and in the older group compared with the younger group of children (F (1,114) = 10.813, P < 0.01). While the TD children showed greater quickening of RTs as a function of age compared with the children with ASD, there was no significant interaction of Age Group and Diagnostic Group. For all groups, RTs to multisensory stimuli were significantly faster than to either the auditory or the visual stimuli (F (1.692,192.901) = 254.668, P < 0.01), indicating the presence of an RSE. Neither Diagnostic Group nor Age Group interacted with stimulus condition, indicating similar patterns of RSE for all groups.
Table 2.
Means and standard deviations (in parentheses) for the hit rate and RT data for each of the stimulus conditions as a function of Diagnostic Group (TD versus ASD) and Age Group
| Younger children: 7–10 years |
Older children: 11–16 years |
|||
|---|---|---|---|---|
| TD | ASD | TD | ASD | |
| Hit rate (%) | ||||
| Auditory | 90 (4) | 87 (6) | 93 (4) | 89 (6) |
| Visual | 88 (6) | 84 (8) | 91 (6) | 87 (5) |
| AV | 91 (4) | 88 (5) | 93 (3) | 91 (4) |
| RT (ms) | ||||
| Auditory | 463 (109) | 498 (142) | 369 (107) | 450 (121) |
| Visual | 473 (113) | 507 (133) | 375 (107) | 464 (122) |
| AV | 410 (109) | 449 (127) | 319 (102) | 397 (117) |
Refer to the main text for a description of the statistically significant differences between conditions and groups.
Results of Race-Model Analysis
To determine whether quickening of responses to the multisensory condition exceeded the amount predicted by the statistical summation of the fastest unisensory responses (see Materials and Methods), the RTs of all participants were subjected to a race-model analysis. In the 7–10-year-old groups, 73% of the children with TD and 55% of the children with ASD showed some violation of the race model in at least one of the first seven quantiles. In the 11–16-year-old groups, more children showed violation: 95% in the TD group and 71% in the ASD group. Figure 2 illustrates, at a quantile-by-quantile level, the percentage of individuals in each group that violate the race model across the first third of the RT distribution.
Figure 2.

The percentage of children in each group who show violation of the race model at each of the seven quantiles considered (the first third of the RT distribution). TD, children with typical development; ASD, children with autism spectrum disorder.
To test the reliability of race-model violations at the group level, for each of the seven quantiles considered, Miller inequality values were submitted to t-tests. As illustrated in Figure 3, neither of the ASD groups showed significant race-model violation. In contrast, both TD groups showed significant race-model violation; the younger TD group violated in the first two quantiles, and the older TD group across all tested quantiles (similar to findings from our earlier investigation; Brandwein et al. 2011). Overall, the older ASD group showed much less race-model violation than the older TD group, as indicated by lower Miller inequality values. Descriptively, the older ASD group showed a pattern of race-model violation that was more similar to that of the younger TD group. Though the magnitude and duration of race-model violation appeared somewhat similar in the young TD group and the old ASD group, it is important to note that the old ASD group did not show significant race-model violation while the young TD group did.
Figure 3.

Miller inequality curves are presented for each of the four groups. Values greater than zero signify race-model violation. Miller inequality values at the first seven quantiles (equivalent to the 35th percentile) were submitted to t-tests. Asterisks indicate statistically significant race-model violation.
To statistically compare race-model violation between groups, a second approach to analyzing race-model violation evaluated the relationship of Diagnostic Group and Age Group on race-model violation. The ANOVA revealed that the magnitude of race-model violation, as indexed by the maximum Miller inequality value in the first third of the RT distribution, was significantly larger in the TD group than in the ASD group (F (1,114) = 19.732, P < 0.01), and in the older age group compared with the younger age group (F (1,114) = 19.996, P < 0.01). Furthermore, a significant interaction (F (1,114) = 5.174, P < 0.05) indicated that age has an effect on maximum race-model violation in the TD group (with the magnitude of violation being greater in the older than in the younger group), but that age did not have a significant effect in the ASD group.
Unisensory ERPs
Auditory Evoked Potentials
The expected developmental changes in the morphology of the auditory P1–N1–P2 complex were observed for both the ASD and TD groups (Fig. 4). Consistent with previous findings in healthy children (Ponton et al. 2000; Gomes et al. 2001; Ceponiene et al. 2002; Brandwein et al. 2011), the frontocentrally focused P1 appeared earlier and smaller in the older groups of children, the frontocentrally focused auditory N1 (or N1b) was earlier and more prominent in the older groups of children (with a polarity reversal at temporal sites), and the lateral components of the N1 (the N1a and N1c) were more negative in the younger groups of children. While the general morphology of the auditory ERPs was similar in the TD and ASD groups, there were some specific group differences, particularly between the younger age groups, with the ASD group having a larger lateral N1a and a smaller lateral N1c. The results of a multivariate ANOVA confirmed a main effect of age on amplitude for the auditory P1 (F (1,112) = 15.683, P < 0.01), N1a (F (1,112) = 10.563, P < 0.01), N1b (F (1,112) = 12.896, P < 0.01), and N1c (F (1,112) = 11.001, P < 0.01). A main effect of Diagnostic Group confirmed that the peak amplitude of the N1c was smaller in the ASD compared with the TD children (F (1,112) = 4.882, P < 0.05). In contrast, the amplitudes of the auditory P1, N1a, and N1b were not significantly different between the TD and ASD groups, and there were no significant interactions of Age Group and Diagnostic Group on the amplitude of any of the auditory components considered.
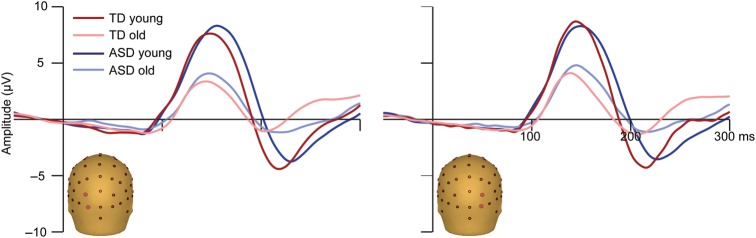
Figure 4.

Auditory ERPs. Mean ERPs to the auditory-alone condition are presented for each of the four groups. Traces represent the composite signal from two adjacent electrodes, the locations of which are indicated on the head models.
Visual Evoked Potentials
The visual-alone ERPs also showed the expected morphology for both the TD and ASD groups, characterized by an occipitally focused P1, and an N1 over bilateral lateral occipital scalp areas (Fig. 5). The most apparent group difference was that P1 and N1 were of much larger amplitude in the younger compared with the older children, which is consistent with prior reports that the amplitudes of the visual P1 and N1 decrease across development (Lippe et al. 2007; Hirai et al. 2009; Kuefner et al. 2010; Brandwein et al. 2011; Hileman et al. 2011). The peak of the visual N1 appeared broader and later in the ASD compared with the TD groups. A multivariate ANOVA confirmed a main effect of Age Group on amplitude for the visual P1 only (F (1,112) = 35.814, P < 0.01). The visual N1 was significantly more negative in the participants with TD compared to those with ASD (F (1,114) = 11.200, P < 0.01). The amplitude of the visual P1 was similar in the TD and ASD groups, and there were no significant interactions of Age Group and Diagnostic Group on the amplitude of the visual P1 or N1.
Figure 5.
Visual ERPs. Mean ERPs to the visual-alone condition are presented for each of the four groups. Traces represent the composite signal from two adjacent electrodes, the locations of which are indicated on the head models.
Neural Measures of MSI
AV interactions, as indicated by differences between the multisensory and the summed ERPs, were readily observable between 100 and 120 ms over fronto-central scalp in the two TD groups (Fig. 6a) but not in the ASD groups. In the TD groups, the multisensory response was more negative in amplitude than the summed response. An ANOVA confirmed a main effect of Condition (F (1, 112) = 9.078, P < 0.01) and, more pertinent to our hypothesis, a significant interaction of Diagnostic Group and Condition (F (1, 112) = 7.528, P < 0.01). Age Group did not have a significant effect on Condition. At the second latency and region of interest, 180–210 ms over left and right parietal-occipital areas, both the TD and the ASD groups showed AV interactions. A main effect of Condition (F (1, 112) = 4.702, P < 0.05) confirmed that the multisensory response in this latency and region was significantly more negative going than the summed response. There were no significant interactions of Diagnostic Group and/or Age Group with Condition.
Figure 6.

Multisensory effects at 110 ms. (a) Multisensory (AV) and summed (A + V) ERPs and their difference (AV − (A + V)) are shown for each of the four participant groups. Traces represent the composite of four adjacent fronto-central electrode sites (Fz, FCz, FC1, and FC2). Gray bars highlight the 100–120 ms window of analysis. (b) Voltage maps depict the scalp distribution of the MSI effect at 110 ms poststimulus onset (the difference between the multisensory and summed responses). (c) Multisensory (AV) and summed (A + V) ERPs and their difference (AV − (A + V)) are shown for each of the four participant groups. Traces represent the composite of four adjacent parietal electrode sites (Pz, P1, P2, CPz). (d) Results of the TANOVA analysis. Significant topographical differences between the TD and ASD groups are marked in red, presented separately for young and old age groups.
Exploratory SCPs
To further characterize the spatiotemporal characteristics of AV integration in each of the groups, SCPs representing significant results of running t-tests between the multisensory and sum conditions for all electrodes at all time points (between 50 ms prestimulus onset to 300 ms poststimulus onset) were generated for each group (see Materials and Methods). The cluster plot analyses (Fig. 7) revealed early interactions of auditory and visual processes in the oldest TD group between 40 and 80 ms over left parieto-occipital and frontal scalp regions. AV interactions were seen in all four groups between 100 and 130 ms over parietal scalp. In the older TD group, AV interactions in this time frame were widespread, also appearing over frontal, fronto-central, and occipital scalp. The next clear AV interactions were centered around 150 ms over multiple regions in both young and old TD groups, but not in the ASD groups. Widespread AV interactions from 275 ms onwards can be seen in the SCPs for all the four groups and are not discussed further as they most likely represent cortical activity related to motor responses (which occurs in response to all stimuli and is thus represented twice in the sum response).
Figure 7.

SCPs: running t-tests comparing the multisensory and sum ERPs for each of the four groups. Significance is depicted for effects meeting a 0.05 alpha criterion and lasting for at least 10 consecutive data points (19.2 ms at a 512 Hz sampling rate). The color bar indicates directionality of the effects, with white indicating an absence of significant t-values. Time is plotted in the x-axis from −50 to 300 ms. Electrodes are plotted in the y-axis. Starting from the bottom of the graph, the electrodes are divided into sections from posterior to anterior scalp with each color representing 4–5 electrodes, the relative positions of which are located on the corresponding head.
Topographical Analysis
A TANOVA analysis revealed no differences in the topographies of the young TD and ASD groups (Fig. 6d), a finding that could be the result of relatively small MSI effects in both the groups. There were differences between the older TD and ASD groups from about 90–128 ms and corresponded with readily observable differences in topography of MSI in that timeframe (see Fig. 6d).
Post hoc ANOVAs
Based on findings from the SCP running t-test analysis (Fig. 7), three additional ANOVAs were conducted to assess group differences in MSI: over left parieto-occipital scalp between 40 and 80 ms, over parietal scalp between 100 and 130 ms, and over parieto-occipital scalp between 140 and 160 ms. For the earliest time period, there were no effects or interactions involving Condition. In the next timeframe, consistent with the SCPs, a main effect of Condition was observed (F (1,112) = 42.774, P < 0.01) over parietal scalp in the 100–130 ms timeframe, with the summed response appearing more negative than the multisensory response (Fig. 6c). There were no group differences in MSI between 100 and 130 ms over parietal regions. Between 140 and 160 ms, a main effect of Condition (F (1,112) = 12.458, P < 0.01) over posterior scalp indicated that the multisensory response was significantly larger than the summed response. As illustrated in Figure 8, this effect was qualified by a significant interaction between Condition and Diagnostic Group (F (1,112) = 7.814, P < 0.01) such that AV interactions were larger in the TD groups compared with the ASD groups. There were no effects involving Age Group.
Figure 8.
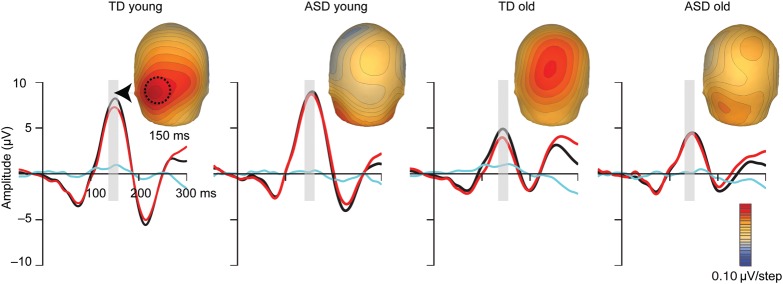
MSI effects at 150 ms. Multisensory (AV) and summed (A + V) ERPs and their difference (AV − (A + V)) are shown for each of the four participant groups. Traces represent the composite of three adjacent left parieto-occipital sites (PO7, PO3, O1; location indicated with a dashed circle on the left most voltage map). Gray bars highlight the 140–160 ms window of analysis. Voltage maps depict the scalp distribution of the MSI effect (the difference between the multisensory and sum responses) at 150 ms.
Correlations between Neural and Behavioral Measures of MSI
A partial correlation, controlling for age, revealed a relationship between maximum race-model violation and neural measures of AV integration over fronto-central scalp between 100 and 120 ms that trended toward significance (r116 = −0.174, P = 0.06). An additional post hoc partial correlation analysis, also controlling for age of the participant, was conducted in the 140–160 ms timeframe over parieto-occipital scalp where TD children show robust AV neural interactions. A significant correlation (r116 = 0.305, P < 0.01) confirmed that maximum race-model violation is correlated with neural measures of AV integration over parieto-occipital scalp between 140 and 160 ms. Considering the TD and ASD children separately indicated that this correlation was only significant in the TD children (r71 = 0.256, P < 0.05).
Discussion
Research in autism has been heavily weighted towards developing and testing theoretical frameworks within which the core features of the disorder—impairments in social interactions and communication, and stereotyped, rigid patterns of behavior—may be better understood (see Ozonoff et al. 1991; Baron-Cohen et al. 2003; Hill and Frith 2003; Schultz et al. 2003 for discussions and reviews of executive function, theory of mind, weak central coherence, empathizing and systemizing, and social cognition theories of ASD). Sensory atypicalities frequently observed in this population are largely conceptualized as secondary to the core symptoms of autism (Rogers and Ozonoff 2005). Despite renewed discussion of sensory integration deficits in ASD and their impact on cognition, to date only a few studies have investigated whether basic MSI is intact in ASD, and these studies have yielded mixed and often contradictory results. The present study applied well-characterized metrics of MSI to describe multisensory processing for basic AV stimuli in a large sample of children and adolescents with and without a diagnosis of ASD. The resulting electrophysiological and behavioral data revealed striking differences between individuals with and without ASD, both in terms of the neural processes involved in integrating simple AV stimuli and in terms of ensuing behavioral consequences.
Behavioral Findings
Multisensory processing was measured behaviorally using a simple AV RT task, for which it has been shown that multisensory facilitation of performance and the associated neural processes develop gradually over middle childhood, reaching adult-like levels by about 14 years of age (Brandwein et al. 2011). The present findings replicated this result in the TD group. Not only was multisensory facilitation of behavior present in both younger and older TD groups, but it was significantly greater in the older group. In stark contrast to the TD group, neither the younger nor the older children with ASD showed significant multisensory facilitation of behavior at the group level.
Electrophysiological Findings
Paralleling these behavioral differences, children with ASD showed diminished and less widespread cortical AV interactions compared with the TD group. Reduced neural integration in the ASD groups was seen as early as 100 ms after stimulus onset over fronto-central scalp (see Fig. 6a,b), an area/timeframe of MSI that both the current and prior research indicates is associated with behavioral benefits (multisensory facilitation of RTs) in TD children (Brandwein et al. 2011). What is more, for the older groups of participants, statistical analysis confirmed different topographical distributions for MSI (Fig. 6), which indicates differences in the cortical circuitry that underlies the scalp recorded MSI effects. Following this initial stage of AV integration (at around 100 ms) was a period, onsetting around 150 ms, where TD groups exhibited clear and robust widespread AV interactions (Figs 7 and 8) that were absent in ASD groups. Thus, it appears that the integration of basic AV information in children with ASD involves reduced neural activity, particularly over frontal and parieto-occipital scalp areas. Considered along with our behavioral findings, the electrophysiological results indicate that the neural networks that underlie MSI in ASD are not as effective as those engaged in TD children.
A somewhat unexpected finding was that robust MSI was observed in the ASD group already by ∼100 ms poststimulus (Fig. 7), on par with the onset of the major MSI effect in the TD group. In contrast, Russo et al. (2010) found that auditory–somatosensory MSI of basic stimuli was essentially completely absent in ASD children until about 310 ms, whereas the TD group showed MSI effects by about 100 ms. This across-study difference could reflect the different sensory modalities involved, or it could be related to differences in how attention was allocated. In the auditory–somatosensory study, which showed an absence of early (ca. 100 ms) MSI in the ASD group, participants were instructed to ignore the stimuli and watch an unrelated movie. In contrast, in the current study, participants were required to attend and make a response to the eliciting stimuli. Thus, it is possible that individuals with ASD need to actively attend stimuli in order for relatively early MSI to occur, whereas this is not the case for individuals with TD. Consistent with this notion, evidence from an auditory mismatch negativity study highlights the idea that impaired automatic processing in children with ASD can be normalized through the investment of attention (Dunn et al. 2008). Indeed, given that there were small but significant performance differences between our ASD and TD groups, we cannot rule out that cognitive factors such as attention may have contributed to the observed differences in multisensory processing. The precise role of attention in the invocation of multisensory processing is currently a matter of significant research interest (e.g., Molholm et al. 2007; Talsma et al. 2007; Senkowski et al. 2008; Zimmer et al. 2010), and clearly the role of attention and its impact on multisensory processing in ASD needs to be directly tested using a design that explicitly manipulates attention.
Evidence for Disordered Connectivity?
Reduced MSI in individuals with ASD is consistent with the disrupted connectivity theory of autism that has been receiving considerable attention of late. While several variations exist, these theories refer to the general hypothesis that the short- and long-distance connections between cortical regions are compromised in autism and that reduced functioning of this neural circuitry results in impaired integration of information at the neural, cognitive, and social levels (Just et al. 2004; Wass 2011). These models are based, in part, on findings from “functional connectivity MRI”, or fcMRI, studies that indicate abnormal communication between functional cortical networks and regions in autism (Muller et al. 2011). For example, individuals with ASD show reduced synchronization between frontal and parietal areas while performing an executive functioning task (Just et al. 2007), between cortical language systems during a sentence comprehension task (Just et al. 2004), and between the fusiform face area and frontal areas during a working memory task involving face processing (Koshino et al. 2008). Anatomical evidence for diminished long-distance connectivity in autism includes findings of reduced integrity of the callosal fibers connecting sensory cortices and prefrontal areas (Barnea-Goraly et al. 2004), of atypical developmental trajectories for cerebral white matter volume (see Courchesne and Pierce 2005 for a review), and from postmortem studies showing abnormal microcircuitry of minicolumns (Casanova et al. 2002; Buxhoeveden et al. 2006) which may alter local as well as long-range cortical connections (reviewed in Courchesne and Pierce 2005; Courchesne et al. 2005). Though the present study cannot assess whether neural underconnectivity plays a causal role in the observed behavioral impairments in MSI, a significant correlation between our neurophysiological and behavioral measures of MSI is consistent with the notion that impaired long-range cortical connectivity between spatially remote primary auditory and visual cortices could lead to deficient integration of simple AV information.
Very Early MSI Effects
Also unexpected was the finding from exploratory SCP analyses of a period of very early AV integration (onsetting at about 40 ms) over parieto-occipital scalp, that was exclusive to the older TD group (Fig. 7). We and others have observed a similar period of early-stage AV MSI in adults (e.g., Giard and Peronnet 1999; Molholm et al. 2002), but had not specifically designed the current study to be sensitive to such early modulation (see Molholm et al. 2002) and had failed to observe the same in our recent developmental study (Brandwein et al. 2011). We are cautious about drawing strong conclusions from this finding, especially because a between-group analysis of this very early effect did not reach significance. However, one possibility is that the cortical connections that contribute to very early MSI develop over childhood and are not yet stable in adolescence. A study powered to test this hypothesis and specifically designed to be sensitive to early modulations is needed.
Developmental Course of MSI in ASD
By directly comparing data from older and younger groups, we were able to track the developmental course of basic AV processing in ASD. This is particularly important given that ASD is characterized by delays in specific developmental milestones and atypical developmental trajectories. The developmental nature of ASD with respect to AV integration is highlighted by preliminary findings from our laboratory using an AV speech-in-noise paradigm (Foxe et al. 2009) and findings from another study by Taylor et al. (2010), both of which indicate that children with ASD “catch up” to their same-aged peers on AV MSI in their teenage years, at least when it involves AV speech. In contrast, the current data suggest that integration of simple AV stimuli is fundamentally different, not developmentally delayed or simply immature in ASD. Moreover, the lack of significant race-model violation in the children with ASD suggests that in addition to being different, the neural processes involved in integrating the AV information are less efficient than in children with TD.
Conclusions
Findings from the current study provide evidence that children with ASD integrate even very basic, nonsocial AV stimuli differently and less effectively than children with TD. Neural indices of MSI indicate that children with ASD rely on different cortical regions at a relatively early stage of information processing, as shown by topographical analysis (Fig. 6d). These findings strongly point to a general deficit in AV integration that is independent of social or high-order cognitive deficits. While it is unlikely that impairments in basic MSI, such as those demonstrated here, can account for the entire constellation of symptoms observed in ASD, both could result from common underlying differences in connectivity and it is not difficult to see how disruptions in fundamental integration of basic sensory information might contribute to social and communicative deficits characteristic of individuals with ASD. For example, suboptimal integration of AV inputs may make it more difficult for young children to benefit from the redundant visual-articulatory information that supports language learning independent of any biases compromising the processing of “social” stimuli. Atypical connections between sensory cortices and more anterior and integrative brain areas may disrupt the formation of meaningful relationships between congruent auditory and visual inputs. That said, it is possible that more ecologically valid stimuli and/or a more challenging task than the one employed here might bring out “work-around” strategies in the children with autism that allow them to compensate for these early impairments in automatic multisensory processing. Though highly speculative, it may be that for important functions such as speech recognition, compensatory processes involving frontal lobe development (e.g., improvements in executive function) contribute to the “catching up” observed in some behavioral studies of AV integration in ASD over childhood (Foxe et al. 2009; Taylor et al. 2010).
Funding
This work was primarily supported by a grant from the U.S. National Institute of Mental Health (MH085322 to S.M. and J.J.F.). Additional pilot support during protocol development was provided by Cure Autism Now (J.J.F.) and the Wallace Research Foundation (J.J.F. and S.M.). The Human Clinical Phenotyping Core, where the children enrolled in this study were clinically evaluated, is a facility of the Rose F. Kennedy Intellectual and Developmental Disabilities Research Center (IDDRC) which is funded through a center grant from the Eunice Kennedy Shriver National Institute of Child Health & Human Development (NICHD P30 HD071593).
Notes
The authors wish to express their sincere appreciation to Dr Juliana Bates, Daniella Blanco, Sarah Ruberman, Snigdha Banerjee, Kristina Dumas, Joanna Peters, and Frantzy Acluche for their valuable support over the course of this project. We also extend our heartfelt gratitude to the children and families that have contributed their time to participate in this research. N.N.R. received additional support from a Postdoctoral Research Grant from the Fondation du Québec de Recherche sur la Société et la Culture, and T.S.A. received support from a Robert Gilleece Predoctoral Fellowship through the Program in Cognitive Neuroscience at City College of New York. N.N.R. is now at Syracuse University in the Department of Psychology. The authors would also like to acknowledge the contributions of the staff at the Human Clinical Phenotyping Core (HCP) of the Rose F. Kennedy Intellectual and Developmental Disabilities Research Center (IDDRC) during the recruitment and clinical classification of a portion of the participants who served in this study.
References
- Anagnostou E, Taylor MJ. Review of neuroimaging in autism spectrum disorders: what have we learned and where we go from here. Mol Autism. 2011;2:4. doi: 10.1186/2040-2392-2-4. doi:10.1186/2040-2392-2-4. [DOI] [PMC free article] [PubMed] [Google Scholar]
- APA. Diagnostic and statistical manual of mental disorders: DSM-IV-TR, 4th ed., text revision. Washington (DC): American Psychiatric Association; 2000. [Google Scholar]
- Asperger H. Die “Autistischen Psychopathen” im Kindesalter. Eur Arch Psychiatry Clin Neurosci. 1944;117:76–136. doi:10.1007/BF01837709. [Google Scholar]
- Ayres AJ, Tickle LS. Hyper-responsivity to touch and vestibular stimuli as a predictor of positive response to sensory integration procedures by autistic children. Am J Occup Ther. 1980;34:375–381. doi: 10.5014/ajot.34.6.375. [DOI] [PubMed] [Google Scholar]
- Bair WN, Kiemel T, Jeka JJ, Clark JE. Development of multisensory reweighting for posture control in children. Exp Brain Res. 2007;183:435–446. doi: 10.1007/s00221-007-1057-2. doi:10.1007/s00221-007-1057-2. [DOI] [PMC free article] [PubMed] [Google Scholar]
- Barnea-Goraly N, Kwon H, Menon V, Eliez S, Lotspeich L, Reiss AL. White matter structure in autism: preliminary evidence from diffusion tensor imaging. Biol Psychiatry. 2004;55:323–326. doi: 10.1016/j.biopsych.2003.10.022. doi:10.1016/j.biopsych.2003.10.022. [DOI] [PubMed] [Google Scholar]
- Baron-Cohen S, Richler J, Bisarya D, Gurunathan N, Wheelwright S. The systematizing quotient: an investigation of adults with Asperger syndrome or high-functioning autism, and normal sex differences. In: Frith U, Hill CE, editors. Autism: mind and brain. Oxford: Oxford University Press; 2003. [Google Scholar]
- Belmonte MK, Allen G, Beckel-Mitchener A, Boulanger LM, Carper RA, Webb SJ. Autism and abnormal development of brain connectivity. J Neurosci. 2004;24:9228–9231. doi: 10.1523/JNEUROSCI.3340-04.2004. doi:10.1523/JNEUROSCI.3340-04.2004. [DOI] [PMC free article] [PubMed] [Google Scholar]
- Ben-Sasson A, Hen L, Fluss R, Cermack S, Engel-Yeger B, Gal E. A meta-analysis of sensory modulation symptoms in individuals with autism spectrum disorders. J Autism Dev Disord. 2009;39:1–11. doi: 10.1007/s10803-008-0593-3. doi:10.1007/s10803-008-0593-3. [DOI] [PubMed] [Google Scholar]
- Bergman P, Escalona S. Unusual sensitivities in very young children. Psychoanal Study Child. 1949;4:333–352. [Google Scholar]
- Brandwein AB, Foxe JJ, Russo NN, Altschuler TS, Gomes H, Molholm S. The development of audiovisual multisensory integration across childhood and early adolescence: a high-density electrical mapping study. Cereb Cortex. 2011;21:1042–1055. doi: 10.1093/cercor/bhq170. doi:10.1093/cercor/bhq170. [DOI] [PMC free article] [PubMed] [Google Scholar]
- Butler JS, Molholm S, Fiebelkorn IC, Mercier MR, Schwartz TH, Foxe JJ. Common or redundant neural circuits for duration processing across audition and touch. J Neurosci. 2011;31:3400–3406. doi: 10.1523/JNEUROSCI.3296-10.2011. doi:10.1523/JNEUROSCI.3296-10.2011. [DOI] [PMC free article] [PubMed] [Google Scholar]
- Buxhoeveden DP, Semendeferi K, Buckwalter J, Schenker N, Switzer R, Courchesne E. Reduced minicolumns in the frontal cortex of patients with autism. Neuropathol Appl Neurobiol. 2006;32:483–491. doi: 10.1111/j.1365-2990.2006.00745.x. doi:10.1111/j.1365-2990.2006.00745.x. [DOI] [PubMed] [Google Scholar]
- Casanova MF, Buxhoeveden DP, Switala AE, Roy E. Minicolumnar pathology in autism. Neurology. 2002;58:428–432. doi: 10.1212/wnl.58.3.428. [DOI] [PubMed] [Google Scholar]
- Ceponiene R, Rinne T, Naatanen R. Maturation of cortical sound processing as indexed by event-related potentials. Clin Neurophysiol. 2002;113:870–882. doi: 10.1016/s1388-2457(02)00078-0. doi:10.1016/S1388-2457(02)00078-0. [DOI] [PubMed] [Google Scholar]
- Cheung P, Sui A. A comparison of patterns of sensory processing in children with and without developmental disabilities. Res Dev Disabil. 2009;30:1468–1480. doi: 10.1016/j.ridd.2009.07.009. doi:10.1016/j.ridd.2009.07.009. [DOI] [PubMed] [Google Scholar]
- Courchesne E, Pierce K. Brain overgrowth in autism during a critical time in development: implications for frontal pyramidal neuron and interneuron development and connectivity. Int J Dev Neurosci. 2005;23:153–170. doi: 10.1016/j.ijdevneu.2005.01.003. doi:10.1016/j.ijdevneu.2005.01.003. [DOI] [PubMed] [Google Scholar]
- Courchesne E, Redcay E, Morgan JT, Kennedy DP. Autism at the beginning: microstructural and growth abnormalities underlying the cognitive and behavioral phenotype of autism. Dev Psychopathol. 2005;17:577–597. doi: 10.1017/S0954579405050285. doi:10.1017/S0954579405050285. [DOI] [PubMed] [Google Scholar]
- Crane L, Goddard L, Pring L. Sensory processing in adults with autism spectrum disorders. Autism. 2009;13:215–228. doi: 10.1177/1362361309103794. doi:10.1177/1362361309103794. [DOI] [PubMed] [Google Scholar]
- de Gelder B, Vroomen J, van der Heide L. Face recognition and lip-reading in autism. Eur J Cognit Psychol. 1991;3:69–86. doi:10.1080/09541449108406220. [Google Scholar]
- Dunn M, Gomes H, Gravel J. Mismatch negativity in children with autism and typical development. J Autism Dev Disord. 2008;38:52–71. doi: 10.1007/s10803-007-0359-3. doi:10.1007/s10803-007-0359-3. [DOI] [PubMed] [Google Scholar]
- Fiebelkorn IC, Foxe JJ, Butler JS, Molholm S. Auditory facilitation of visual-target detection persists regardless of retinal eccentricity and despite wide audiovisual misalignments. Exp Brain Res. 2011;213:167–174. doi: 10.1007/s00221-011-2670-7. doi:10.1007/s00221-011-2670-7. [DOI] [PubMed] [Google Scholar]
- Flom R, Bahrick LE. The development of infant discrimination of affect in multimodal and unimodal stimulation: the role of intersensory redundancy. Dev Psychol. 2007;43:238–252. doi: 10.1037/0012-1649.43.1.238. doi:10.1037/0012-1649.43.1.238. [DOI] [PMC free article] [PubMed] [Google Scholar]
- Foss-Feig JH, Kwakye LD, Cascio CJ, Burnette CP, Kadivar H, Stone WL, Wallace MT. An extended multisensory temporal binding window in autism spectrum disorders. Exp Brain Res. 2010;203:381–389. doi: 10.1007/s00221-010-2240-4. doi:10.1007/s00221-010-2240-4. [DOI] [PMC free article] [PubMed] [Google Scholar]
- Foxe JJ, Molholm S. Ten years at the Multisensory Forum: musings on the evolution of a field. Brain Topogr. 2009;21:149–154. doi: 10.1007/s10548-009-0102-9. doi:10.1007/s10548-009-0102-9. [DOI] [PubMed] [Google Scholar]
- Foxe JJ, Morocz IA, Murray MM, Higgins BA, Javitt DC, Schroeder CE. Multisensory auditory–somatosensory interactions in early cortical processing revealed by high-density electrical mapping. Brain Res Cogn Brain Res. 2000;10:77–83. doi: 10.1016/s0926-6410(00)00024-0. doi:10.1016/S0926-6410(00)00024-0. [DOI] [PubMed] [Google Scholar]
- Foxe JJ, Ross LA, Saint-Amour D, Leavitt VM, Blanco D, Molholm S. 10th International Multisensory Research Forum (IMRF) New York: 2009. The breakdown of multisensory speech perception in autism and schizophrenia; pp. 309–310. [Google Scholar]
- Foxe JJ, Schroeder C. The case for feedforward multisensory convergence during early cortical processing. Neuroreport. 2005;16:419–423. doi: 10.1097/00001756-200504040-00001. doi:10.1097/00001756-200504040-00001. [DOI] [PubMed] [Google Scholar]
- Foxe JJ, Simpson G. Flow of activation from V1 to frontal cortex in humans: a framework for defining “early” visual processing. Exp Brain Res. 2002;142:139–150. doi: 10.1007/s00221-001-0906-7. doi:10.1007/s00221-001-0906-7. [DOI] [PubMed] [Google Scholar]
- Foxe JJ, Wylie GR, Martinez A, Schroeder CE, Javitt DC, Guilfoyle D, Ritter W, Murray MM. Auditory–somatosensory multisensory processing in auditory association cortex: an fMRI study. J Neurophysiol. 2002;88:540–543. doi: 10.1152/jn.2002.88.1.540. [DOI] [PubMed] [Google Scholar]
- Giard MH, Peronnet F. Auditory-visual integration during multimodal object recognition in humans: a behavioral and electrophysiological study. J Cogn Neurosci. 1999;11:473–490. doi: 10.1162/089892999563544. doi:10.1162/089892999563544. [DOI] [PubMed] [Google Scholar]
- Gingras G, Rowland BA, Stein BE. The differing impact of multisensory and unisensory integration on behavior. J Neurosci. 2009;29:4897–4902. doi: 10.1523/JNEUROSCI.4120-08.2009. doi:10.1523/JNEUROSCI.4120-08.2009. [DOI] [PMC free article] [PubMed] [Google Scholar]
- Gomes H, Dunn M, Ritter W, Kurtzberg D, Brattson A, Kreuzer JA, Vaughan HG., Jr Spatiotemporal maturation of the central and lateral N1 components to tones. Brain Res Dev Brain Res. 2001;129:147–155. doi: 10.1016/s0165-3806(01)00196-1. doi:10.1016/S0165-3806(01)00196-1. [DOI] [PubMed] [Google Scholar]
- Gori M, Del Viva M, Sandini G, Burr DC. Young children do not integrate visual and haptic form information. Curr Biol. 2008;18:694–698. doi: 10.1016/j.cub.2008.04.036. doi:10.1016/j.cub.2008.04.036. [DOI] [PubMed] [Google Scholar]
- Guthrie D, Buchwald JS. Significance testing of difference potentials. Psychophysiology. 1991;28:240–244. doi: 10.1111/j.1469-8986.1991.tb00417.x. doi:10.1111/j.1469-8986.1991.tb00417.x. [DOI] [PubMed] [Google Scholar]
- Hermelin B, O'Connor N. Psychological experiments with autistic children. Oxford, UK: Pergamon Press; 1970. [Google Scholar]
- Hileman CM, Henderson H, Mundy P, Newell L, Jaime M. Developmental and individual differences on the P1 and N170 ERP components in children with and without autism. Dev Neuropsychol. 2011;36:214–236. doi: 10.1080/87565641.2010.549870. doi:10.1080/87565641.2010.549870. [DOI] [PMC free article] [PubMed] [Google Scholar]
- Hill EL, Frith U. Understanding autism: insights from mind and brain. In: Frith U, Hill EL, editors. Autism: mind and brain. Oxford: Oxford University Press; 2003. [DOI] [PMC free article] [PubMed] [Google Scholar]
- Hillock AR, Powers AR, Wallace MT. Binding of sights and sounds: age-related changes in multisensory temporal processing. Neuropsychologia. 2011;49:461–467. doi: 10.1016/j.neuropsychologia.2010.11.041. doi:10.1016/j.neuropsychologia.2010.11.041. [DOI] [PMC free article] [PubMed] [Google Scholar]
- Hirai M, Watanabe S, Honda Y, Kakigi R. Developmental changes in point-light walker processing during childhood and adolescence: an event-related potential study. Neuroscience. 2009;161:311–325. doi: 10.1016/j.neuroscience.2009.03.026. doi:10.1016/j.neuroscience.2009.03.026. [DOI] [PubMed] [Google Scholar]
- Iarocci G, Rombough A, Yager J, Weeks DJ, Chua R. Visual influences on speech perception in children with autism. Autism. 2010;14:305–320. doi: 10.1177/1362361309353615. doi:10.1177/1362361309353615. [DOI] [PubMed] [Google Scholar]
- Irwin JR, Tornatore LA, Brancazio L, Whalen DH. Can children with autism spectrum disorders “hear” a speaking face? Child Dev. 2011;85:1397–1403. doi: 10.1111/j.1467-8624.2011.01619.x. [DOI] [PMC free article] [PubMed] [Google Scholar]
- Just MA, Cherkassky VL, Keller TA, Kana RK, Minshew NJ. Functional and anatomical cortical underconnectivity in autism: evidence from an FMRI study of an executive function task and corpus callosum morphometry. Cereb Cortex. 2007;17:951–961. doi: 10.1093/cercor/bhl006. doi:10.1093/cercor/bhl006. [DOI] [PMC free article] [PubMed] [Google Scholar]
- Just MA, Cherkassky VL, Keller TA, Minshew NJ. Cortical activation and synchronization during sentence comprehension in high-functioning autism: evidence of underconnectivity. Brain. 2004;127:1811–1821. doi: 10.1093/brain/awh199. doi:10.1093/brain/awh199. [DOI] [PubMed] [Google Scholar]
- Kanner L. Autistic disturbances of affective contact. Nervous Child. 1943;2:217–250. [PubMed] [Google Scholar]
- Kern J, Trivedi M, Garver C, Grannemann B, Andrews A, Salva J, Johnson D, Mehta J, Schroeder J. The pattern of sensory processing abnormalities in autism. Autism. 2006;10:480–494. doi: 10.1177/1362361306066564. doi:10.1177/1362361306066564. [DOI] [PubMed] [Google Scholar]
- Kern J, Trivedi M, Grannemann B, Garver C, Johnson D, Andrews A, Salva J, Mehta J, Schroeder J. Sensory correlations in autism. Autism. 2007;11:123–134. doi: 10.1177/1362361307075702. doi:10.1177/1362361307075702. [DOI] [PubMed] [Google Scholar]
- Kientz MA, Dunn W. A comparison of the performance of children with and without autism on the sensory profile. Am J Occup Ther. 1997;51:530–537. doi: 10.5014/ajot.51.7.530. doi:10.5014/ajot.51.7.530. [DOI] [PubMed] [Google Scholar]
- Klemen J, Chambers CD. Current perspectives and methods in studying neural mechanisms of multisensory interactions. Neurosci Biobehav Rev. 2012;36:111–133. doi: 10.1016/j.neubiorev.2011.04.015. doi:10.1016/j.neubiorev.2011.04.015. [DOI] [PubMed] [Google Scholar]
- Kogan MD, Blumberg SJ, Schieve LA, Boyle CA, Perrin JM, Ghandour RM, Singh GK, Strickland BB, Trevathan E, van Dyck PC. Prevalence of parent-reported diagnosis of autism spectrum disorder among children in the US, 2007. Pediatrics. 2009;124:1395–1403. doi: 10.1542/peds.2009-1522. doi:10.1542/peds.2009-1522. [DOI] [PubMed] [Google Scholar]
- Koshino H, Kana RK, Keller TA, Cherkassky VL, Minshew NJ, Just MA. fMRI investigation of working memory for faces in autism: visual coding and underconnectivity with frontal areas. Cereb Cortex. 2008;18:289–300. doi: 10.1093/cercor/bhm054. doi:10.1093/cercor/bhm054. [DOI] [PMC free article] [PubMed] [Google Scholar]
- Kuefner D, de Heering A, Jacques C, Palmero-Soler E, Rossion B. Early visually evoked electrophysiological responses over the human brain (P1, N170) show stable patterns of face-sensitivity from 4 years to adulthood. Front Hum Neurosci. 2010;3:67. doi: 10.3389/neuro.09.067.2009. [DOI] [PMC free article] [PubMed] [Google Scholar]
- Kwakye LD, Foss-Feig JH, Cascio CJ, Stone WL, Wallace MT. Altered auditory and multisensory temporal processing in autism spectrum disorders. Front Integr Neurosci. 2011;4:129. doi: 10.3389/fnint.2010.00129. [DOI] [PMC free article] [PubMed] [Google Scholar]
- Lane AE, Dennis SJ, Geraghty ME. Brief report: further evidence of sensory subtypes in autism. J Autism Dev Disord. 2011;41:826–831. doi: 10.1007/s10803-010-1103-y. [DOI] [PubMed] [Google Scholar]
- Lane AE, Young RL, Baker AE, Angley MT. Sensory processing subtypes in autism: association with adaptive behavior. J Autism Dev Disord. 2010;40:112–122. doi: 10.1007/s10803-009-0840-2. doi:10.1007/s10803-009-0840-2. [DOI] [PubMed] [Google Scholar]
- Lewkowicz DJ. Learning and discrimination of audiovisual events in human infants: the hierarchical relation between intersensory temporal synchrony and rhythmic pattern cues. Dev Psychol. 2003;39:795–804. doi: 10.1037/0012-1649.39.5.795. doi:10.1037/0012-1649.39.5.795. [DOI] [PubMed] [Google Scholar]
- Lewkowicz DJ, Ghazanfar AA. The emergence of multisensory systems through perceptual narrowing. Trends Cogn Sci. 2009;13:470–478. doi: 10.1016/j.tics.2009.08.004. doi:10.1016/j.tics.2009.08.004. [DOI] [PubMed] [Google Scholar]
- Lippe S, Roy MS, Perchet C, Lassonde M. Electrophysiological markers of visuocortical development. Cereb Cortex. 2007;17:100–107. doi: 10.1093/cercor/bhj130. doi:10.1093/cercor/bhj130. [DOI] [PubMed] [Google Scholar]
- Lord C, Rutter M, DiLavore PC, Risi S. Autism diagnostic interview-revised: a revised version of a diagnostic interview for caregivers of individuals with possible pervasive developmental disorders. J Autism Dev Disord. 1994;24:659–685. doi: 10.1007/BF02172145. doi:10.1007/BF02172145. [DOI] [PubMed] [Google Scholar]
- Lord C, Rutter M, DiLavore PC, Risi S. Autism diagnostic observation schedule. Los Angeles (CA): Western Psychological Services; 1999. [Google Scholar]
- Ma WJ, Zhou X, Ross LA, Foxe JJ, Parra LC. Lip-reading aids word recognition most in moderate noise: a Bayesian explanation using high-dimensional feature space. PLoS ONE. 2009;4:e4638. doi: 10.1371/journal.pone.0004638. doi:10.1371/journal.pone.0004638. [DOI] [PMC free article] [PubMed] [Google Scholar]
- Magnee MJ, de Gelder B, van Engeland H, Kemner C. Audiovisual speech integration in pervasive developmental disorder: evidence from event-related potentials. J Child Psychol Psychiatry. 2008;49:995–1000. doi: 10.1111/j.1469-7610.2008.01902.x. doi:10.1111/j.1469-7610.2008.01902.x. [DOI] [PubMed] [Google Scholar]
- Manly BF. Randomization and Monte Carlo methods in biology. London: Chapman & Hall; 1991. [Google Scholar]
- Marco EJ, Hinkley LB, Hill SS, Nagarajan SS. Sensory processing in autism: a review of neurophysiologic findings. Pediatr Res. 2011;69:48R–54R. doi: 10.1203/PDR.0b013e3182130c54. doi:10.1203/PDR.0b013e3182130c54. [DOI] [PMC free article] [PubMed] [Google Scholar]
- Miller J. Divided attention: evidence for coactivation with redundant signals. Cogn Psychol. 1982;14:247–279. doi: 10.1016/0010-0285(82)90010-x. doi:10.1016/0010-0285(82)90010-X. [DOI] [PubMed] [Google Scholar]
- Molholm S, Martinez A, Shpaner M, Foxe JJ. Object-based attention is multisensory: co-activation of an object's representations in ignored sensory modalities. Eur J Neurosci. 2007;26:499–509. doi: 10.1111/j.1460-9568.2007.05668.x. doi:10.1111/j.1460-9568.2007.05668.x. [DOI] [PubMed] [Google Scholar]
- Molholm S, Ritter W, Javitt DC, Foxe JJ. Multisensory visual-auditory object recognition in humans: a high-density electrical mapping study. Cereb Cortex. 2004;14:452–465. doi: 10.1093/cercor/bhh007. doi:10.1093/cercor/bhh007. [DOI] [PubMed] [Google Scholar]
- Molholm S, Ritter W, Murray MM, Javitt DC, Schroeder CE, Foxe JJ. Multisensory auditory-visual interactions during early sensory processing in humans: a high-density electrical mapping study. Brain Res Cogn Brain Res. 2002;14:115–128. doi: 10.1016/s0926-6410(02)00066-6. doi:10.1016/S0926-6410(02)00066-6. [DOI] [PubMed] [Google Scholar]
- Mongillo EA, Irwin JR, Whalen DH, Klaiman C, Carter AS, Schultz RT. Audiovisual processing in children with and without autism spectrum disorders. J Autism Dev Disord. 2008;38:1349–1358. doi: 10.1007/s10803-007-0521-y. doi:10.1007/s10803-007-0521-y. [DOI] [PubMed] [Google Scholar]
- Muller RA. The study of autism as a distributed disorder. Ment Retard Dev Disabil Res Rev. 2007;13:85–95. doi: 10.1002/mrdd.20141. doi:10.1002/mrdd.20141. [DOI] [PMC free article] [PubMed] [Google Scholar]
- Muller RA, Shih P, Keehn B, Deyoe JR, Leyden KM, Shukla DK. Underconnected, but how? A survey of functional connectivity MRI studies in autism spectrum disorders. Cereb Cortex. 2011;21:2233–2243. doi: 10.1093/cercor/bhq296. doi:10.1093/cercor/bhq296. [DOI] [PMC free article] [PubMed] [Google Scholar]
- Murray MM, Molholm S, Michel CM, Heslenfeld DJ, Ritter W, Javitt DC, Schroeder CE, Foxe JJ. Grabbing your ear: rapid auditory–somatosensory multisensory interactions in low-level sensory cortices are not constrained by stimulus alignment. Cereb Cortex. 2005;15:963–974. doi: 10.1093/cercor/bhh197. doi:10.1093/cercor/bhh197. [DOI] [PubMed] [Google Scholar]
- Neil PA, Chee-Ruiter C, Scheier C, Lewkowicz DJ, Shimojo S. Development of multisensory spatial integration and perception in humans. Dev Sci. 2006;9:454–464. doi: 10.1111/j.1467-7687.2006.00512.x. doi:10.1111/j.1467-7687.2006.00512.x. [DOI] [PubMed] [Google Scholar]
- O'Neill M, Jones RS. Sensory-perceptual abnormalities in autism: a case for more research? J Autism Dev Disord. 1997;27:283–293. doi: 10.1023/a:1025850431170. doi:10.1023/A:1025850431170. [DOI] [PubMed] [Google Scholar]
- Ozonoff S, Pennington BF, Rogers SJ. Executive function deficits in high-functioning autistic individuals: relationship to theory of mind. J Child Psychol Psychiatry. 1991;32:1081–1105. doi: 10.1111/j.1469-7610.1991.tb00351.x. doi:10.1111/j.1469-7610.1991.tb00351.x. [DOI] [PubMed] [Google Scholar]
- Perrin F, Pernier J, Bertrand O, Echallier JF. Spherical splines for scalp potential and current density mapping. Electroencephalogr Clin Neurophysiol. 1989;72:184–187. doi: 10.1016/0013-4694(89)90180-6. doi:10.1016/0013-4694(89)90180-6. [DOI] [PubMed] [Google Scholar]
- Perrin F, Pernier J, Bertrand O, Giard MH, Echallier JF. Mapping of scalp potentials by surface spline interpolation. Electroencephalogr Clin Neurophysiol. 1987;66:75–81. doi: 10.1016/0013-4694(87)90141-6. doi:10.1016/0013-4694(87)90141-6. [DOI] [PubMed] [Google Scholar]
- Ponton CW, Eggermont JJ, Kwong B, Don M. Maturation of human central auditory system activity: evidence from multi-channel evoked potentials. Clin Neurophysiol. 2000;111:220–236. doi: 10.1016/s1388-2457(99)00236-9. doi:10.1016/S1388-2457(99)00236-9. [DOI] [PubMed] [Google Scholar]
- Rippon G, Brock J, Brown C, Boucher J. Disordered connectivity in the autistic brain: challenges for the “new psychophysiology”. Int J Psychophysiol. 2007;63:164–172. doi: 10.1016/j.ijpsycho.2006.03.012. doi:10.1016/j.ijpsycho.2006.03.012. [DOI] [PubMed] [Google Scholar]
- Rogers SJ, Ozonoff S. Annotation: what do we know about sensory dysfunction in autism? A critical review of the empirical evidence. J Child Psychol Psychiatry. 2005;46:1255–1268. doi: 10.1111/j.1469-7610.2005.01431.x. doi:10.1111/j.1469-7610.2005.01431.x. [DOI] [PubMed] [Google Scholar]
- Ross LA, Molholm S, Blanco D, Gomez-Ramirez M, Saint-Amour D, Foxe JJ. The development of multisensory speech perception continues into the late childhood years. Eur J Neurosci. 2011;33:2329–2337. doi: 10.1111/j.1460-9568.2011.07685.x. doi:10.1111/j.1460-9568.2011.07685.x. [DOI] [PMC free article] [PubMed] [Google Scholar]
- Ross LA, Saint-Amour D, Leavitt VM, Javitt DC, Foxe JJ. Do you see what I am saying? Exploring visual enhancement of speech comprehension in noisy environments. Cereb Cortex. 2007a;17:1147–1153. doi: 10.1093/cercor/bhl024. doi:10.1093/cercor/bhl024. [DOI] [PubMed] [Google Scholar]
- Ross LA, Saint-Amour D, Leavitt VM, Molholm S, Javitt DC, Foxe JJ. Impaired multisensory processing in schizophrenia: deficits in the visual enhancement of speech comprehension under noisy environmental conditions. Schizophr Res. 2007b;97:173–183. doi: 10.1016/j.schres.2007.08.008. doi:10.1016/j.schres.2007.08.008. [DOI] [PubMed] [Google Scholar]
- Russo N, Foxe JJ, Brandwein AB, Altschuler T, Gomes H, Molholm S. Multisensory processing in children with autism: high-density electrical mapping of auditory–somatosensory integration. Autism Res. 2010;3:253–267. doi: 10.1002/aur.152. doi:10.1002/aur.152. [DOI] [PubMed] [Google Scholar]
- Schipul SE, Keller TA, Just MA. Inter-regional brain communication and its disturbance in autism. Front Syst Neurosci. 2011;5:10. doi: 10.3389/fnsys.2011.00010. [DOI] [PMC free article] [PubMed] [Google Scholar]
- Schultz RT, Grelotti DJ, Klin A, Kleinman J, Van der Gaag C, Marois R, Skudlarksi P. The role of the fusiform face area in social cognition: implications for the pathobiology of autism. In: Frith U, Hill CE, editors. Autism: mind and brain. Oxford: Oxford University Press; 2003. [DOI] [PMC free article] [PubMed] [Google Scholar]
- Senkowski D, Saint-Amour D, Gruber T, Foxe JJ. Look who's talking: the deployment of visuo-spatial attention during multisensory speech processing under noisy environmental conditions. Neuroimage. 2008;43:379–387. doi: 10.1016/j.neuroimage.2008.06.046. doi:10.1016/j.neuroimage.2008.06.046. [DOI] [PMC free article] [PubMed] [Google Scholar]
- Smith EG, Bennetto L. Audiovisual speech integration and lipreading in autism. J Child Psychol Psychiatry. 2007;48:813–821. doi: 10.1111/j.1469-7610.2007.01766.x. doi:10.1111/j.1469-7610.2007.01766.x. [DOI] [PubMed] [Google Scholar]
- Stein B, Meredith MA, Huneycutt WS, McDade L. Behavioral indices of multisensory integration: orientation to visual cues is affected by auditory stimuli. J Cogn Neurosci. 1989;1:12–24. doi: 10.1162/jocn.1989.1.1.12. doi:10.1162/jocn.1989.1.1.12. [DOI] [PubMed] [Google Scholar]
- Stein BE, Huneycutt WS, Meredith MA. Neurons and behavior: the same rules of multisensory integration apply. Brain Res. 1988;448:355–358. doi: 10.1016/0006-8993(88)91276-0. doi:10.1016/0006-8993(88)91276-0. [DOI] [PubMed] [Google Scholar]
- Stein BE, Rowland BA. Organization and plasticity in multisensory integration: early and late experience affects its governing principles. Prog Brain Res. 2011;191:145–163. doi: 10.1016/B978-0-444-53752-2.00007-2. doi:10.1016/B978-0-444-53752-2.00007-2. [DOI] [PMC free article] [PubMed] [Google Scholar]
- Stein BE, Stanford TR, Ramachandran R, Perrault TJ, Jr, Rowland BA. Challenges in quantifying multisensory integration: alternative criteria, models, and inverse effectiveness. Exp Brain Res. 2009;198:113–126. doi: 10.1007/s00221-009-1880-8. doi:10.1007/s00221-009-1880-8. [DOI] [PMC free article] [PubMed] [Google Scholar]
- Talsma D, Doty TJ, Woldorff MG. Selective attention and audiovisual integration: is attending to both modalities a prerequisite for early integration? Cereb Cortex. 2007;17:679–690. doi: 10.1093/cercor/bhk016. doi:10.1093/cercor/bhk016. [DOI] [PubMed] [Google Scholar]
- Taylor N, Isaac C, Milne E. A comparison of the development of audiovisual integration in children with autism spectrum disorders and typically developing children. J Autism Dev Disord. 2010;40:1403–1411. doi: 10.1007/s10803-010-1000-4. doi:10.1007/s10803-010-1000-4. [DOI] [PubMed] [Google Scholar]
- Teder-Salejarvi WA, McDonald JJ, Di Russo F, Hillyard SA. An analysis of audio-visual crossmodal integration by means of event-related potential (ERP) recordings. Brain Res Cogn Brain Res. 2002;14:106–114. doi: 10.1016/s0926-6410(02)00065-4. doi:10.1016/S0926-6410(02)00065-4. [DOI] [PubMed] [Google Scholar]
- Ulrich R, Miller J, Schroter H. Testing the race model inequality: an algorithm and computer programs. Behav Res Methods. 2007;39:291–302. doi: 10.3758/bf03193160. doi:10.3758/BF03193160. [DOI] [PubMed] [Google Scholar]
- van der Smagt MJ, van Engeland H, Kemner C. Brief report: can you see what is not there? Low-level auditory-visual integration in autism spectrum disorder. J Autism Dev Disord. 2007;37:2014–2019. doi: 10.1007/s10803-006-0346-0. doi:10.1007/s10803-006-0346-0. [DOI] [PubMed] [Google Scholar]
- Wallace MT, Roberson GE, Hairston WD, Stein BE, Vaughan JW, Schirillo JA. Unifying multisensory signals across time and space. Exp Brain Res. 2004;158:252–258. doi: 10.1007/s00221-004-1899-9. [DOI] [PubMed] [Google Scholar]
- Wass S. Distortions and disconnections: disrupted brain connectivity in autism. Brain Cogn. 2011;75:18–28. doi: 10.1016/j.bandc.2010.10.005. doi:10.1016/j.bandc.2010.10.005. [DOI] [PubMed] [Google Scholar]
- Wechsler D. Wechsler abbreviated scale of intelligence. San Antonio (TX): Psychological Corporation; 1999. [Google Scholar]
- Werner S, Noppeney U. Distinct functional contributions of primary sensory and association areas to audiovisual integration in object categorization. J Neurosci. 2010;30:2662–2675. doi: 10.1523/JNEUROSCI.5091-09.2010. doi:10.1523/JNEUROSCI.5091-09.2010. [DOI] [PMC free article] [PubMed] [Google Scholar]
- Williams JH, Massaro DW, Peel NJ, Bosseler A, Suddendorf T. Visual-auditory integration during speech imitation in autism. Res Dev Disabil. 2004;25:559–575. doi: 10.1016/j.ridd.2004.01.008. doi:10.1016/j.ridd.2004.01.008. [DOI] [PubMed] [Google Scholar]
- Wing L. The handicaps of autistic children—a comparative study. J Child Psychol Psychiatry. 1969;10:1–40. doi: 10.1111/j.1469-7610.1969.tb02066.x. doi:10.1111/j.1469-7610.1969.tb02066.x. [DOI] [PubMed] [Google Scholar]
- Zimmer U, Itthipanyanan S, Grent-'t-Jong T, Woldorff MG. The electrophysiological time course of the interaction of stimulus conflict and the multisensory spread of attention. Eur J Neurosci. 2010;31:1744–1754. doi: 10.1111/j.1460-9568.2010.07229.x. doi:10.1111/j.1460-9568.2010.07229.x. [DOI] [PMC free article] [PubMed] [Google Scholar]