

Abstract
Neuroendocrine theories of brain development hold testosterone as the predominant factor mediating sex-specific cortical growth and the ensuing lateralization of hemispheric function. However, studies to date have focussed on prenatal testosterone rather than pubertal changes in testosterone. Yet, animal studies have shown a high density of androgen-sensitive receptors in multiple key cortical areas, and puberty is known to coincide with both a significant rise in testosterone and the emergence of behavioral sex differences, suggesting peripubertal influences of testosterone on brain development. Here, we used linear mixed models to examine sex-specific cortical maturation associated with changes in testosterone levels in a longitudinal sample of developmentally healthy children and adolescents. A significant “sex by age by testosterone” interaction on cortical thickness (CTh) involving widespread areas of the developing brain was found. Testosterone levels were associated with CTh changes in regions of the left hemisphere in males and of the right hemisphere in females. In both sexes, the relationship between testosterone and CTh varied across the age span. These findings show the association between testosterone and CTh to be complex, highly dynamic, and to vary, depending on sex and age; they also suggest sex-related hemispheric lateralization effects of testosterone in humans.
Keywords: androgens, brain development, gray matter, puberty, sex
Introduction
Testosterone is thought to play an important role in sexual differentiation of the central nervous system, given the extent to which it crosses the blood–brain barrier (Kimura 2000), as well as observations that in males, presumably due to testosterone-related lateralization effects, the left hemisphere undergoes more restricted growth than the right hemisphere in utero (Geschwind and Galaburda 1985). Previous animal studies identified androgen receptors in multiple cortical areas (Goldstein et al. 2001), as well as a sex-specific effect in which testosterone appears to protect against neuronal loss in females (Davis et al. 1996), suggesting not only that testosterone plays a role in brain development, but also that it may significantly modulate development of the cortex, a part of the brain known to retain plasticity throughout adolescence and even throughout adulthood (Draganski et al. 2002, 2004; Haier et al. 2009). Further confirming this, a recent human study examining the relationship between cortical thickness (CTh) changes across adolescence and specific androgen receptor genotype/activity reveals dynamic sex-specific and androgen receptor-specific changes in gray matter (GM) across puberty (Raznahan et al. 2010). Yet, most reports examining testosterone-related effects on the human brain have used functional magnetic resonance imaging (MRI) techniques or cross-sectional designs and have been conducted on small samples, restricted age spans, or adult subjects (Goldstein et al. 2001; Azad et al. 2003; Miller et al. 2004; Archer et al. 2005; Hermans et al. 2008; Neufang et al. 2009; Peper et al. 2009; Witte et al. 2009; Bos et al. 2010; Paus et al. 2010; Bramen et al. 2011; Herbst-Damm et al. 2005).
The critical time period for testosterone-related effects is also debatable: previous reports have focussed on the perinatal and early childhood period, whereas recent observations have identified continuing effects even throughout adolescence and young adulthood (Neufang et al. 2009; Peper et al. 2009; Witte et al. 2009; Paus et al. 2010; Bramen et al. 2011). Puberty is also known to coincide with both (1) sex-specific significant increases in testosterone levels and (2) increased behavioral differentiation between sexes, suggesting that this is an important time period during which changes in testosterone levels can affect brain development (Waber et al. 2007).
Although results have varied considerably, initial studies of adolescent samples mostly found testosterone to be associated with decreases in GM volumes, particularly in the left frontal and parietal lobes (Neufang et al. 2009; Peper et al. 2009; Witte et al. 2009; Paus et al. 2010; Bramen et al. 2011). However, findings have been inconsistent between males and females, and limited regional effects have been observed, with most studies reporting instead changes in overall or lobar GM volumes. Of note, no study to date has examined testosterone-related associations with GM in a longitudinal sample including prepubertal as well as postpubertal subjects and spanning a broad age range.
Here, we examined testosterone-related longitudinal changes in CTh in children from 4 to 22 years of age using a representative, population-based sample (Evans 2006; BDC Group). Given the limitations of the current literature, only broad, exploratory hypotheses could be elicited: we expected (1) localized effects of testosterone to be more apparent in the frontal and parietal lobes (Neufang et al. 2009; Peper et al. 2009; Witte et al. 2009; Paus et al. 2010; Bramen et al. 2011), (2) positive associations between testosterone and CTh in females, given the alleged protective effects of testosterone on cortical development in females (Davis et al. 1996), and (3) a sex-specific differential effect of testosterone levels on the left compared with the right hemisphere, with males more likely to exhibit testosterone-related decreases in CTh of the left hemisphere throughout puberty, given the hypothesized effects of testosterone on hemispheric lateralization (Geschwind and Galaburda 1985).
Materials and Methods
Sampling and Recruitment
The National Institutes of Health (NIH) MRI Study of Normal Brain Development is a multisite project providing a normative database to characterize healthy brain maturation in relationship to behavior (Evans 2006). Subjects were recruited across the United States of America with a population-based sampling method seeking to achieve a representative sample in terms of income level and composition by race and ethnicity based on the US 2000 Census (Evans 2006). Informed consent from parents and child assent were obtained for all subjects. Detailed sampling methodology has been described elsewhere (Evans 2006). The Objective 1 database (release 4.0) used for this study included 433 healthy children from 4 to 22 years (226 females and 207 males), who underwent extensive cognitive, neuropsychological, and behavioral testing along with repeated MRI brain imaging every 2 years, with a maximum of 3 scans over 4 years. In order to limit the sample to developmentally healthy children, rigorous exclusion criteria were applied, including current or past treatment for diagnostic and statistical manual of mental disorders-IV axis 1 psychiatric disorders, learning disabilities, evidence of significant axis I disorders on structured parent or child interview (DICA), family history of major axis 1 disorder, family history of inherited neurological disorder or mental retardation due to nontraumatic events, abnormality on neurological examination, gestational age at birth <37 or >42 weeks, and intra-uterine exposure to substances known or highly suspected to alter brain structure or function. After strict quality control of MRI data (see “Image Processing”), the sample for this study numbered 281 subjects (154 females and 127 males), with a total of 469 MRI scans (270 scans from female subjects and 199 scans from male subjects). Of these subjects, 135 had 1 MRI scan, 104 had 2 MRI scans, and 42 had 3 MRI scans.
MRI Protocol
A 3-dimensional T1-weighted spoiled gradient recalled echo sequence from 1.5 T scanners was obtained on each participant, with 1 mm isotropic data acquired sagittally from the entire head for most scanners (slice thickness of ca. 1.5 mm was allowed for GE scanners due to their limit of 124 slices). In addition, T2-weighted and proton density-weighted images were acquired using a 2D multislice (2 mm) dual echo fast spin echo sequence. The total acquisition time was approximately 25 min and was often repeated when indicated by the scanner-side quality control process. Some subjects were unable to tolerate this procedure and received a fallback protocol that consisted of shorter 2D acquisitions with a slice thickness of 3 mm (Evans 2006).
Image Processing
All quality-controlled MR images were processed through the CIVET pipeline (version 1.1.9) developed at the Montreal Neurological Institute (MNI) for fully automated structural image analysis (Ad-Dab'bagh et al. 2006). The main pipeline processing steps include:
linearly registering native (i.e. original) MR images to standardized MNI-Talairach space based on the ICBM152 data set (Talairach and Tournoux 1988; Collins et al. 1994; Mazziotta et al. 1995). This step is implemented in order to account for gross volume differences between subjects;
correct for intensity nonuniformity artifacts using N3 (Sled et al. 1998). These artifacts are introduced by the scanner and need to be removed to minimize, in the current context, biases in estimating GM boundaries;
classify the image into white matter (WM), GM, cerebrospinal fluid, and background using a neural net classifier (INSECT) (Zijdenbos et al. 2002);
fit images with a deformable mesh model to extract 2D inner (WM/GM interface) and outer (pial) cortical surfaces for each hemisphere with the third edition of CLASP. This produces high-resolution hemispheric surfaces with 81 924 polygons each [40 962 vertices (i.e. cortical points) per hemisphere] (MacDonald et al. 2000; Kabani et al. 2001; Kim et al. 2005; Lyttelton et al. 2007). This step places 40 962 cortical points on each hemisphere for each subject;
register both cortical surfaces for each hemisphere nonlinearly to a high-resolution average surface template generated from the ICBM152 data set in order to establish intersubject correspondence of the cortical points (Mazziotta et al. 1995; Grabner et al. 2006; Lyttelton et al. 2007);
apply a reverse of the linear transformation performed on the images of each subject to allow CTh estimations to be made at each cortical point in the native space of the MR image (Ad-Dab'bagh et al. 2005). This avoids having CTh estimations biased by the scaling factor introduced by the linear transformations (i.e. step 1) applied to each subject's brain;
calculate CTh at each cortical point using the metric (Lerch and Evans 2005) and blur each subject's CTh map using a 20 mm full width at half maximum surface-based diffusion smoothing kernel (a necessary step to impose a normal distribution to corticometric data and to increase the signal-to-noise ratio) (Chung et al. 2001).
A stringent manual quality control by 2 independent investigators of the native CTh images of each subject was implemented, with an inter-rater reliability of over 0.9 (Karama et al. 2009). This strict quality control procedure excluded MRI scans from: (1) subjects with fallback protocols, who could not remain in the scanner for an extended period of time and had to undergo faster MRI acquisition, resulting in a degree of resolution too low for an adequate estimation of CTh; (2) subjects with severe motion abnormalities resulting in image processing failures; (3) subjects with strong field inhomogeneity in the image that could not be adequately corrected; and (4) subjects with no available measurement of salivary testosterone levels or inadequate sampling.
Testosterone Collection
Repeated testosterone measures were collected in the context of each scanning session, up to a maximum of 3 times if the subjects underwent 3 scanning sessions. For each scanning visit, 2 separate 1–3 cm3 samples of saliva were collected at each of 2 scheduled time points during the day and were assayed by published radioimmunoassay methods for testosterone (Evans 2006). Relative to other gonadal hormones, peripheral levels of testosterone may be particularly useful in efforts to assess its effect on the central nervous system, given its tendency to cross the blood–brain barrier, in contrast to estradiol which is mostly bound to alpha-fetoprotein (Kimura 2000). In particular, salivary testosterone measures represent free, biologically available hormone, which may be more relevant to studies of brain–hormone associations during development compared with total serum testosterone levels. Although most samples were obtained between mid-morning and early afternoon, a period of reduced diurnal fluctuation for testosterone, variability of collection times led to the selection of the earliest sample of testosterone for each subject in order to maximize data homogeneity. Indeed, levels of testosterone have been shown to follow diurnal patterns, particularly in males, with the highest levels in the early morning and the lowest levels in the late afternoon (Brambilla et al. 2009).
Pubertal Measures
The Pubertal Development Scale (PDS) was administered to all subjects included in this study (Petersen et al. 1988). This scale consists of 5 items on a 4-point ordinal scale for each gender and has been shown to have good reliability (coefficient α: 0.77) and validity (r2= 0.61–0.67) compared with physical examination (Petersen et al. 1988). Utilization of a reliable self-rating scale for Tanner staging preserves the privacy of the children in the study and saves the time that would be necessary to gather this information through direct examination. This self-rating scale was completed by the child/adolescent with the clinician present who was available for questions and reviewed and clarified the form with the child/adolescent at the end of their neurological exam. Following the method previously used by Wichstrom (1999), we computed a puberty variable consisting of 5 stages, representing increasing levels of physical maturity similar to Tanner staging. These pubertal stages were linearly associated with the natural logarithm of testosterone in both male and female subjects. In addition, we also defined a dichotomous puberty variable for pre- and postpubertal stages, with stages 1 and 2 representing prepubertal subjects and stages 3–5 representing postpubertal subjects in order to analyze data for these 2 groups independently.
Handedness
A measure of hand preference was adapted from the Edinburgh Handedness Inventory. It included handwriting and 7 gestural commands. The criterion for hand preference was defined as at least 7 of 8 responses with the same hand (Waber et al. 2007).
Statistical Analyses
Statistical analyses were done using SurfStat (http://www.math.mcgill.ca/keith/surfstat/) and SPSS 18 (SPSS Inc., Chicago, IL, USA). Consistent with other studies (Dorn et al. 2009), a natural logarithm transformation of testosterone (ln_testo) was used to avoid analytical bias. In our sample, the association between ln_testo and age was linear in both males and females (Supplementary Fig. S1). In addition, contrary to previous reports, GM trajectories across the broader age range in our total sample have been found to be best described by first-order linear functions in contrast to cubic or quadratic functions (Lange, Brain Development Cooperative Group 2011), and consequently, first-order linear models were used (Supplementary Fig. S2).
To account for repeated testosterone measures and MRI scans in each of the subjects, a linear mixed-effects model was used, taking into account within-subject and between-subject variance. Using this linear mixed-effects model, each subject's absolute native-space CTh was linearly regressed against ln_testo at each cortical point after controlling for the effects of age, sex, total brain volume, and testosterone collection time (see “Testosterone Collection”). Note that controlling for scanner did not significantly affect the results, and the “scanner” was therefore removed from the final model.
A whole-brain correction, using random field theory (RFT) with P< 0.05, was used in all analyses to account for multiple comparisons (Worsley et al. 2004). Each analysis was conducted on the whole sample as well as on each sex separately. Age or sex differences in the association between ln_testo and CTh were tested using models with the appropriate double interaction terms included. Further, the interaction among testosterone, age, and sex was tested using a full model, with a “sex by age by testosterone” interaction as the highest-order term.
To illustrate differences in the association between ln_testo and CTh for subjects at different ages, linear mixed-effects models were run at different centered ages (from age 4 to 22). This approach is similar to other published methods and uses a modified age term to examine group differences at each age based on values estimated from developmental trajectories modeled on acquired data for all subjects (Shaw et al. 2006).
To assess for testosterone-related lateralization, again using linear mixed models with whole-brain corrections for RFT, we compared the associations between testosterone and CTh of the left versus the right hemisphere in males and females separately, controlling for age, total brain volume, and testosterone collection time and examining the “testosterone by age by hemisphere” interaction. We also assessed lateralization effects in the complete sample by examining the “testosterone by age by hemisphere by sex” interaction.
To assess the impact of puberty as defined by the PDS, we replaced the ln_testo variable in the model by the ordinal puberty variable consisting of 5 pubertal stages. We also ran separate analyses with both the ln_testo and puberty variables to determine the effect of each predictor variable while controlling for the other.
To assess the impact of handedness, we reanalyzed the association between testosterone and CTh using linear mixed models with whole-brain corrections for RFT, taking into account the effect of handedness in addition to all the aforementioned control variables (age, sex, total brain volume, and testosterone collection time).
Results
Demographics
Table 1 shows the demographic characteristics of males and females in the restricted sample. As expected, males (mean 71.6 ± 65.4 ng/dL) had significantly higher average testosterone levels compared with females (mean 52.7 ± 52.8 ng/dL), but there were no other significant differences between the 2 sexes in our sample, including for handedness. Comparisons between demographic characteristics of the initial NIH cohort (n= 433) and the resulting sample after strict quality control for CTh (n= 281, 127 males and 154 females) are shown in Supplementary Table S1. Mean age was higher in the restricted sample (mean 13.1 ± 3.6; range 4–22 years) as opposed to the initial NIH cohort (mean 11.8 ± 4.1; range 4.6–22.3 years), as younger age was associated with higher rates of image processing failure. Consequently, mean testosterone levels were also slightly higher in the restricted sample (mean 60.7 ± 59.1 ng/dL; range 5.7–574.4) than in the initial NIH cohort (mean 54.3 ± 56.4 ng/dL; range 4.5–574.4), although the range of values was similar in both groups.
Table 1.
Demographic comparisons of male (n = 127) and female (n= 154) subjects
| Males (n= 127) | Females (n= 154) | |
|---|---|---|
| Age in yearsa | Range: 4.9–22.1 | Range: 4.9–22.3 |
| Mean: 13.1 ± 3.7 | Mean: 13.1 ± 3.6 | |
| t= −0.004, df = 467, P= 0.99 | ||
| Handednessb | Right: 110 (86.6%) | Right: 141 (91.6%) |
| Left: 17 (13.4%) | Left: 13 (8.4%) | |
| χ2 = 1.8, df = 1, P= 0.18 | ||
| Raceb | White: 108 (85.0%) | White: 122 (79.2%) |
| African-American: 11 (8.7%) | African-American: 16 (10.4%) | |
| Asian: 0 (0%) | Asian: 3 (1.9%) | |
| Other or NA: 8 (6.3%) | Other or NA: 13 (8.4%) | |
| χ2 = 2.9, df = 3, P= 0.40 | ||
| Household income in 1000$b | Less than 25: 1 (0.8%) | Less than 25: 7 (4.5%) |
| 25–50: 33 (26.0%) | 25–50: 32 (20.8%) | |
| 50–75: 35 (27.3%) | 50–75: 34 (22.1%) | |
| 75–100: 31 (24.2%) | 75–100: 40 (26.0%) | |
| Over 100: 28 (22.0%) | Over 100: 41 (26.6%) | |
| χ2 = 5.8, df = 4, P= 0.22 | ||
| Mean testosterone level, collection 1a | Range: 5.7–535.6 | Range: 7.4–574.4 |
| Mean: 71.6 ± 65.4 | Mean: 52.7 ± 52.8 | |
| t= −3.5, df = 467, P= 0.001 |
at-test for independent samples.
bχ2 for independent samples.
Testosterone and CTh: Complete Sample and Subgroup Analyses
In the sample as a whole, there was a negative association between testosterone and CTh in the left posterior cingulate cortex (r-value of maximal significance= −0.2, 281 subjects, and 469 scans). When the complete sample was divided into subgroups of pre- and postpubertal males and females, it became apparent that this negative association was driven by postpubertal males, who not only showed negative associations between testosterone and CTh involving the left posterior cingulate gyrus, but extending to the adjacent precuneus area as well (r-value of maximal significance= −0.4, 56 subjects, and 77 scans). The other subgroups (prepubertal males as well as pre- and postpubertal females) did not show significant associations between testosterone and CTh.
Testosterone and CTh: Associations Across the Age Span
Analyses by age of the whole sample (281 subjects and 469 scans) taking into account each age from 4 to 22 years old revealed an “age by testosterone” interaction on CTh, that is, testosterone-related associations with CTh of certain brain regions significantly varied across the age span.
In the left hemisphere, there were negative associations between testosterone and CTh of the posterior cingulate cortex and the dorsolateral prefrontal cortex in ages 14–22 (r-value of maximal significance= −0.2), as well as negative associations between testosterone and CTh of the anterior cingulate and parahippocampal gyri in ages 21 and 22 (r-value of maximal significance= −0.15) (Supplementary Fig. S3). These associations were driven by postpubertal male subjects, with correlation values of the order of −0.4 for the left posterior cingulate cortex and the dorsolateral prefrontal cortex and of the order of −0.3 for the anterior cingulate (Fig. 1).
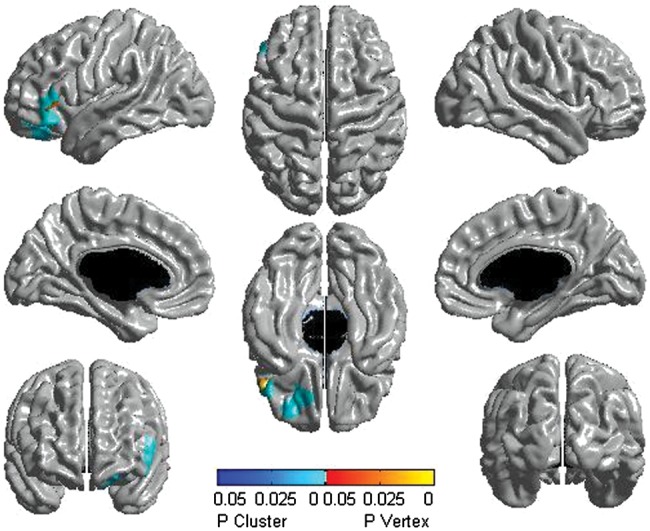
Figure 1.
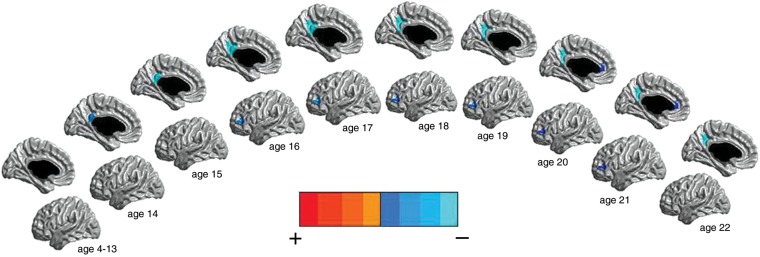
Males: testosterone effect on CTh of the left hemisphere across the age span (127 subjects and 199 scans). Midsagittal and lateral views are represented. There were negative associations between testosterone and CTh of the left posterior cingulate cortex, left anterior cingulate cortex, and left dorsolateral prefrontal cortex in postpubertal males. The scale used pictures the strongest positive associations in red and the strongest negative associations in light blue, with the shades in-between representing intermediate associations. All associations pictured were significant at P< 0.05, corrected for multiple comparisons, using RFT.
In the right hemisphere, there was a positive association between testosterone levels and CTh in the somatosensory cortex in ages 4–7 (r-value of maximal significance = 0.15), which was later reversed, as testosterone levels became negatively associated to CTh in the same area in ages 17–22 (r-value of maximal significance= −0.15) (Supplementary Fig. S4). The associations between testosterone and CTh of the somatosensory cortex were driven by females, with correlation values of the order of 0.2 for prepubertal females and of the order of −0.25 in postpubertal females (Fig. 2).
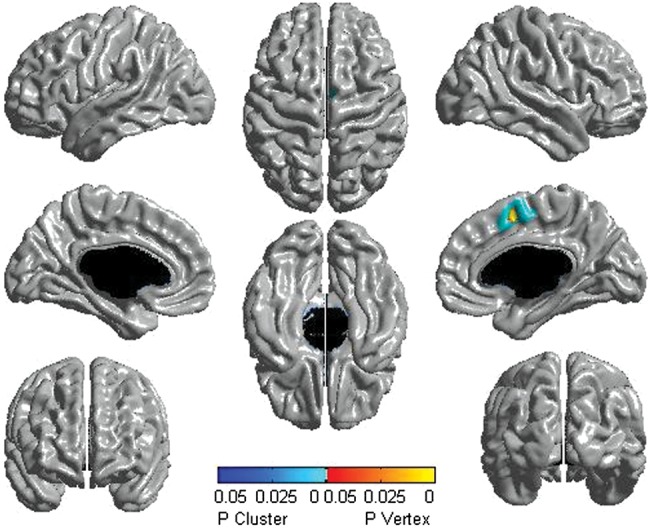
Figure 2.
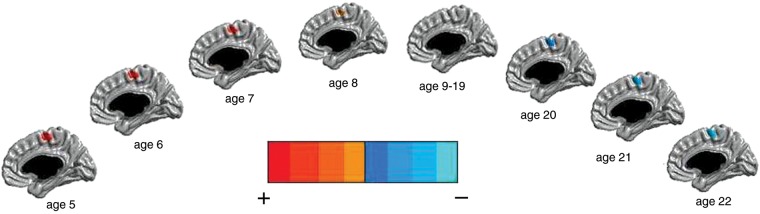
Females: testosterone effect on CTh of the right hemisphere across the age span (154 subjects and 270 scans). The midsagittal view is represented. There were positive (in prepubertal females), reversing to negative (in postpubertal females), associations between testosterone and CTh of the right somatosensory cortex. There were no significant associations between ages 9 and 19. The scale used pictures the strongest positive associations in red and the strongest negative associations in light blue, with the shades in-between representing intermediate associations. All associations pictured were significant at P< 0.05, corrected for multiple comparisons, using RFT.
Sex and Age Interactions
All double interactions examining sex, age, or testosterone effects [the age by testosterone (Supplementary Fig. S5), “sex by testosterone” (Supplementary Fig. S6), and “sex by age” interactions (Supplementary Fig. S7)] were significant for several brain regions of both the left and right hemispheres. To clarify the combined effects of sex and age on testosterone-related cortical maturation, we examined the triple sex by age by testosterone interaction on CTh and found that this interaction involved even more widespread regions than the double interactions (Fig. 3). Sex- and age-specific changes in association between testosterone and CTh observed across regions of significant interaction typically showed negative associations between testosterone and CTh pre- and postpubertally in males, whereas females showed positive associations between testosterone and CTh when prepubertal, but then reversed to negative associations after puberty. An example of the sex and age effects on the relationship between testosterone and CTh is shown for the left posterior cingulate gyrus in Figure 4.
Figure 3.
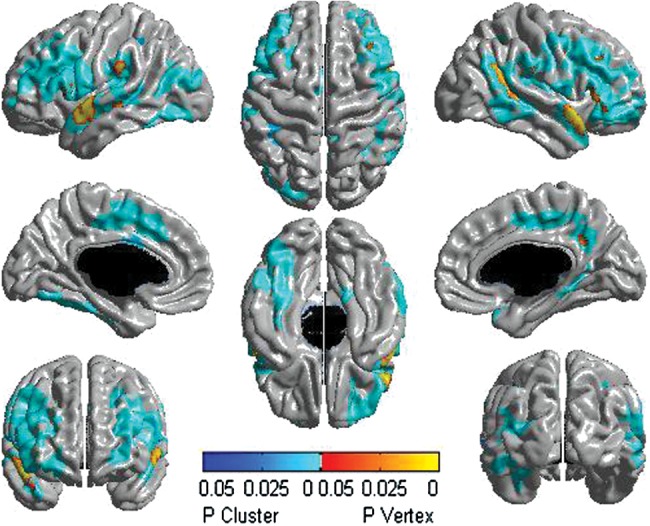
Sex by age by testosterone interaction on CTh in the complete sample (281 subjects and 469 scans). There were differences between males and females in testosterone-related cortical maturation throughout puberty involving diffuse regions of both the left and right hemispheres. The scale pictures significant interactions in yellow, red, and blue, with regions in yellow–red being significant at the peak level, whereas those in blue are significant at the cluster level. All associations pictured were significant at P< 0.05, corrected for multiple comparisons, using RFT.
Figure 4.
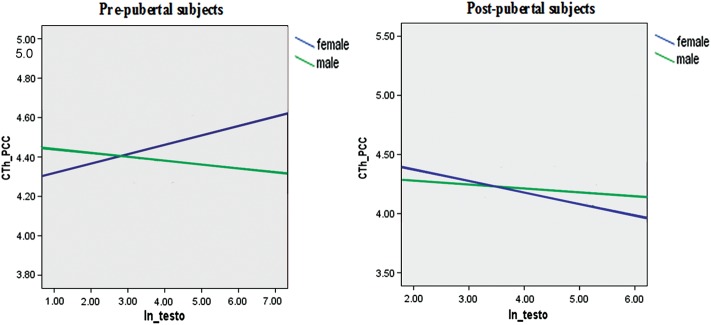
Sex and age effects: CTh changes associated with testosterone in pre- and postpubertal males and females. These graphs show a typical example of how sex and age modulated the relationship between testosterone and CTh. There was an increase in the CTh in the left posterior cingulate gyrus associated with testosterone in prepubertal females, a relationship that was reversed in postpubertal females (blue lines). Males showed a testosterone-related decrease in the CTh in the same area in both pre- and postpubertal subjects, although the strength of the association differed (green lines). CTh_PCC, cortical thickness of the left posterior cingulate gyrus; ln_testo, natural logarithm of testosterone.
Testosterone-Related Lateralization in Males and Females
When examining the testosterone by age by hemisphere interaction, completed in males and females separately, males were shown to exhibit significant testosterone-related thinning of the left dorsolateral and ventral prefrontal cortices when compared with the same regions of the right hemisphere (Fig. 5), whereas females showed testosterone-related thickening of the right compared with the left somatosensory cortex (Fig. 6). In contrast, the testosterone by age by hemisphere by sex interaction analysis revealed only trends in the expected areas of significance identified by the testosterone by age by hemisphere interaction analysis. For instance, there was a trend toward a significantly increasing negative effect of testosterone with age in males in the left dorsolateral cortex (P= 0.008, uncorrected) and ventral prefrontal cortex (P= 0.003, uncorrected) compared with these same areas in females. Only weak effects were present for the increasing positive effect of testosterone with age in females in the right somatosensory cortex (P= 0.05, uncorrected) when compared with the same area in males.
Figure 5.
Males: testosterone-related lateralization effects (127 subjects and 199 scans). Significant differences between the left and right hemispheres are displayed. Throughout the age span, males showed significant testosterone-related thinning of the left dorsolateral and ventral prefrontal cortices when compared with the same regions of the right hemisphere. The scale pictures significant interactions in yellow, red, and blue, with regions in yellow–red being significant at the peak level, whereas those in blue were significant at the cluster level. All associations pictured were significant at P< 0.05, corrected for multiple comparisons, using RFT.
Figure 6.
Females: testosterone-related lateralization effects (154 subjects and 270 scans). Significant differences between the left and right hemispheres are displayed. Throughout the age span, females showed testosterone-related thickening of the right compared with the left somatosensory cortex. The scale pictures significant interactions in yellow, red, and blue, with regions in yellow–red being significant at the peak level, whereas those in blue were significant at the cluster level. All associations pictured were significant at P< 0.05, corrected for multiple comparisons, using RFT.
Pubertal Stages
When using the puberty variable with 5 defined pubertal stages based on the PDS in lieu of testosterone, we obtained results similar to those outlined earlier, with a decreased level of significance. Analyses with both the testosterone and puberty variables revealed that the associations between testosterone and CTh remained significant after controlling for pubertal stages; however, the pubertal effect did not remain significant after controlling for testosterone levels.
Handedness
Adding handedness as a control variable to the above analyses had no significant impact on the results.
Discussion
While the current work replicates the reported trend for a negative association between testosterone and CTh during mid-to-late adolescence, it also uncovers unique findings including evidence for age- and sex-dependent associations between testosterone and CTh. Importantly, the sex by age by testosterone interaction involved widespread areas in both hemispheres and suggests an influence of testosterone on cortical development that changes with age and sex. However, when males and females were tested separately, only restricted regional effects of testosterone emerged. Postpubertal males showed a negative association between CTh and testosterone levels in the left hemisphere, involving the posterior cingulate gyrus, precuneus, and dorsolateral prefrontal cortex and later the anterior cingulate gyrus. Early prepubertal females showed a positive association between CTh and testosterone levels in the right hemisphere, involving the somatosensory cortex, a relationship that was reversed in late postpubertal females with a negative association in the same area. To our knowledge, there are no prior reports identifying positive relationships between testosterone and CTh. However, such a relationship could be viewed as consistent with observations in developing animals of a neuroprotective influence of testosterone in females from developmentally programmed apoptosis (Davis et al. 1996).
We also explored whether parallel relationships with CTh could be discerned when pubertal stages were used as a proxy for hormonal influences. There were similar, but less significant, associations between CTh and pubertal staging as defined by the PDS when compared with results based on testosterone levels. Therefore, testosterone levels and the PDS appear to reflect similar processes, but the measurement of testosterone levels as an index of increasing pubertal maturity was associated with more robust interactions with CTh as opposed to using pubertal status as defined by the PDS.
Testosterone-Related Changes in CTh: Potential Implications for Cognition and Behavior
In this study, we found the posterior cingulate, precuneus, anterior cingulate, dorsolateral, and somatosensory cortices to be most significantly associated with testosterone levels and therefore likely to be most sensitive to the effects of testosterone. Concerning functions previously ascribed to these brain regions, the posterior cingulate cortex has been shown to be involved in spatial orientation and episodic memory (Vogt et al. 1992), the precuneus in visuospatial tasks such as mental rotation and block design tasks (Cavanna and Trimble 2006), and the somatosensory cortex in perceptual sensory functions (Ruben et al. 2001). In contrast, the anterior cingulate cortex appears to play a role in attention and emotional regulation (Vogt et al. 1992), whereas the left dorsolateral cortex has been implicated in anxiety, depression, executive function, and working memory, especially verbal working memory (D'Esposito et al. 1995; Davidson et al. 1999).
Therefore, in the light of the current literature, it could be speculated that testosterone-related sex differences in CTh in the posterior cingulate gyrus and precuneus may impact sex-related differentiation of visuospatial skills throughout childhood and adolescence. In turn, testosterone-related differences in CTh in the primary somatosensory cortex may be associated with sex differences in sensory gating/threshold and influence fine motor dexterity. Finally, testosterone-related differences in CTh in the left dorsolateral cortex may be associated with sex differences in verbal memory and fluency, whereas testosterone-related effects on the anterior cingulate cortex may be associated with sex-specific variations on attention and thus may account for the greater vulnerability of males to disorders of cognitive control such as attention-deficit hyperactivity disorder.
Testosterone-Related Hemispheric Lateralization
Several animal and human studies suggest that sex steroids, in particular testosterone, may play a role in cortical asymmetry and therefore affect cerebral dominance (Wisniewski 1998). In contrast, evidence for testosterone-related lateralization of cognitive functions is limited by methodological heterogeneity, small sample sizes, hormonal variations, and limited reporting about the strength and direction of lateralization (Pfannkuche et al. 2009). In fact, attention has been mostly focussed to date on prenatal testosterone levels rather than peripubertal changes in testosterone (Geschwind and Galaburda 1985; Pfannkuche et al. 2009; Schaafsma et al. 2009).
In the present study, we found peripubertal testosterone levels to affect CTh in the left hemisphere more than the right hemisphere in males, whereas the opposite held true for females, with the right hemisphere being more significantly affected by testosterone levels than the left hemisphere. The same findings persisted when controlling for handedness, supporting the view that manual dominance likely follows a different process from lateralization of cognitive functions such as verbal or visuospatial dominance (Geschwind and Galaburda 1985). This relationship between testosterone and the left hemisphere in males and the right hemisphere in females, respectively, was also shown to be age-specific and to evolve throughout puberty.
These results were significant when testosterone-related lateralization effects were examined in males and females separately, comparing the left with the right hemisphere. Only trends remained when we directly compared CTh of the left and right hemispheres in males versus females. Still, the current findings suggest that lateralization may follow different patterns in males and females and may represent a more dynamic process than previously thought. This is partly supported by recent investigation into interhemispheric inhibition of the dominant hemisphere on the nondominant hemisphere and functional organization within hemispheres, showing that these functional cerebral asymmetries are sex-specific and sex-hormone-dependent, being relatively stable in men and fluctuating in women across the menstrual cycle (Weis and Hausmann 2010). In addition, our results are in accordance with Geschwind's theory of lateralization, which predicts testosterone levels to be associated with decreased growth in the left hemisphere in specific brain areas in males (Geschwind and Galaburda 1985). However, while Geschwind's theory focussed on testosterone exposure in utero and early childhood, we found that peri- and postpubertal levels of testosterone were significantly associated with decreased CTh of the left hemisphere in males (Geschwind and Galaburda 1985).
Putative Mechanisms of Action of Testosterone in the Cerebral Cortex
Several mechanisms may play a role in modulating the effects of testosterone in the brain: (1) testosterone could act directly on androgen receptors, (2) testosterone could act indirectly on estrogen receptors through its conversion to estradiol by aromatization, and (3) both mechanisms may be present simultaneously. In each specific brain region, the relative importance of these mechanisms is determined by levels of the converting enzyme aromatase in that region and its ratio of androgen/estrogen receptors. Differences in the distribution of aromatase in the brain may underlie, in part, this study's findings of testosterone-related changes in CTh in very localized brain regions as opposed to more global/lobar effects (Biegon et al. 2010). However, this mechanism is unlikely to be responsible for the reported sex differences. Indeed, in contrast to previous reports from animal studies (Abdelgadir et al. 1994; Roselli and Resko 2001), up to now no sex differences in levels of brain aromatase activity and gene expression could be demonstrated in a number of human samples (Sasano et al. 1998; Steckelbroeck et al. 1999; Stoffel-Wagner et al. 1999; Ishunina et al. 2005; Biegon et al. 2010). In contrast, both animal and human studies suggest that there are sex differences in levels and distribution of androgen and estrogen receptors throughout the brain, a dynamic phenomenon that also varies across puberty and could potentially underlie the testosterone-related sex differences in CTh reported here (Goldstein et al. 2001; Raznahan et al. 2010; Wilson et al. 2011). An important caveat is that this study was not designed to look at specific mechanisms of action; therefore, the relative importance of each of the outlined mechanisms in specific testosterone-sensitive brain regions cannot be ascertained from the current results.
Strengths and Limitations
Limitations include methodological variations in collection times of salivary testosterone that may have led to decreased sensitivity and specificity of the measured peripheral-free testosterone levels, even though we attempted to correct for this by controlling for collection time in the analysis. There were also no data collected on androgen receptor polymorphisms, which may impact the degree of cortical growth or cortical thinning related to testosterone, particularly in males (Perrin et al. 2008). In contrast, research into testosterone-related effects in the human brain remains scarce, with few structural studies involving pediatric samples. Results from this study represent clear evidence of age- and sex-dependent testosterone associations with cortical growth. Findings stress the importance of looking at changing levels of testosterone across puberty rather than limiting explorations to prenatal testosterone. Strengths also include the large sample size, the broad age range examined, and the longitudinal design allowing modeling of the relationship between testosterone levels and CTh at each age point.
Conclusions
In summary, findings were compatible with the view that testosterone influences brain development, that this influence changes with age and sex, and further suggested sex-related hemispheric lateralization effects of testosterone. Pronounced regional effects were observed in this study in key cortical regions known to be implicated in visuospatial and sensorimotor skills as well as behavioral regulation. In addition, the tendency for testosterone to be associated with cortical maturation in the left hemisphere for males and in the right hemisphere for females supported the view that sex differences in hemispheric lateralization progress throughout puberty.
Supplementary Material
Supplementary material can be found at: http://www.cercor.oxfordjournals.org/.
Funding
This work was supported by Federal funds from the National Institute of Child Health and Human Development, the National Institute on Drug Abuse, the National Institute of Mental Health, and the National Institute of Neurological Disorders and Stroke (Contract nos N01-HD02-3343, N01-MH9-0002, and N01-NS-9-2314, -2315, -2316, -2317, -2319, and -2320). T.-V.N. receives financial support from the Canadian Institutes of Health Research with a Master's Award: Frederick Banting and Charles Best Canada Graduate Scholarship. S.D. receives financial support from the Canadian Institutes of Health Research with a Master's Award: Frederick Banting and Charles Best Canada Graduate Scholarship. S.K. was supported by the Fonds de Recherche en Santé du Québec.
Supplementary Material
Notes
The authors would like to acknowledge the Brain Development Cooperative Group, which significantly contributed to the design and data collection of this study. Disclaimer: The views herein do not necessarily represent the official views of the National Institute of Child Health and Human Development, the National Institute on Drug Abuse, the National Institute of Mental Health, the National Institute of Neurological Disorders and Stroke, the National Institutes of Health, the US Department of Health and Human Services, or any other agency of the US Government. Conflict of Interest: None declared.
References
- Abdelgadir S, Resko J, Ojeda S, Lephart E, McPhaul M, Roselli C. Androgens regulate aromatase cytochrome P450 messenger ribonucleic acid in rat brain. Endocrinology. 1994;135:395–401. doi: 10.1210/endo.135.1.8013375. [DOI] [PubMed] [Google Scholar]
- Ad-Dab'bagh Y, Lyttelton O, Muehlboeck J. The CIVET image-processing environment: a fully automated comprehensive pipeline for anatomical neuroimaging research. Proceedings of the 12th Annual Meeting of the Organization for Human Brain Mapping; Florence, Italy: 2006. Corbetta M, editor. [Google Scholar]
- Ad-Dab'bagh Y, Singh V, Robbins S, Lerch J, Lyttelton O, Fombonne E, Evans AC. Native space cortical thickness measurement and the absence of correlation to cerebral volume. Proceedings of the 11th Annual Meeting for the Organization of Human Brain Mapping; Toronto: 2005. Zilles K, editor. [Google Scholar]
- Archer J, Love-Geffen T, Herbst-Damm K, Swinney D, Chang J. Effect of estradiol versus estradiol and testosterone on brain-activation patterns in postmenopausal women. Menopause. 2005;13:528–537. doi: 10.1097/01.gme.0000188737.46746.cd. [DOI] [PubMed] [Google Scholar]
- Azad N, Shailesh P, Barnes W, Friedman N. Testosterone treatment enhances regional brain perfusion in hypogonadal men. J Clin Endocr Metab. 2003;88:3064–3068. doi: 10.1210/jc.2002-020632. [DOI] [PubMed] [Google Scholar]
- Biegon A, Kim S, Alexoff D, Jayne M, Carter P, Hubbard B, King P, Logan J, Muench L, Pareto D, et al. Unique distribution of aromatase in the human brain: in vivo studies with PET and {N-methyl-11C}vorozole. Synapse. 2010;64:801–807. doi: 10.1002/syn.20791. [DOI] [PMC free article] [PubMed] [Google Scholar]
- Bos P, Hermans E, Montoya E, Ramsey N, Van Honk J. Testosterone administration modulates neural responses to crying infants in young females. Psychoneuroendocrinology. 2010;35:114–121. doi: 10.1016/j.psyneuen.2009.09.013. [DOI] [PubMed] [Google Scholar]
- Brambilla D, Matsumoto A, Araujo A, McKinlay J. The effect of diurnal variation on clinical measurement of serum testosterone and other sex hormone levels in men. J Clin Endocr Metab. 2009;94:907–913. doi: 10.1210/jc.2008-1902. [DOI] [PMC free article] [PubMed] [Google Scholar]
- Bramen J, Hranilovich J, Dahl R, Forbes E, Chen J, Toga A, Dinow I, Worthman C, Sowell E. Puberty influences medial temporal lobe and cortical gray matter maturation differently in boys and girls matched for sexual maturity. Cereb Cortex. 2011;21:636–646. doi: 10.1093/cercor/bhq137. [DOI] [PMC free article] [PubMed] [Google Scholar]
- Cavanna A, Trimble M. The precuneus: a review of its functional anatomy and behavioral correlates. Brain. 2006;129:564–583. doi: 10.1093/brain/awl004. [DOI] [PubMed] [Google Scholar]
- Chung MK, Worsley KJ, Taylor J, Ramsay JO, Robbins S, Evans AC. Diffusion smoothing on the cortical surface. NeuroImage. 2001;13S:95. [Google Scholar]
- Collins DL, Neelin P, Peters TM, Evans AC. Automatic 3D intersubject registration of MR volumetric data in standardized Talairach space. J Comp Assist Tomogr. 1994;18:192–205. [PubMed] [Google Scholar]
- Davidson R, Abercrombie H, Nitschke J, Putnam K. Regional brain function, emotion and disorders of emotion. Curr Opin Neurobiol. 1999;9:228–234. doi: 10.1016/s0959-4388(99)80032-4. [DOI] [PubMed] [Google Scholar]
- Davis E, Popper P, Gorski R. The role of apoptosis in sexual differentiation of the rat sexually dimorphic nucleus of the preoptic area. Brain Res. 1996;734:10–18. [PubMed] [Google Scholar]
- D'Esposito M, Detre J, Alsop D, Shin R, Atlas S, Grossman M. The neural basis of the central executive system of working memory. Nature. 1995;378:279–281. doi: 10.1038/378279a0. [DOI] [PubMed] [Google Scholar]
- Dorn L, Kolko D, Susman E, Huang B, Stein H, Music E, Bukstein O. Salivary gonadal and adrenal hormone differences in boys and girls with and without disruptive behavior disorders: contextual variants. Biol Psychol. 2009;81:31–39. doi: 10.1016/j.biopsycho.2009.01.004. [DOI] [PMC free article] [PubMed] [Google Scholar]
- Draganski B, Gaser C, Busch V, Schuierer G, Bogdahn U, May A. Changes in grey matter induced by training. Nature. 2004;427:311–312. doi: 10.1038/427311a. [DOI] [PubMed] [Google Scholar]
- Draganski B, Geisler P, Hajak G, Bogdahn U, Winkler J, May A. Hypothalamic gray matter changes in narcoleptic patients. Nature. 2002;8:1186. doi: 10.1038/nm1102-1186. [DOI] [PubMed] [Google Scholar]
- Evans A. The NIH MRI study of normal brain development. NeuroImage. 2006;30:184–202. doi: 10.1016/j.neuroimage.2005.09.068. [DOI] [PubMed] [Google Scholar]
- Geschwind N, Galaburda A. Cerebral lateralization: biological mechanisms, associations, and pathology: I. A hypothesis and a program for research. Arch Neurol. 1985;42:428–559. doi: 10.1001/archneur.1985.04060050026008. [DOI] [PubMed] [Google Scholar]
- Goldstein J, Seidman L, Horton N, Makris N, Kennedy D, Caviness V, Faraone S, Tsuang M. Normal sexual dimorphism of the adult human brain assessed by in vivo magnetic resonance imaging. Cereb Cortex. 2001;11:490–497. doi: 10.1093/cercor/11.6.490. [DOI] [PubMed] [Google Scholar]
- Grabner G, Janke AL, Budge MM, Smith D, Pruessner J, Collins DL. Symmetric atlasing and model based segmentation: an application to the hippocampus in older adults. Med Image Comput Comput Assist Interv Int. 2006;9:58–66. doi: 10.1007/11866763_8. [DOI] [PubMed] [Google Scholar]
- Haier R, Karama S, Leyba L, Jung R. MRI assessment of cortical thickness and functional activity changes in adolescent girls following three months of practice on a visual-spatial task. BMC Res Notes. 2009;2:1–7. doi: 10.1186/1756-0500-2-174. [DOI] [PMC free article] [PubMed] [Google Scholar]
- Herbst-Damm K, Swinney D, Chang J. Effect of estradiol versus estradiol and testosterone on brain-activation patterns in postmenopausal women. Menopause. 2005;13:528–537. doi: 10.1097/01.gme.0000188737.46746.cd. [DOI] [PubMed] [Google Scholar]
- Hermans E, Ramsey N, Van Honk J. Exogenous testosterone enhances responsiveness to social threat in the neural circuitry of social aggression in humans. Biol Psychiatr. 2008;63:263–270. doi: 10.1016/j.biopsych.2007.05.013. [DOI] [PubMed] [Google Scholar]
- Ishunina T, Van Beurden D, Van Der Meulen G, Unmehopa U, Hol E, Huitinga I, Swaab D. Diminished aromatase immunoreactivity in the hypothalamus, but not in the basal forebrain nuclei in Alzheimer's disease. Neurobiol Aging. 26. 2005:173–194. doi: 10.1016/j.neurobiolaging.2004.03.010. [DOI] [PubMed] [Google Scholar]
- Kabani N, Le Goualher G, MacDonald D, Evans AC. Measurement of cortical thickness using an automated 3-D algorithm: a validation study. NeuroImage. 2001;13:375–380. doi: 10.1006/nimg.2000.0652. [DOI] [PubMed] [Google Scholar]
- Karama S, Ad-Dab'bagh Y, Haier R, Deary I, Lyttelton O, Lepage C, Evans A. Positive association between cognitive ability and cortical thickness in a representative US sample of healthy 6 to 18 year-olds. Intelligence. 2009;37:145–155. doi: 10.1016/j.intell.2008.09.006. [DOI] [PMC free article] [PubMed] [Google Scholar]
- Kim JS, Singh V, Lee JK, Lerch J, Ad-Dab'bagh Y, MacDonald D, Lee JM, Kim SI, Evans AC. Automated 3-D extraction and evaluation of the inner and outer cortical surfaces using a Laplacian map and partial volume effect classification. NeuroImage. 2005;27:210–221. doi: 10.1016/j.neuroimage.2005.03.036. [DOI] [PubMed] [Google Scholar]
- Kimura D. Sex and cognition. Cambridge (MA): The Massachusetts Institute of Technology Press; 2000. [Google Scholar]
- Lange N Brain Development Cooperative Group. Total and regional brain volumes in a population-based normative sample from 4 to 18 years: The NIH MRI study of normal brain development. Cereb Cortex. 2011;22:1–12. doi: 10.1093/cercor/bhr018. [DOI] [PMC free article] [PubMed] [Google Scholar]
- Lerch JP, Evans AC. Cortical thickness analysis examined through power analysis and a population simulation. NeuroImage. 2005;24:163–173. doi: 10.1016/j.neuroimage.2004.07.045. [DOI] [PubMed] [Google Scholar]
- Lyttelton O, Boucher M, Robbins S, Evans A. An unbiased iterative group registration template for cortical surface analysis. NeuroImage. 2007;34:1535–1544. doi: 10.1016/j.neuroimage.2006.10.041. [DOI] [PubMed] [Google Scholar]
- MacDonald D, Kabani N, Avis D, Evans AC. Automated 3-D extraction of inner and outer surfaces of cerebral cortex from MRI. NeuroImage. 2000;12:340–356. doi: 10.1006/nimg.1999.0534. [DOI] [PubMed] [Google Scholar]
- Mazziotta JC, Toga AW, Evans A, Fox P, Lancaster J. A probabilistic atlas of the human brain: theory and rationale for its development. The International Consortium for Brain Mapping (ICBM) NeuroImage. 1995;2:89–101. doi: 10.1006/nimg.1995.1012. [DOI] [PubMed] [Google Scholar]
- Miller K, Deckersbach T, Rauch S, Fischman A, Grieco K, Herzog D, Klibanski A. Testosterone administration attenuates regional brain hypometabolism in women with anorexia nervosa. Psychiatr Res. 2004;132:197–207. doi: 10.1016/j.pscychresns.2004.09.003. [DOI] [PubMed] [Google Scholar]
- Neufang S, Specht K, Hausmann M, Gunturkun O, Herpetz-Dahlmann B, Fink G, Konrad K. Sex differences and the impact of steroid hormones on the developing human brain. Cereb Cortex. 2009;19:464–473. doi: 10.1093/cercor/bhn100. [DOI] [PubMed] [Google Scholar]
- Paus T, Nawaz-Khan I, Leonard G, Perron M, Pike G, Pitiot A, Richer L, Susman E, Veillette S, Pausova Z. Sexual dimorphism in the adolescent brain: role of testosterone and androgen receptor in global and local volumes of grey and white matter. Horm Behav. 2010;57:63–75. doi: 10.1016/j.yhbeh.2009.08.004. [DOI] [PubMed] [Google Scholar]
- Peper J, Brouwer R, Schnack H, Caroline Van Baal G, Van Leeuwen M, Van den Berg S, Delemarre-Van de Waal H, Boomsma D, Kahn R, Hulshoff Pol H. Sex steroids and brain structure in pubertal boys and girls. Psychoneuroendocrinology. 2009;34:332–342. doi: 10.1016/j.psyneuen.2008.09.012. [DOI] [PubMed] [Google Scholar]
- Perrin J, Herve P, Leonard G, Perron M, Pike G, Pitiot A, Richer L, Veillette S, Pausova Z, Paus T. Growth of white matter in the adolescent brain: role of testosterone and androgen receptor. J Neurosci. 2008;38:9519–9524. doi: 10.1523/JNEUROSCI.1212-08.2008. [DOI] [PMC free article] [PubMed] [Google Scholar]
- Petersen A, Crockett L, Richards M, Boxer A. A self-report measure of pubertal status: reliability, validity, and initial norms. J Youth Adolesc. 1988;17:117–133. doi: 10.1007/BF01537962. [DOI] [PubMed] [Google Scholar]
- Pfannkuche K, Bouma A, Groothuis T. Does testosterone affect lateralization of brain and behavior? A meta-analysis in humans and other animal species. Phil Trans R Soc Lond B Biol Sci. 2009:929–942. doi: 10.1098/rstb.2008.0282. 364: [DOI] [PMC free article] [PubMed] [Google Scholar]
- Raznahan A, Lee Y, Stidd R, Long R, Greenstein D, Clasen L, Addington A, Gogtay N, Rapoport J, Giedd J. Longitudinally mapping the influence of sex and androgen signaling on the dynamics of human cortical maturation in adolescence. Proc Natl Acad Sci USA. 2010;107:16988–16993. doi: 10.1073/pnas.1006025107. [DOI] [PMC free article] [PubMed] [Google Scholar]
- Roselli C, Resko J. Cytochrome P450 aromatase (CYP19) in the non-human primate brain: distribution, regulation, and functional significance. J Steroid Biochem. 2001;79:247–253. doi: 10.1016/s0960-0760(01)00141-8. [DOI] [PubMed] [Google Scholar]
- Ruben J, Schwiemann J, Deuchert M, Meyer R, Krause T, Curio G, Villringer K, Kurth R, Villringer A. Somatotopic organization of human secondary cortex. Cereb Cortex. 2001;11:463–473. doi: 10.1093/cercor/11.5.463. [DOI] [PubMed] [Google Scholar]
- Sasano H, Takahashi K, Satoh F, Nagura H, Harada N. Aromatase in the human central nervous system. Clin Endocrinol. 1998;48:325–329. doi: 10.1046/j.1365-2265.1998.00390.x. [DOI] [PubMed] [Google Scholar]
- Schaafsma S, Riedstra B, Pfannkuche K, Bouma A, Groothuis T. Epigenesis of behavioral lateralization in humans and other animals. Phil Trans R Soc Lond B Biol Sci. 2009;364:915–927. doi: 10.1098/rstb.2008.0244. [DOI] [PMC free article] [PubMed] [Google Scholar]
- Shaw P, Greenstein D, Lerch J, Clasen L, Lenroot R, Gogtay N, Evans A, Rapoport J, Giedd J. Intellectual ability and cortical development in children and adolescents. Nature. 2006;440:676–679. doi: 10.1038/nature04513. [DOI] [PubMed] [Google Scholar]
- Sled JG, Zijdenbos AP, Evans AC. A nonparametric method for automatic correction of intensity nonuniformity in MRI data. IEEE Trans Med Imaging. 1998;17:87–97. doi: 10.1109/42.668698. [DOI] [PubMed] [Google Scholar]
- Steckelbroeck S, Heidrich D, Stoffel-Wagner B, Hans V, Schramm J, Bidlingmaier F, Klingmuller D. Characterization of aromatase cytochrome P450 activity in the human temporal lobe. J Clin Endocr Metab. 1999;84:2795–2801. doi: 10.1210/jcem.84.8.5876. [DOI] [PubMed] [Google Scholar]
- Stoffel-Wagner B, Watzka M, Schramm J, Bidlingmaier F, Klingmuller D. Expression of CYP19 (aromatase) mRNA in different areas of the human brain. J Steroid Biochem. 1999;70:237–241. doi: 10.1016/s0960-0760(99)00114-4. [DOI] [PubMed] [Google Scholar]
- Talairach J, Tournoux P. Co-planar stereotaxic atlas of the human brain: 3-dimensional proportional system: an approach to cerebral imaging. Thieme Medical Publishers; 1988. New York (NY): [Google Scholar]
- Vogt B, Finch D, Olson C. Functional heterogeneity in cingulate cortex: the anterior executive and posterior evaluative regions. Cereb Cortex. 1992;2:435–443. doi: 10.1093/cercor/2.6.435-a. [DOI] [PubMed] [Google Scholar]
- Waber D, De Moor C, Forbes P, Almli C, Botteron K, Leonard G, Milovan D, Paus T, Rumsey J, Group BDC. The NIH MRI study of normal brain development: performance of a population based sample of healthy children aged 6–18 years on a neuropsychological battery. J Int Neuropsychol Soc. 2007;13:729–746. doi: 10.1017/S1355617707070841. [DOI] [PubMed] [Google Scholar]
- Weis S, Hausmann M. Sex hormones: modulators of interhemispheric inhibition in the human brain. Neuroscientist. 2010;16:132–138. doi: 10.1177/1073858409341481. [DOI] [PubMed] [Google Scholar]
- Wichstrom L. The emergence of gender difference in depressed mood during adolescence: the role of intensified gender socialization. Dev Psychol. 1999;35:232–245. [PubMed] [Google Scholar]
- Wilson M, Westberry J, Trout A. Estrogen receptor-alpha gene expression in the cortex: sex differences during development and in adulthood. Horm Behav. 2011;59:353–357. doi: 10.1016/j.yhbeh.2010.08.004. [DOI] [PMC free article] [PubMed] [Google Scholar]
- Wisniewski A. Sexually-dimorphic patterns of cortical asymmetry, and the role for sex steroid hormones in determining cortical patterns of lateralization. Psychoneuroendocrinology. 1998;23:519–547. doi: 10.1016/s0306-4530(98)00019-5. [DOI] [PubMed] [Google Scholar]
- Witte A, Savli M, Holik A, Kasper S, Lanzenberger R. Regional sex differences in grey matter volume are associated with sex hormones in the young adult brain. NeuroImage. 2009;49:1205–1212. doi: 10.1016/j.neuroimage.2009.09.046. [DOI] [PubMed] [Google Scholar]
- Worsley K, Taylor J, Tomaiuolo F, Lerch J. Unified univariate and multivariate random field theory. NeuroImage. 2004;23:189–195. doi: 10.1016/j.neuroimage.2004.07.026. [DOI] [PubMed] [Google Scholar]
- Zijdenbos AP, Forghani R, Evans AC. Automatic “pipeline” analysis of 3-D MRI data for clinical trials: application to multiple sclerosis. IEEE Trans Med Imaging. 2002;21:1280–1291. doi: 10.1109/TMI.2002.806283. [DOI] [PubMed] [Google Scholar]
Associated Data
This section collects any data citations, data availability statements, or supplementary materials included in this article.