

Abstract
Impulsivity is a complex trait associated with a range of maladaptive behaviors, including many forms of psychopathology. Previous research has implicated multiple neural circuits and neurotransmitter systems in impulsive behavior, but the relationship between impulsivity and organization of whole-brain networks has not yet been explored. Using graph theory analyses, we characterized the relationship between impulsivity and the functional segregation (“modularity”) of the whole-brain network architecture derived from resting-state functional magnetic resonance imaging (fMRI) data. These analyses revealed remarkable differences in network organization across the impulsivity spectrum. Specifically, in highly impulsive individuals, regulatory structures including medial and lateral regions of the prefrontal cortex were isolated from subcortical structures associated with appetitive drive, whereas these brain areas clustered together within the same module in less impulsive individuals. Further exploration of the modular organization of whole-brain networks revealed novel shifts in the functional connectivity between visual, sensorimotor, cortical, and subcortical structures across the impulsivity spectrum. The current findings highlight the utility of graph theory analyses of resting-state fMRI data in furthering our understanding of the neurobiological architecture of complex behaviors.
Keywords: Barratt Impulsiveness Scale, functional connectivity, graph theory, neuroimaging, resting-state fMRI
Introduction
There is strong evidence that individual differences in normal personality traits underlie liability for a broad range of psychopathology (Moeller et al. 2001; Krueger and Markon 2006). One such cross-cutting trait is impulsivity: the tendency to act quickly without considering the broader, especially future, consequences of one's actions. High trait impulsivity is robustly associated with the externalizing spectrum of psychopathology (Krueger et al. 2005), including antisocial personality disorders (Swann et al. 2009), substance use disorders (Madden et al. 1997; Jentsch and Taylor 1999; Kirby et al. 1999; Volkow and Fowler 2000; Beck et al. 2009), attention-deficit/hyperactivity disorder (ADHD) (Dalley et al. 2008), and pathological gambling (Alessi and Petry 2003). In contrast, low trait impulsivity has been associated with internalizing disorders such as depression and anxiety (Eisenberg et al. 2001, 2009), although the precise relationships vary depending on the specific traits assessed (Corruble et al. 1999, 2003; Cosi et al. 2011). Developing a comprehensive neurobiological understanding of trait impulsivity may hold promise in mapping the shared and unique etiologic risk for such psychopathology and, ultimately, informing the advancement of treatment and prevention strategies.
Recent neuroscience research in both humans and nonhuman animals indicates that individual differences in several interconnected neural circuits, including the mesocorticostriatal and corticolimbic networks, are associated with trait impulsivity (Jentsch and Taylor 1999; Volkow and Fowler 2000; Cardinal et al. 2001; McClure et al. 2004; Brown et al. 2006; Dalley et al. 2008; Forbes et al. 2009; Somerville et al. 2011). Investigations of categorical mental disorders show that impulsive behavior is related to decreased functional (Williams et al. 2006; Wolf et al. 2011; Xie et al. 2011) and structural (Romero et al. 2010) connectivity in these same circuits. Similarly, impulsivity has been linked to dysregulation of several neurotransmitter systems involved in the modulation of these neural circuits (Dolan et al. 2002; King et al. 2003; McClure et al. 2004; Dalley et al. 2008; Forbes et al. 2009; Buckholtz et al. 2010).
Given the demonstrated influence of multiple systems on this complex behavioral trait, it is possible that individual differences in impulsivity are associated with broader patterns of global information processing that extend beyond the previously identified circumscribed alterations in mesocorticostriatal and corticolimbic circuits. Resting-state functional connectivity (FC) analyses have proven to be a useful tool for probing global brain organization. Such analyses in healthy individuals have revealed characteristic neural networks shaped by anatomical pathways that become engaged during various cognitive processes or during the default mode when there is no explicit processing of stimuli or information (Fox and Raichle 2007; Biswal et al. 2010; Raichle 2011). Graph theory provides a unique quantitative approach to mapping whole-brain network organization, particularly from resting-state data. By mathematically modeling links between elements of coupled systems (Sporns et al. 2004; Bullmore and Sporns 2009), graph theory analyses essentially characterize the topology and spatial patterns of temporal correlations across the brain. Functional neuroimaging studies have shown that such analyses can quantify core metrics, reflecting individual differences in whole-brain network organization (Wang et al. 2009; Chanraud et al. 2011; Zhang et al. 2011). To date, however, such approaches have focused mainly on group comparisons in case/control studies of specific clinical populations and have not been used to assess neural substrates for variable personality traits that are known risk factors for multiple forms of psychopathology.
In the current study, we examined properties of network organization across the whole brain as they relate to self-reported impulsivity through graph theory analyses of resting-state blood oxygen level-dependent (BOLD) functional magnetic resonance imaging (fMRI) data. From a large sample (N = 200) of 18–22-year-old volunteers, we compared whole-brain network organization between groups of individuals falling in the middle and tail-ends of our observed self-reported impulsivity distribution. Specifically, we partitioned the respective FC networks of the 20 individuals scoring in the top 10% (i.e. high impulsivity), middle 10% (i.e. intermediate impulsivity), and bottom 10% (i.e. low impulsivity) of our sample by optimizing a fully weighted version of a widely used graph-based modularity metric (Girvan and Newman 2002; Rubinov and Sporns 2011). The resulting optimal module partitions represent communities of brain regions that have stronger functional connections with each other than with those in other modules. In a secondary analysis, we calculated the FC density using a “sliding window” across all 200 participants to probe changes in inter- and intramodule FC.
Materials and Methods
Participants
A total of 200 subjects (117 women and mean age 19.65 ± 1.30 years) were included from an ongoing parent protocol, the Duke Neurogenetics Study (DNS), which assesses a wide range of behavioral and biological traits among nonpatient, young adult, student volunteers. All participants provided informed consent in accordance with Duke University guidelines and were in good general health. The participants were free of the following study exclusions: (1) medical diagnoses of cancer, stroke, head injury with loss of consciousness, untreated migraine headaches, diabetes requiring insulin treatment, chronic kidney or liver disease, or lifetime history of psychotic symptoms; (2) use of psychotropic, glucocorticoid, or hypolipidemic medication; and (3) conditions affecting cerebral blood flow and metabolism (e.g. hypertension). Diagnosis of any past or current Axis I disorder as defined by the Diagnositc and Statistical Manual of Mental Disorders, 4th Edition (DSM IV) (First et al. 1995) was not an exclusion as the DNS seeks to establish broad variability in multiple behavioral phenotypes related to psychopathology (e.g. impulsivity). However, as stated earlier, no subjects were taking psychotropic medication at the time of or at least 10 days prior to study participation. See Supplementary Table S1 for information regarding the observed distribution of psychopathology in the current sample.
Behavioral Assessment
All participants completed the Barratt Impulsiveness Scale (BIS), a reliable and valid 30-item self-report questionnaire designed to measure impulsivity (Patton et al. 1995). Each item is measured on a 4-point Likert scale, with higher values indicating greater impulsivity (Patton et al. 1995). The BIS assesses impulsivity on 3 subscales: (1) tendency to act without thinking (motor impulsivity), (2) readiness to make quick cognitive decisions (cognitive impulsivity), and (3) degree of focus on only the present (nonplanning impulsivity).
Because the aspects of impulsivity measured by the BIS are inversely associated with socioeconomic status in both clinic and community samples (Flory et al. 2006), we controlled for social rank in the analyses using the social ladder scale (Adler et al. 2000). Participants were shown a ladder and asked to place themselves on the rung which best corresponded to where they stood in society, with the top of the ladder representing those who are the best off and the bottom representing those who are the worst off. Participants also answered this question based on how they perceived each of their biological parents, and the average of these 3 responses was taken as their social status score.
Structural Equation Modeling
To control measurement error and to minimize the number of statistical comparisons, a latent impulsivity construct was defined using confirmatory factor analysis by allowing the 3 BIS impulsivity subscales to load on a latent impulsivity factor, which achieved a close fit [model χ2 = 183.32, DF = 10, P < 0.0001; root mean square (RMS) error of approximation = 0.032 (90% confidence interval = 0.000–0.097); standardized RMS residual = 0.033; and comparative fit index = 0.991]. All models controlled for the participants’ age, gender, IQ, social status, and race/ethnicity. Based on our observed distributions, race/ethnicity was assessed using 3 dummy contrasts comparing African-Americans, Asian-Americans, and members of other race–ethnic groups with non-Hispanic whites.
BOLD fMRI Data Acquisition
Each participant was scanned using a research-dedicated GE MR750 3 T scanner at the Duke-UNC Brain Imaging and Analysis Center. This scanner is equipped with high-power, high-duty-cycle 50 mT/m gradients at 200 T/m/s slew rate and an 8-channel head coil for parallel imaging at high bandwidth up to 1 MHz. A semi-automated high-order shimming program was used to maximize global field homogeneity. To allow for spatial registration of each participant's data to a standard coordinate system, high-resolution 3-dimensional structural images were acquired in 34 axial slices coplanar with the functional scans [repetition time (TR)/echo time (TE)/flip angle = 7.7 s/3.0 ms/12°; voxel size = 0.9 × 0.9 × 4 mm; field of view (FOV) = 240 mm; interslice skip = 0]. For the 4 min, 16 s resting-state scan, a series of 34 interleaved axial functional slices aligned with the anterior commissure–posterior commissure plane were acquired for whole-brain coverage using an inverse-spiral pulse sequence to reduce susceptibility artifact (TR/TE/flip angle = 2000 ms/30 ms/60°; FOV = 240 mm; voxel size = 3.75 × 3.75 × 4 mm; interslice skip = 0). Four initial radiofrequency excitations were performed (and discarded) to achieve steady-state equilibrium. Participants were shown a blank gray screen and instructed to lie still with their eyes open, think about nothing in particular, and remain awake.
BOLD fMRI Data Preprocessing and Correlations
Preprocessing of all resting-state fMRI data was conducted at the Laboratory of NeuroGenetics at Duke University using SPM8 (www.fil.ion.ucl.ac.uk/spm). Images for each subject were slice-time-corrected, realigned to the first volume in the time series to correct for head motion, spatially normalized into a standard stereotactic space (Montreal Neurological Institute template) using a 12-parameter affine model (final resolution of functional images = 2 mm isotropic voxels), and smoothed to minimize noise and residual differences in gyral anatomy with a Gaussian filter, set at 6 mm full-width at half-maximum. Structural regions of interest (ROIs) were isolated using the Harvard-Oxford probabilistic cortical and subcortical atlases provided with FMRIB's Software Library distribution (www.fmrib.ox.ac.uk/fsl) and thresholded at 0.5. Each ROI was registered to the subject's native space, and 7 ROIs were excluded from the analysis: bilateral white matter, bilateral cortical gray matter and bilateral ventricles, which were outside the scope of this work, and left supracalcarine cortex, which was excluded due to poor registration, resulting in a total of 111 ROIs per participant. Mean time series were extracted from each ROI and subsequently subjected to a temporal band-pass filter, retaining frequencies between 0.008 and 0.09 Hz. Finally, individual head motion realignment parameters, mean global gray matter, ventricular, and white matter signals were regressed from each ROI time series, and Pearson's correlations between all ROI pairs were calculated on the residuals.
Head Motion
To compare head motion across low, intermediate, and high impulsivity groups, we first calculated the RMS, framewise displacement (FD), and temporal derivative of the fMRI time series (DVARS) (Power et al. 2012) for each group. We then calculated a 1-way analysis of variance (impulsivity groups: low, intermediate, and high) for the RMS, FD, and DVARS separately.
Graph Analyses
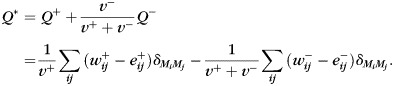
The network of nodes (anatomical ROIs) and edges (statistical relationships) formed by the cross-correlations above was then subjected to graph-based analyses estimating modularity, which is a global graph metric characterizing the clustering and segregation of functional modules. Modularity was calculated in fully weighted functional networks (Newman 2006) using a Louvain fast-unfolding algorithm (Blondel et al. 2008), followed by fine-tuning of the module partition (Sun et al. 2009). We estimated modularity using a measure that takes into account scaled contributions from both positive and negative functional connections, yielding:
 |
(1) |
All reported modularity data represent optimal solutions obtained from 100 000 independent optimizations with varying initial conditions. Optimization of the modularity metric yields the corresponding optimal partition of the network into non-overlapping modules or network communities that were the main objectives of the present study. Partition distances between the 2 partitions M and M′ were computed as the mutual information:
where  , and
, and  is the number of nodes that are simultaneously in module u of partition M and in module u′ of partition M′.
FC Density
The average FC matrix was computed over the entire sample (N = 200), and the modularity analysis of this globally averaged matrix resulted in 4 modules. Using this global module partition, the mean FC density was derived within and between modules for each individual subject by computing the mean overall cross-correlations (positive and negative weights) for each within-module and between-module submatrix. Using a moving window (window size = 20 subjects, overlap of 10 subjects, resulting in 19 group samples across the spectrum of 200 subjects), we then calculated average FC densities for each of the 19 group samples and computed correlations between group-averaged FC density and impulsivity.
Results
Self-Reported Impulsivity
The total raw scores from the BIS ranged from 40 to 106 across the entire sample, with a mean (standard deviation, SD) of 62.43 (9.31). Average BIS scores for the low, intermediate, and high impulsivity groups were 48.2 (SD = 3.78), 60.85 (SD = 1.31), and 79.65 (SD = 7.01), respectively. Note that raw BIS total scores are reported here for comparison with prior work, whereas our 3 groups were identified using residualized latent impulsivity scores (see Materials and Methods) accounting for the effects of gender, IQ, social status, and race/ethnicity (Supplementary Table S2). These residualized scores were highly correlated with raw BIS total scores (r = 0.871, P < 0.001).
Head Motion
Mean (SD) RMS motion for the impulsivity groups were as follows: low 0.07 (0.05), intermediate 0.10 (0.10), and high 0.11 (0.09). A 1-way analysis of variance (impulsivity groups: low, intermediate, and high) revealed no difference in RMS motion across groups (F2,57 = 0.94, P = 0.40). Mean (SD) LD for impulsivity groups were as follows: low 0.06 (0.05), intermediate 0.06 (0.04), and high 0.06 (0.03). A 1-way analysis of variance (impulsivity groups: low, intermediate, and high) revealed no difference in FD across groups (F2,57 = 0.01, P = 0.99). Mean (SD) DVARS for impulsivity groups were as follows: low 0.79 (0.17), intermediate 0.85 (0.20), and high 0.84 (0.14). A 1-way analysis of variance (impulsivity groups: low, intermediate, and high) revealed no difference in DVARS across groups (F2,57 = 0.65, P = 0.53).
General Patterns of Connectivity
Resting-state FC patterns among 111 cortical and subcortical nodes were derived for each individual subject. A composite map, computed as the average functional network over the entire sample, exhibited high modularity as estimated from the fully weighted functional network (eq. 1; Q* = 0.5757) for an optimal partition into modules. Modules were found to be largely symmetric across the 2 cerebral hemispheres, and the composition of these modules closely corresponded to that identified previously (Rubinov and Sporns 2011) in large samples of resting-state fMRI data collected in the 1000 Functional Connectomes Project (Biswal et al. 2010).
Patterns of FC for High, Intermediate, and Low Impulsivity Groups
As detailed in Supplementary Table S3 and Figures 1 and 2, analyses revealed distinct patterns of modularity as a function of impulsivity. In the low impulsivity group, our analyses identified 3 distinct modules (Figs 1A and 2). In contrast, 4 modules were identified in both the middle and high impulsivity groups (Figs 1B,C and 2). Brain areas falling within Module 1 were consistent across all 3 groups and primarily comprised visual areas such as the lateral occipital cortex, cuneus, and the lingual gyrus. Some brain regions in Module 2, such as those associated with sensory and motor functions, were consistent across groups, whereas other regions (e.g. inferior frontal gyrus—pars opercularis, superior temporal gyrus, and supramarginal gyrus) varied as a function of impulsivity.
Figure 1.

Matrix of inter-regional FC averaged over participants with the bottom 10% (A), middle 10% (B), and top 10% (C) of latent impulsivity scores (i.e. low, intermediate, and high impulsivity groups) and displayed for the HOA ROIs used in all analyses. Rows and columns correspond to 111 cortical and subcortical regions, partitioned according to the maximal modularity score and arranged so as to match the ordering of regions given in Supplementary Table S3. Red entries refer to positive FC and blue entries refer to negative FC (see scale to the right). Additionally, the HOA ROIs are overlaid on a template brain using MRIcron and color-coded by the corresponding module partition for the low (D), intermediate (E), and high (F) impulsivity groups: yellow = Module 1, green = Module 2, blue = Module 3, and red = Module 4.
Figure 2.

Backbone plots visualizing the inter-regional FC for the low, intermediate, and high impulsivity groups. The connectivity backbone is derived in 2 steps (Hidalgo et al. 2007). First, we extracted within-module maximum spanning trees connecting all the nodes in each module such that connection weights are maximal. Secondly, connections across the whole network were added in order of their weight until a desired average node degree k (here, k = 14) was reached. The resulting connectivity backbone was then laid out in 2 dimensions using the Kamada–Kawai spring embedding algorithm (Kamada and Kawai 1989). Nodes are colored according to their module assignment: yellow = Module 1, green = Module 2, blue = Module 3, and red = Module 4. See Supplementary Table S4 for ROI abbreviations.
Module 3 changed more dramatically across groups. In the low impulsivity group, Module 3 consisted of both cortical regions (e.g. orbital and medial frontal cortices, posterior cingulate gyrus, and superior, middle, and inferior frontal gyri) and subcortical regions (e.g. thalamus, caudate, hippocampus, amygdala, and nucleus accumbens). In contrast, several of these brain regions were found in Module 4 in both intermediate and high impulsivity groups. In the intermediate group, the brainstem and some subcortical regions including the hippocampus, parahippocampal gyrus, and amygdala were partitioned into Module 4. In the high impulsivity group, Module 4 comprised these subcortical regions as well as the caudate, nucleus accumbens, and thalamus. The temporal pole was in Module 3 in the high and low impulsivity groups, but in Module 4 in the intermediate group.
To assess the stability of the module assignments for each of the 3 groups, we performed a jackknife analysis by recomputing module partitions for subsamples of the 3 groups, leaving out 1 participant at a time. We quantified module stability in 2 ways. In the first approach, we computed the partition distance between each of the 20 subsamples and the original partition for the low, intermediate, and high impulsivity groups. Partition distance was quantified as the mutual information between the partitions, with a value of 1 indicating identical partitions. Average partition distances for the low, intermediate, and high impulsivity groups were 0.9417 (SD = 0.0774), 0.8375 (SD = 0.0807), and 0.8379 (SD = 0.0933), respectively. For comparison, partition distances between the original groups were 0.8030 (low–intermediate), 0.7878 (low–high), and 0.7591 (intermediate–high), and the mean partition distance for between-group subsamples was 0.7485 (SD = 0.0800). These comparisons against the jackknife subsamples indicate that the 3 impulsivity group partitions show a high degree of consistency.
FC Density
This analysis revealed 2 significant within-module and 3 between-module correlations with our latent impulsivity construct (Fig. 3). Impulsivity was positively correlated with FC density within Modules 1 (r = 0.661, P = 0.002) and 3 (r = 0.488, P = 0.0339). That is, as impulsivity increased, functional coupling between brain areas within the visual (Module 1) and cortical control (Module 3) networks increased. Across modules, we found that functional coupling between the visual Module 1 and the cortical control Module 3 (r = −0.739, P = 0.003) as well as the subcortical drive Module 4 (r = −0.549, P = 0.015) decreased as impulsivity increased. Finally, we found that the FC between the sensorimotor Module 2 and the subcortical drive Module 4 increased with increasing impulsivity (r = 0.577, P = 0.0097).
Figure 3.
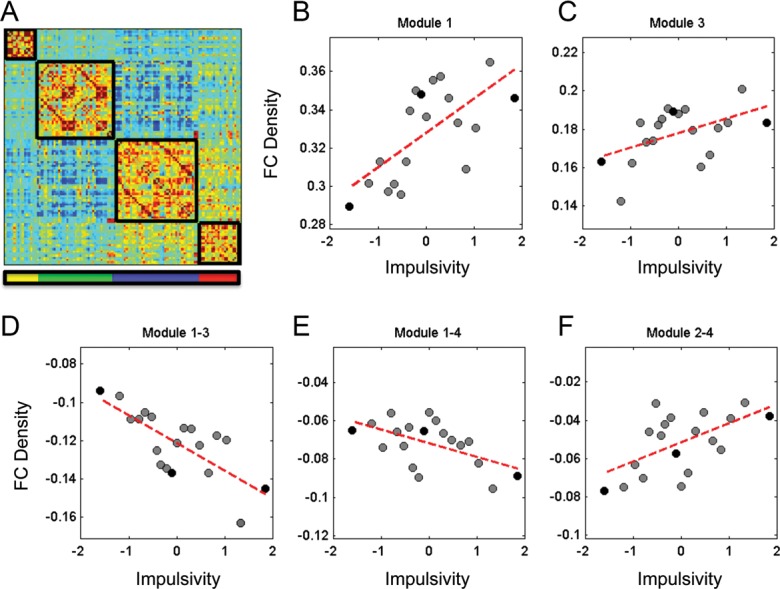
(A) Group average matrix of inter-regional FC with module partitions reflecting those used in the sliding window analysis. (B–F) Scatterplots depicting FC density as a function of impulsivity (z-score). Circles represent average FC density and impulsivity obtained from 20 subject windows of participants ordered along the impulsivity scale (windows overlap by 10 subjects, resulting in 19 group samples across the spectrum of 200 subjects). Black circles represent the low, medium, and high impulsivity groups.
Discussion
Our graph theory analyses of resting-state BOLD fMRI data revealed striking differences in the organization of whole-brain neural networks as a function of impulsivity (Figs 1 and 2 and Supplementary Table S3). Across impulsivity groups, the first and second modules were relatively consistent, in which visual cortical structures clustered together in the first module and sensorimotor structures clustered together in the second module. Interestingly, we found striking differences in module composition in the third and then fourth modules across impulsivity groups. In the low impulsivity group, we observed 3 modules, where the third module comprised cortical regions associated with cognitive control, emotion regulation, and directing and focusing attention clustered together with subcortical regions involved in appetitive drive. In the high impulsivity group, this third module was broken into 2 distinct modules in which the cortical control regions became isolated from subcortical drive structures including the caudate, nucleus accumbens, amygdala, hippocampus, thalamus, and brainstem. These differences in whole-brain functional organization provide support for the idea that high impulsivity reflects a breakdown in effortful, cognitive control over the drive for immediate rewards (Eisenberg et al. 2001; Casey et al. 2008).
While differences in module partitioning between the low and high impulsivity groups are particularly striking, the module partitioning in the intermediate impulsivity group, which reflects the majority of the distribution of impulsivity scores in a general population, provides an interesting contrast to both the low and high groups. In this intermediate group, a smaller subset of the subcortical drive structures breaks off and forms a fourth module. Specifically, the amygdala, hippocampus, parahippocampal gyrus, fusiform, and brain stem move into this fourth module, reflecting the fact that these structures show increased functional coupling with each other and decreased functional coupling with the brain regions that remain in Module 3. Brain regions that remain in Module 3 in this intermediate group include the nucleus accumbens and caudate. The fact that the nucleus accumbens is partitioned into the third module whereas the amygdala and hippocampus fall into the fourth module in this intermediate group is particularly interesting in light of recent research by Nikolova et al. (2011), showing that several patterns of neural reactivity to threat and reward mediate risk for impulsive behavior (i.e. stress-related increases in alcohol consumption). Specifically, the authors found that relatively high reactivity of the ventral striatum (VS), which encompasses the nucleus accumbens, to reward predicted increased stress-related alcohol consumption, but only if participants showed relatively low amygdala reactivity to threat.
Based on these data, Nikolova et al. (2011) propose a new model highlighting interactions between the relative responsiveness of neural circuits to both reward and threat in mediating variability in behavior. Specifically, high amygdala sensitivity to threat could buffer increased VS sensitivity to rewards in the form of impulsive behaviors. The hippocampus, in contrast, is positioned to augment VS reactivity to rewards by providing contextual cues, promoting the maintenance of goal-directed behavior (Grace 2000). Our data are consistent with this model in that in the intermediate impulsivity group, the amygdala and nucleus accumbens are partitioned into different modules, indicating relatively less FC between these brain structures. Thus, the amygdala may have less of an ability to provide threat-related information and act as a “brake” on striatal drive for pursuing rewards. However, since the hippocampus is also relatively separated from the nucleus accumbens in the intermediate group, these individuals may have less hippocampal augmentation of striatal drive. Thus, the absence of an inhibitory signal from the amygdala AND an excitatory signal from the hippocampus may result in a net intermediate level of impulsivity in this group. The partitioning of prefrontal regions and the nucleus accumbens into the same module in this intermediate group relative to the high group may further temper the expression of impulsive behavior by allowing for increased capacity to reevaluate behavioral strategies based on changing contingencies. In contrast, patterns of FC in individuals falling in the low group might lead to “over-regulation” of impulsive behavior. Although this interpretation of the data remains speculative, it provides potentially testable hypotheses regarding the mechanisms through which FC patterns are related to impulsivity.
The principle finding from our analyses is the decreased functional coupling between cortical control and subcortical drive modules as a function of increasing impulsivity. Our secondary sliding window analysis of changes in FC density across the continuum of impulsivity suggests that several patterns converge to drive this principle finding. First, regions within the cortical control module couple more tightly together as impulsivity increases. Secondly, the correlation between the cortical control module and the visual module becomes weaker. Thirdly, the correlation between the sensorimotor module and the subcortical drive module becomes stronger. The overall result is that the links between the cortical control and subcortical drive regions become relatively more fragile, driving their separation into distinct modules as impulsivity increases.
A primary function of brain regions such as the amygdala and nucleus accumbens is to assign reinforcement value to environmental stimuli (Weiskrantz 1956) and to influence goal-directed behavior (Sesack and Grace 2010). Increased functional coupling between the sensorimotor module and the subcortical drive module encompassing these structures may manifest as impulsive behavior since these brain areas have increased access to environmental input (sensory systems) and influence over behavioral output (motor systems). Higher impulsivity was also associated with increased functional coupling of regions within the cortical control module. This finding may reflect greater effortful control in more impulsive individuals necessary to achieve task-related goals.
The mechanisms underlying the changes in connectivity within regions of the visual module as well as between this module and other modules reinforce the idea that the visual cortex may play an important (albeit largely ignored) role in disorders commonly associated with impulsivity, such as ADHD (Castellanos and Proal 2011). Previous research suggests that impulsivity is associated with augmented event-related potentials to visual stimuli (Carrillo-De-La-Pena and Barratt 1993), which may be related to the increased connectivity within the visual module observed here. Our analyses also revealed decreased functional coupling between the visual and the cortical control and subcortical drive modules with increasing impulsivity. We speculate that this may reflect less effective integration of perceptual information, appetitive drive, and regulatory control. Similar “uncoupling” has been observed in clinical populations characterized by increased impulsivity (e.g. ADHD), in which there is increased distractibility to sensory input and decreased FC between attentional control regions and the visual system, resulting in enhanced distraction by irrelevant visual input and difficulty sustaining attention (Capotosto et al. 2009; Shulman et al. 2009).
It should be noted that weak FC density as observed in our resting-state BOLD data may have at least 2 causes: (1) 2 regions truly interact less or (2) 2 regions engage in a more variable interaction over time resulting in intermittent coupling (Chang and Glover 2010; Smith et al. 2012). Resting-state analyses of the kind where several minutes of activity are averaged together into a single coupling parameter cannot distinguish between these 2 possibilities. Thus, the decreased FC between the visual and the cortical control and subcortical drive modules is difficult to interpret. Studies employing substantially longer resting-state-fMRI scans are needed to allow more fine-grained analysis of the temporal variability of coupling.
Cognitive models of impulsivity suggest that internalizing versus externalizing behaviors may reflect a breakdown between different regulation processes (Eisenberg et al. 2001). Specifically, effortful cognitive control reflects executive inhibition processes, including attentional regulation. Children displaying both internalizing and externalizing behaviors tend to be impaired on these cognitive control processes, compared with well-adjusted children. These data are consistent with the idea that those with intermediate levels of trait impulsivity tend to be well-adjusted, whereas relatively high “and” low impulsivity may be related to maladaptive behavior (Eisenberg et al. 2001).
While Eisenberg et al. (2001) found that children scoring high and low on impulsivity showed less effortful control than well-adjusted children, the most impulsive individuals showed the least amount of effortful control overall. Developmental studies suggest that impulsive behavior may result from 2 separate processes—increased sensation seeking in the form of pursuing rewards and reduced cognitive control (Steinberg 2010). Moreover, these processes develop along different trajectories, consistent with the idea that different neural systems subserve these functions. Research shows that performance on response inhibition tasks is associated with age-related maturation of brain regions within the frontostriatal circuitry in both cross-sectional (Casey et al. 1997; Luna et al. 2001; Bunge et al. 2002; Durston et al. 2002) and longitudinal (Durston et al. 2006; Casey et al. 2011) samples. Developmental studies have also shown that as response inhibition improves with age, both structural connectivity (Liston et al. 2006) and FC (Somerville et al. 2011) between frontal and striatal brain areas mature. Clinical populations characterized by highly impulsive behavior such as ADHD also show abnormal frontostriatal recruitment during response inhibition tasks (Vaidya et al. 1998; Durston et al. 2003).
Our study database allows us to compare the modular organization of whole-brain networks in a large number of individuals at the tail-ends of the impulsivity distribution, which provides for reasonable comparison with the clinical populations noted earlier. Nevertheless, it will be important to determine the extent to which these patterns generalize, as our study was limited by a sample with a restricted age range of psychiatrically healthy individuals as well as individuals who had mild psychopathology (without pharmacological treatment), according to the current nosological framework (Supplementary Table S1). In addition, future studies relating the whole-brain network organization described here to task-based fMRI studies of frontostriatal function will shed further light on the mechanisms underlying impulsive behavior in normal and abnormal populations. Such multimodal integration should inform how the general topology of whole-brain networks at rest influences the specific, task-elicited responses of behaviorally relevant functional circuits.
Another potential limitation of the current study is that we acquired relatively short resting-state scans and did not collect biological measures such as heart rate and respiration, which may introduce noise into our analyses (Birn et al. 2009; Chang et al. 2009). Given the short duration of our resting-state scans, we did not implement “scrubbing” procedures (Power et al. 2012) to censor high motion intensity fluctuation spikes. However, we found no difference in head motion across the 3 impulsivity groups (see Results). Future studies acquiring longer scans, implementing scrubbing procedures, and controlling for biological noise may allow more stable estimates of functional coupling as well as assessment of their dynamic variation on shorter time scales.
In the present study, we defined our ROIs using the HOA, but such anatomical atlases may be problematic since functional boundaries do not directly correspond to tissue histology. Future work using novel strategies to define ROIs (Cohen et al. 2008; Wig et al. 2011) will allow for finer sensitivity in delineating whole-brain network organization that more directly corresponds to functional boundaries. Future work should also include the application of additional local and global metrics of network topology and the mapping of whole-brain structural connections that shape FC. Mapping of these structural connections may disclose the anatomical basis of the observed functional effects and allow more direct inferences on putative neural processing paths, whereas the analysis of task-evoked neural activations will complement the pattern of FC obtained in the resting state.
While theories of the biological substrates of personality have focused on specific brain regions, neurotransmitters, or neurobehavioral circuits, the present data raise the possibility that more global network features may also underlie general features of personality, including specific traits such as impulsivity that may reflect differences in information processing styles (Humphreys and Revelle 1984). Critically, our current approach complements existing research programs, which have been largely focused on relationships between impulsivity and individual brain regions or discrete circuits. Such research indicates that impulsivity is related to aberrant FC within cortical control networks (Williams et al. 2006; Goya-Maldonado et al. 2010; Shannon et al. 2011; Wolf et al. 2011) as well as in mesocorticostriatal (Dalley et al. 2008) and corticolimbic (Liston et al. 2011) circuitries. The present data extend these findings by providing a novel demonstration that patterns of whole-brain network organization, which simultaneously models variability in these as well as many other brain circuits, vary as a function of trait impulsivity. Moreover, our results provide initial evidence that individuals reporting high and low impulsivity show unique differences in functional whole-brain network organization compared with individuals falling in the middle of the spectrum. These patterns may usefully and uniquely inform ongoing efforts to identify the shared and unique etiology of internalizing and externalizing psychopathology, as well as to establish specific neural mechanisms of risk associated with impulsivity that could serve as novel treatment targets.
Supplementary Material
Supplementary material can be found at: http://www.cercor.oxfordjournals.org/.
Funding
The DNS is supported by Duke University. F.C.D. and A.R.H. received support from NIH grant R01DA031579. A.R.H. also received support from NIH grants R01 DA026222 and MH088680. B.B.L. received support from NIH grant R01MH59111. O.S. was supported by the J.S. McDonnell Foundation.
Supplementary Material
Notes
The authors would like to thank Ryan Bogdan, Adam Gorka, Yuliya Nikolova, and Gagan Wig for useful feedback. Conflict of Interest: None declared.
References
- Adler NE, Epel ES, Castellazzo G, Ickovics JR. Relationship of subjective and objective social status with psychological and physiological functioning: preliminary data in healthy white women. Health Psychol. 2000;19:586–592. doi: 10.1037//0278-6133.19.6.586. [DOI] [PubMed] [Google Scholar]
- Alessi SM, Petry NM. Pathological gambling severity is associated with impulsivity in a delay discounting procedure. Behav Process. 2003;64:345–354. doi: 10.1016/s0376-6357(03)00150-5. [DOI] [PubMed] [Google Scholar]
- Beck A, Schlagenhauf F, Wustenberg T, Hein J, Kienast T, Kahnt T, Schmack K, Hagele C, Knutson B, Heinz A, et al. Ventral striatal activation during reward anticipation correlates with impulsivity in alcoholics. Biol Psychiatr. 2009;66:734–742. doi: 10.1016/j.biopsych.2009.04.035. [DOI] [PubMed] [Google Scholar]
- Birn RM, Murphy K, Handwerker DA, Bandettini PA. fMRI in the presence of task-correlated breathing variations. NeuroImage. 2009;47:1092–1104. doi: 10.1016/j.neuroimage.2009.05.030. [DOI] [PMC free article] [PubMed] [Google Scholar]
- Biswal BB, Mennes M, Zuo XN, Gohel S, Kelly C, Smith SM, Beckmann CF, Adelstein JS, Buckner RL, Colcombe S, et al. Toward discovery science of human brain function. Proc Natl Acad Sci USA. 2010;107:4734–4739. doi: 10.1073/pnas.0911855107. [DOI] [PMC free article] [PubMed] [Google Scholar]
- Blondel VD, Guillaume JL, Lambiotte R, Lefebvre E. Fast unfolding of communities in large networks. J Stat Mech Theory Exp. 2008:P10008. 2008 [Google Scholar]
- Brown SM, Manuck SB, Flory JD, Hariri AR. Neural basis of individual differences in impulsivity: contributions of corticolimbic circuits for behavioral arousal and control. Emotion. 2006;6:239–245. doi: 10.1037/1528-3542.6.2.239. [DOI] [PubMed] [Google Scholar]
- Buckholtz JW, Treadway MT, Cowan RL, Woodward ND, Li R, Ansari MS, Baldwin RM, Schwartzman AN, Shelby ES, Smith CE, et al. Dopaminergic network differences in human impulsivity. Science. 2010;329:532. doi: 10.1126/science.1185778. [DOI] [PMC free article] [PubMed] [Google Scholar]
- Bullmore E, Sporns O. Complex brain networks: graph theoretical analysis of structural and functional systems. Nat Rev Neurosci. 2009;10:186–198. doi: 10.1038/nrn2575. [DOI] [PubMed] [Google Scholar]
- Bunge SA, Dudukovic NM, Thomason ME, Vaidya CJ, Gabrieli JD. Immature frontal lobe contributions to cognitive control in children: evidence from fMRI. Neuron. 2002;33:301–311. doi: 10.1016/s0896-6273(01)00583-9. [DOI] [PMC free article] [PubMed] [Google Scholar]
- Capotosto P, Babiloni C, Romani GL, Corbetta M. Frontoparietal cortex controls spatial attention through modulation of anticipatory alpha rhythms. J Neurosci. 2009;29:5863–5872. doi: 10.1523/JNEUROSCI.0539-09.2009. [DOI] [PMC free article] [PubMed] [Google Scholar]
- Cardinal RN, Pennicott DR, Sugathapala CL, Robbins TW, Everitt BJ. Impulsive choice induced in rats by lesions of the nucleus accumbens core. Science. 2001;292:2499–2501. doi: 10.1126/science.1060818. [DOI] [PubMed] [Google Scholar]
- Carrillo-De-La-Pena MT, Barratt ES. Impulsivity and ERP augmenting/reducing. Person Individual Diff. 1993;15:25–32. [Google Scholar]
- Casey BJ, Jones RM, Hare TA. The adolescent brain. Ann N Y Acad Sci. 2008;1124:111–126. doi: 10.1196/annals.1440.010. [DOI] [PMC free article] [PubMed] [Google Scholar]
- Casey BJ, Somerville LH, Gotlib IH, Ayduk O, Franklin NT, Askren MK, Jonides J, Berman MG, Wilson NL, Teslovich T, et al. Behavioral and neural correlates of delay of gratification 40 years later. Proc Natl Acad Sci USA. 2011;108:14998–15003. doi: 10.1073/pnas.1108561108. [DOI] [PMC free article] [PubMed] [Google Scholar]
- Casey BJ, Trainor R, Orendi JL, Schubert AB, Nystrom LE, Giedd J, Castellanos FX, Haxby JV, Noll DC, Cohen JD, et al. A developmental functional MRI study of prefrontal activation during performance of a go-no-go task. J Cogn Neurosci. 1997;9:835–847. doi: 10.1162/jocn.1997.9.6.835. [DOI] [PubMed] [Google Scholar]
- Castellanos FX, Proal E. Large-scale brain systems in ADHD: beyond the prefrontal-striatal model. Trends Cogn Sci. 2012;16:17–26. doi: 10.1016/j.tics.2011.11.007. [DOI] [PMC free article] [PubMed] [Google Scholar]
- Chang C, Cunningham JP, Glover GH. Influence of heart rate on the BOLD signal: the cardiac response function. NeuroImage. 2009;44:857–869. doi: 10.1016/j.neuroimage.2008.09.029. [DOI] [PMC free article] [PubMed] [Google Scholar]
- Chang C, Glover GH. Time-frequency dynamics of resting-state brain connectivity measured with fMRI. NeuroImage. 2010;50:81–98. doi: 10.1016/j.neuroimage.2009.12.011. [DOI] [PMC free article] [PubMed] [Google Scholar]
- Chanraud S, Pitel AL, Pfefferbaum A, Sullivan EV. Disruption of functional connectivity of the default-mode network in alcoholism. Cereb Cortex. 2011;21:2272–2281. doi: 10.1093/cercor/bhq297. [DOI] [PMC free article] [PubMed] [Google Scholar]
- Cohen AL, Fair DA, Dosenbach NU, Miezin FM, Dierker D, Van Essen DC, Schlaggar BL, Petersen SE. Defining functional areas in individual human brains using resting functional connectivity MRI. NeuroImage. 2008;41:45–57. doi: 10.1016/j.neuroimage.2008.01.066. [DOI] [PMC free article] [PubMed] [Google Scholar]
- Corruble E, Damy C, Guelfi JD. Impulsivity: a relevant dimension in depression regarding suicide attempts? J Affect Disord. 1999;53:211–215. doi: 10.1016/s0165-0327(98)00130-x. [DOI] [PubMed] [Google Scholar]
- Corruble E, Hatem N, Damy C, Falissard B, Guelfi JD, Reynaud M, Hardy P. Defense styles, impulsivity and suicide attempts in major depression. Psychopathology. 2003;36:279–284. doi: 10.1159/000075185. [DOI] [PubMed] [Google Scholar]
- Cosi S, Hernandez-Martinez C, Canals J, Vigil-Colet A. Impulsivity and internalizing disorders in childhood. Psychiatr Res. 2011;190:342–347. doi: 10.1016/j.psychres.2011.05.036. [DOI] [PubMed] [Google Scholar]
- Dalley JW, Mar AC, Economidou D, Robbins TW. Neurobehavioral mechanisms of impulsivity: fronto-striatal systems and functional neurochemistry. Pharmacol Biochem Behav. 2008;90:250–260. doi: 10.1016/j.pbb.2007.12.021. [DOI] [PubMed] [Google Scholar]
- Dolan M, Deakin WJ, Roberts N, Anderson I. Serotonergic and cognitive impairment in impulsive aggressive personality disordered offenders: are there implications for treatment? Psychol Med. 2002;32:105–117. doi: 10.1017/s0033291701004688. [DOI] [PubMed] [Google Scholar]
- Durston S, Davidson MC, Tottenham N, Galvan A, Spicer J, Fossella JA, Casey BJ. A shift from diffuse to focal cortical activity with development. Dev Sci. 2006;9:1–8. doi: 10.1111/j.1467-7687.2005.00454.x. [DOI] [PubMed] [Google Scholar]
- Durston S, Thomas KM, Worden MS, Yang Y, Casey BJ. The effect of preceding context on inhibition: an event-related fMRI study. NeuroImage. 2002;16:449–453. doi: 10.1006/nimg.2002.1074. [DOI] [PubMed] [Google Scholar]
- Durston S, Tottenham NT, Thomas KM, Davidson MC, Eigsti IM, Yang Y, Ulug AM, Casey BJ. Differential patterns of striatal activation in young children with and without ADHD. Biol Psychiatr. 2003;53:871–878. doi: 10.1016/s0006-3223(02)01904-2. [DOI] [PubMed] [Google Scholar]
- Eisenberg N, Cumberland A, Spinrad TL, Fabes RA, Shepard SA, Reiser M, Murphy BC, Losoya SH, Guthrie IK. The relations of regulation and emotionality to children's externalizing and internalizing problem behavior. Child Dev. 2001;72:1112–1134. doi: 10.1111/1467-8624.00337. [DOI] [PubMed] [Google Scholar]
- Eisenberg N, Valiente C, Spinrad TL, Liew J, Zhou Q, Losoya SH, Reiser M, Cumberland A. Longitudinal relations of children's effortful control, impulsivity, and negative emotionality to their externalizing, internalizing, and co-occurring behavior problems. Dev Psychol. 2009;45:988–1008. doi: 10.1037/a0016213. [DOI] [PMC free article] [PubMed] [Google Scholar]
- First M, Spitzer M, Williams J, Gibbon M. Structured clinical interview for DSM-V (SCID) Washington (DC): American Psychiatric Association; 1995. [Google Scholar]
- Flory JD, Harvey PD, Mitropoulou V, New AS, Silverman JM, Siever LJ, Manuck SB. Dispositional impulsivity in normal and abnormal samples. J Psychiatr Res. 2006;40:438–447. doi: 10.1016/j.jpsychires.2006.01.008. [DOI] [PubMed] [Google Scholar]
- Forbes EE, Brown SM, Kimak M, Ferrell RE, Manuck SB, Hariri AR. Genetic variation in components of dopamine neurotransmission impacts ventral striatal reactivity associated with impulsivity. Mol Psychiatr. 2009;14:60–70. doi: 10.1038/sj.mp.4002086. [DOI] [PMC free article] [PubMed] [Google Scholar]
- Fox MD, Raichle ME. Spontaneous fluctuations in brain activity observed with functional magnetic resonance imaging. Nat Rev Neurosci. 2007;8:700–711. doi: 10.1038/nrn2201. [DOI] [PubMed] [Google Scholar]
- Girvan M, Newman ME. Community structure in social and biological networks. Proc Natl Acad Sci USA. 2002;99:7821–7826. doi: 10.1073/pnas.122653799. [DOI] [PMC free article] [PubMed] [Google Scholar]
- Goya-Maldonado R, Walther S, Simon J, Stippich C, Weisbrod M, Kaiser S. Motor impulsivity and the ventrolateral prefrontal cortex. Psychiatr Res. 2010;183:89–91. doi: 10.1016/j.pscychresns.2010.04.006. [DOI] [PubMed] [Google Scholar]
- Grace AA. Gating of information flow within the limbic system and the pathophysiology of schizophrenia. Brain Res Brain Res Rev. 2000;31:330–341. doi: 10.1016/s0165-0173(99)00049-1. [DOI] [PubMed] [Google Scholar]
- Hidalgo CA, Klinger B, Barabasi AL, Hausmann R. The product space conditions the development of nations. Science. 2007;317:482–487. doi: 10.1126/science.1144581. [DOI] [PubMed] [Google Scholar]
- Humphreys MS, Revelle W. Personality, motivation, and performance: a theory of the relationship between individual differences and information processing. Psychol Rev. 1984;91:153–184. [PubMed] [Google Scholar]
- Jentsch JD, Taylor JR. Impulsivity resulting from frontostriatal dysfunction in drug abuse: implications for the control of behavior by reward-related stimuli. Psychopharmacology (Berl) 1999;146:373–390. doi: 10.1007/pl00005483. [DOI] [PubMed] [Google Scholar]
- Kamada T, Kawai S. An algorithm for drawing general undirected graphs. Inform Process Lett. 1989;31:7–15. [Google Scholar]
- King JA, Tenney J, Rossi V, Colamussi L, Burdick S. Neural substrates underlying impulsivity. Ann N Y Acad Sci. 2003;1008:160–169. doi: 10.1196/annals.1301.017. [DOI] [PubMed] [Google Scholar]
- Kirby KN, Petry NM, Bickel WK. Heroin addicts have higher discount rates for delayed rewards than non-drug-using controls. J Exp Psychol Gen. 1999;128:78–87. doi: 10.1037//0096-3445.128.1.78. [DOI] [PubMed] [Google Scholar]
- Krueger RF, Markon KE. Reinterpreting comorbidity: a model-based approach to understanding and classifying psychopathology. Annu Rev Clin Psychol. 2006;2:111–133. doi: 10.1146/annurev.clinpsy.2.022305.095213. [DOI] [PMC free article] [PubMed] [Google Scholar]
- Krueger RF, Markon KE, Patrick CJ, Iacono WG. Externalizing psychopathology in adulthood: a dimensional-spectrum conceptualization and its implications for DSM-V. J Abnorm Psychol. 2005;114:537–550. doi: 10.1037/0021-843X.114.4.537. [DOI] [PMC free article] [PubMed] [Google Scholar]
- Liston C, Cohen MM, Teslovich T, Levenson D, Casey BJ. Atypical prefrontal connectivity in attention-deficit/hyperactivity disorder: pathway to disease or pathological end point? Biol Psychiatr. 2011;69:1168–1177. doi: 10.1016/j.biopsych.2011.03.022. [DOI] [PubMed] [Google Scholar]
- Liston C, Watts R, Tottenham N, Davidson MC, Niogi S, Ulug AM, Casey BJ. Frontostriatal microstructure modulates efficient recruitment of cognitive control. Cereb Cortex. 2006;16:553–560. doi: 10.1093/cercor/bhj003. [DOI] [PubMed] [Google Scholar]
- Luna B, Thulborn KR, Munoz DP, Merriam EP, Garver KE, Minshew NJ, Keshavan MS, Genovese CR, Eddy WF, Sweeney JA. Maturation of widely distributed brain function subserves cognitive development. NeuroImage. 2001;13:786–793. doi: 10.1006/nimg.2000.0743. [DOI] [PubMed] [Google Scholar]
- Madden GJ, Petry NM, Badger GJ, Bickel WK. Impulsive and self-control choices in opioid-dependent patients and non-drug-using control participants: drug and monetary rewards. Exp Clin Psychopharmacol. 1997;5:256–262. doi: 10.1037//1064-1297.5.3.256. [DOI] [PubMed] [Google Scholar]
- McClure SM, Laibson DI, Loewenstein G, Cohen JD. Separate neural systems value immediate and delayed monetary rewards. Science. 2004;306:503–507. doi: 10.1126/science.1100907. [DOI] [PubMed] [Google Scholar]
- Moeller FG, Barratt ES, Dougherty DM, Schmitz JM, Swann AC. Psychiatric aspects of impulsivity. Am J Psychiatr. 2001;158:1783–1793. doi: 10.1176/appi.ajp.158.11.1783. [DOI] [PubMed] [Google Scholar]
- Newman ME. Finding community structure in networks using the eigenvectors of matrices. Phys Rev E Stat Nonlin Soft Matter Phys. 2006;74:036104. doi: 10.1103/PhysRevE.74.036104. [DOI] [PubMed] [Google Scholar]
- Nikolova YS, Sochat V, Brigidi BD, Hariri AR. Society for Research in Psychopathology. Boston (MA): 2011. Protective effects of threat-related amygdala reactivity against increased alcohol consumption in the context of recent life stress. [Google Scholar]
- Patton JH, Stanford MS, Barratt ES. Factor structure of the Barratt impulsiveness scale. J Clin Psychol. 1995;51:768–774. doi: 10.1002/1097-4679(199511)51:6<768::aid-jclp2270510607>3.0.co;2-1. [DOI] [PubMed] [Google Scholar]
- Power JD, Barnes KA, Snyder AZ, Schlaggar BL, Petersen SE. Spurious but systematic correlations in functional connectivity MRI networks arise from subject motion. NeuroImage. 2012;59:2142–2154. doi: 10.1016/j.neuroimage.2011.10.018. [DOI] [PMC free article] [PubMed] [Google Scholar]
- Raichle ME. The restless brain. Brain Connect. 2011;1:3–12. doi: 10.1089/brain.2011.0019. [DOI] [PMC free article] [PubMed] [Google Scholar]
- Romero MJ, Asensio S, Palau C, Sanchez A, Romero FJ. Cocaine addiction: diffusion tensor imaging study of the inferior frontal and anterior cingulate white matter. Psychiatr Res. 2010;181:57–63. doi: 10.1016/j.pscychresns.2009.07.004. [DOI] [PubMed] [Google Scholar]
- Rubinov M, Sporns O. Weight-conserving characterization of complex functional brain networks. NeuroImage. 2011;56:2068–2079. doi: 10.1016/j.neuroimage.2011.03.069. [DOI] [PubMed] [Google Scholar]
- Sesack SR, Grace AA. Cortico-basal ganglia reward network: microcircuitry. Neuropsychopharmacology. 2010;35:27–47. doi: 10.1038/npp.2009.93. [DOI] [PMC free article] [PubMed] [Google Scholar]
- Shannon BJ, Raichle ME, Snyder AZ, Fair DA, Mills KL, Zhang D, Bache K, Calhoun VD, Nigg JT, Nagel BJ, et al. Premotor functional connectivity predicts impulsivity in juvenile offenders. Proc Natl Acad Sci USA. 2011;108:11241–11245. doi: 10.1073/pnas.1108241108. [DOI] [PMC free article] [PubMed] [Google Scholar]
- Shulman GL, Astafiev SV, Franke D, Pope DL, Snyder AZ, McAvoy MP, Corbetta M. Interaction of stimulus-driven reorienting and expectation in ventral and dorsal frontoparietal and basal ganglia-cortical networks. J Neurosci. 2009;29:4392–4407. doi: 10.1523/JNEUROSCI.5609-08.2009. [DOI] [PMC free article] [PubMed] [Google Scholar]
- Smith SM, Miller KL, Moeller S, Xu J, Auerbach EJ, Woolrich MW, Beckmann CF, Jenkinson M, Andersson J, Glasser MF, et al. Temporally-independent functional modes of spontaneous brain activity. Proc Natl Acad Sci USA. 2012;109:3131–3136. doi: 10.1073/pnas.1121329109. [DOI] [PMC free article] [PubMed] [Google Scholar]
- Somerville LH, Hare T, Casey BJ. Frontostriatal maturation predicts cognitive control failure to appetitive cues in adolescents. J Cogn Neurosci. 2011;23:2123–2134. doi: 10.1162/jocn.2010.21572. [DOI] [PMC free article] [PubMed] [Google Scholar]
- Sporns O, Chialvo DR, Kaiser M, Hilgetag CC. Organization, development and function of complex brain networks. Trends Cogn Sci. 2004;8:418–425. doi: 10.1016/j.tics.2004.07.008. [DOI] [PubMed] [Google Scholar]
- Steinberg L. A dual systems model of adolescent risk-taking. Dev Psychobiol. 2010;52:216–224. doi: 10.1002/dev.20445. [DOI] [PubMed] [Google Scholar]
- Sun Y, Danila B, Josic K, Bassler KE. Improved community structure detection using a modified fine-tuning strategy. Europhys Lett. 2009;86:1–6. [Google Scholar]
- Swann AC, Lijffijt M, Lane SD, Steinberg JL, Moeller FG. Trait impulsivity and response inhibition in antisocial personality disorder. J Psychiatr Res. 2009;43:1057–1063. doi: 10.1016/j.jpsychires.2009.03.003. [DOI] [PMC free article] [PubMed] [Google Scholar]
- Vaidya CJ, Austin G, Kirkorian G, Ridlehuber HW, Desmond JE, Glover GH, Gabrieli JD. Selective effects of methylphenidate in attention deficit hyperactivity disorder: a functional magnetic resonance study. Proc Natl Acad Sci USA. 1998;95:14494–14499. doi: 10.1073/pnas.95.24.14494. [DOI] [PMC free article] [PubMed] [Google Scholar]
- Volkow ND, Fowler JS. Addiction, a disease of compulsion and drive: involvement of the orbitofrontal cortex. Cereb Cortex. 2000;10:318–325. doi: 10.1093/cercor/10.3.318. [DOI] [PubMed] [Google Scholar]
- Wang L, Zhu C, He Y, Zang Y, Cao Q, Zhang H, Zhong Q, Wang Y. Altered small-world brain functional networks in children with attention-deficit/hyperactivity disorder. Hum Brain Mapp. 2009;30:638–649. doi: 10.1002/hbm.20530. [DOI] [PMC free article] [PubMed] [Google Scholar]
- Weiskrantz L. Behavioral changes associated with ablation of the amygdaloid complex in monkeys. J Comp Physiol Psychol. 1956;49:381–391. doi: 10.1037/h0088009. [DOI] [PubMed] [Google Scholar]
- Wig GS, Schlaggar BL, Petersen SE. Concepts and principles in the analysis of brain networks. Ann N Y Acad Sci. 2011;1224:126–146. doi: 10.1111/j.1749-6632.2010.05947.x. [DOI] [PubMed] [Google Scholar]
- Williams LM, Sidis A, Gordon E, Meares RA. “Missing links” in borderline personality disorder: loss of neural synchrony relates to lack of emotion regulation and impulse control. J Psychiatr Neurosci. 2006;31:181–188. [PMC free article] [PubMed] [Google Scholar]
- Wolf RC, Sambataro F, Vasic N, Schmid M, Thomann PA, Bienentreu SD, Wolf ND. Aberrant connectivity of resting-state networks in borderline personality disorder. J Psychiatr Neurosci. 2011;36:402–411. doi: 10.1503/jpn.100150. [DOI] [PMC free article] [PubMed] [Google Scholar]
- Xie C, Li SJ, Shao Y, Fu L, Goveas J, Ye E, Li W, Cohen AD, Chen G, Zhang Z, et al. Identification of hyperactive intrinsic amygdala network connectivity associated with impulsivity in abstinent heroin addicts. Behav Brain Res. 2011;216:639–646. doi: 10.1016/j.bbr.2010.09.004. [DOI] [PMC free article] [PubMed] [Google Scholar]
- Zhang T, Wang J, Yang Y, Wu Q, Li B, Chen L, Yue Q, Tang H, Yan C, Lui S, et al. Abnormal small-world architecture of top-down control networks in obsessive-compulsive disorder. J Psychiatr Neurosci. 2011;36:23–31. doi: 10.1503/jpn.100006. [DOI] [PMC free article] [PubMed] [Google Scholar]
Associated Data
This section collects any data citations, data availability statements, or supplementary materials included in this article.