Abstract
Several assay technologies have been successfully adapted and used in HTS to screen for protein kinase inhibitors; however, emerging comparative analysis studies report very low hit overlap between the different technologies, which challenges the working assumption that hit identification is not dependent on the assay method of choice. To help address this issue, we performed two screens on the cancer target, Cdc7-Dbf4 heterodimeric protein kinase, using a direct assay detection method measuring [33P]-phosphate incorporation into the substrate and an indirect method measuring residual ADP production using luminescence. We conducted the two screens under similar conditions, where in one, we measured [33P]-phosphate incorporation using scintillation proximity assay (SPA), and in the other, we detected luminescence signal of the ATP-dependent luciferase after regenerating ATP from residual ADP (LUM). Surprisingly, little or no correlation were observed between the positives identified by the two methods; at a threshold of 30% inhibition, 25 positives were identified in the LUM screen whereas the SPA screen only identified two positives, Tannic acid and Gentian violet, with Tannic acid being common to both. We tested 20 out of the 25 positive compounds in secondary confirmatory study and confirmed 12 compounds including Tannic acid as Cdc7-Dbf4 kinase inhibitors. Gentian violet, which was only positive in the SPA screen, inhibited luminescence detection and categorized as a false positive. This report demonstrates the strong impact in detection format on the success of a screening campaign and the importance of carefully designed confirmatory assays to eliminate those compounds that target the detection part of the assay.
Keywords: Cdc7-Dbf4 kinase, drug discovery, inhibitor, luminescence, phosphorylation, protein kinase
INTRODUCTION
Protein kinases represent one of the most important target class for small molecule discovery and intervention,1–5 and over the years, several assay detection methodologies have been developed and implemented for screening compound libraries to identify novel and selective hits against specific kinases.3,6,7 In general, these methods either measure direct phosphorylation of the substrate or indirectly measure ATP consumption. The gold standard kinase assay method of all times is the direct measure of [33P]-phosphate incorporation into the substrate via tyrosine, serine or threonine amino acid residues. In terms of the assay format, this method has evolved from the earlier days of vial-based scintillation counting P30 filter binding paper to homogeneous scintillation proximity assays (SPA) miniaturized in 384-well microtiter plates.8,9 More recently, however, rules and regulations governing the health, safety and environmental issues over the production, acquisition, usage, and waste disposal of radioactivity have prompted the exploration of alternative non-radioactive based methods.
Non-radiometric based platforms, measuring 1) phosphorylated product such as ELISAs,10 time-resolved fluorometry (DELFIA™),11 time-resolved fluorescence resonance energy transfer (TR-FRET),12,13 and fluorescence polarization (FP),14 or 2) ATP consumption such as kinetic coupled assays,15 and luminescence-based assays,16 have been developed and successfully implemented in many screening laboratories. The former platform relies on specific anti-phosphopeptide antibodies and/or the correct peptide sequence for the substrate. Identification of the correct peptide substrate and the corresponding antibody, however, can be very enormously costly and time-consuming with serine/threonine kinases in particular. The latter platform of measuring ATP consumption using firefly luciferase does not depend on phosphopeptide antibodies. A major bottleneck of this technology, however, is that high levels of enzyme concentration at high levels of ATP consumption are required to produce a robust signal. The same firefly luciferase can also be used to measure the amount of ADP produced in a kinase reaction.17 This method (ADP-Glo™) detects ATP regeneration-based luciferase reaction resulting from nascent ADP phosphorylation. The luminescence signal is proportional to the ADP amount and represents the kinase activity. This detection platform requires low enzyme concentration and low ATP conversion level and been reported to be superior over the conventional ATP consumption assays. In spite of the so proclaimed forte, luciferase-based methods are in general susceptible to format-specific false positives as well as negatives both of which interfere with assay components such as luciferase inhibitors.18
Regarding correlation between different detection methods and the degree of hit overlap, reported results are mixed. Comparative studies report limited hit overlap between different detection technologies with an example where a performed screen of 30,000 compounds identified very limited hit overlap amongst three methods: SPA, TR-FRET, and FP.19 Similar results were also reported using AlphaScreen™ and TR-FRET assay methods to screen for nuclear receptor FXR inhibitors.20,21 These results beg the question of whether identified hits in screening are supposed to show a priori inhibitory effects irrespective of the choice of detection platform. Other studies reported high correlation between a radiometric filter binding assay and an FP assay for ROCK-II inhibitors,22 SPA and TR-FRET for non-receptor tyrosine kinase inhibitors,23 and ATP measurement and TR-FRET for ROCK-II inhibitors,16 assigning high assay quality and identical biochemical settings as essential attributing factors.23
In the present study, we conducted two screens on the cancer target, Cdc7-Dbf4 kinase,24,25 using a direct assay detection method measuring [33P]-phosphate incorporation into the substrate and an indirect method measuring residual ADP production using luminescence. In the first screen, we tested a collection of 2,879 compounds by measuring [33P]-phosphate incorporation using scintillation proximity assay (the SPA method). In the second screen, we tested a collection of 3,519 compounds (which contained 2,879 compounds in the first screen) by measuring detected luminescence signal of the ATP-dependent luciferase after regenerating ATP from residual ADP (the LUM method). This report evaluates these two methods based on the results from the two separate screens under similar experimental conditions and addresses the question of whether the choice of detection method affects assay performance for hit identification.
MATERIALS AND METHODS
Reagents
Hepes, NaCl, KOH, 2-mercaptoethanol (2-ME), and sodium orthovanadate were purchased from Sigma Aldrich (St. Louis, MO). Glycerol was obtained from JT Baker (Phillipsburg, NJ). MgCl2 was purchased from Rockland Immunochemicals (Gilbertsville, PA). DTT was purchased from USB (Cleveland, Ohio). Tween 20 was purchased from Pierce (Rockford, IL). Dimethyl sulfoxide (DMSO) was purchased from PHARMCO-AAPER (Brookfield, CT). HIS TAG PS Imaging beads were purchased from GE Healthcare (Piscataway, NJ). Non-radioactive ATP for the radiometric phosphorylation assay was purchased from Roche Applied Science (Indianapolis, IN). [γ-33P]-ATP was purchased from Amersham Bioscience (now part of GE Healthcare). EDTA was purchased from Fisher Scientific (Pittsburgh, PA) and Life Technologies Corporation (Carlsbad, CA). ADP-Glo Kinase Assay kit that contains ADP-Glo Reagent, Kinase Detection Reagent, ATP, and ADP was purchased from Promega (Madison, WI). Staurosporine was purchased from LC Laboratories (Woburn, MA). The dialysis buffer denotes 20 mM Hepes/KOH buffer pH 7.6 that contains 150 mM NaCl, 0.5 mM DTT, 0.01% Tween 20 (v/v), and 10% glycerol (v/v), and the kinase buffer denotes 50 mM Hepes/KOH buffer pH 7.6 that contains 20 mM MgCl2, 10 mM 2-ME, 2 mM sodium orthovanadate, and 10% glycerol (v/v).
Purification of the Cdc7-Dbf4 heterodimeric kinase
Sf9 cells in a 500 mL culture were co-infected with recombinant Baculovirus expressing both polyhistidine-tagged Cdc7 (His6-Cdc7) and polyhistidine- and FLAG-tagged Dbf4 (His6-FLAG2-Dbf4), each at a multiplicity of infection of 5. At 48 hr after infection, cells were pelleted, washed, and lysed in lysis buffer. After removal of insoluble material, the supernatant was incubated with Nickel agarose resin (Qiagen, Valencia, CA) in batch, and the Cdc7-Dbf4 heterodimer was eluted according to manufacturer’s protocol. Cdc7-Dbf4 heterodimer was further purified by anti-FLAG immunoprecipitation and peptide elution according to manufacturer’s protocol (Sigma-Aldrich Co.) and dialyzed against the dialysis buffer. The purified complex was then aliquoted and frozen under liquid nitrogen and stored at −80 °C until use.
Development of the Cdc7-Dbf4 Kinase Assay with the SPA Method
1 μL of 10% DMSO (v/v), 100 μM staurosporine in 10% DMSO (v/v), and 450 mM EDTA in 10% DMSO (v/v) were plated to a 384-well microtiter plate (Corning #3707: Corning, NY). Cdc7-Dbf4 heterodimer stock was freshly diluted in the kinase buffer to a concentration of 1 ng/μL, and 5 μL of the dilution was added the wells. After an incubation at room temperature for 10 min, 4 μL of 50 μM [γ-33P]-ATP (5 μCi/nmol) (pH 7) were added, and the plate was incubated for 2 hr at room temperature. 80 μL of 10 mg/mL suspension of HIS TAG PS Imaging beads in 50 mM Tris/HCl pH 7.6 buffer with 150 mM NaCl was dispensed, and the plate was sealed with a clear plastic adhesive seal and incubated for 1 hr. After a centrifugation at 3,000 rpm for 30 sec, the radiometric signal was detected with the LEADseeker™ Multimodality Imaging System (GE Healthcare).
The assay performance was assessed with three 384-well microtiter plates that contained 1% DMSO (v/v) for the high control (the “no inhibition” control) and three 384-well microtiter plates that contained 1% DMSO (v/v) and 45 mM EDTA for the low control (the “inhibition” control). 1 μL of 10% DMSO (v/v) were added to the no inhibition control plates, and 1 μL of 450 mM EDTA in 10% DMSO (v/v) were added to the inhibition control plates, with a custom designed 384 head on a PP-384-M Personal Pipettor (Apricot Designs, Monrovia, CA). After this step, the reaction and detection of radiometric signal were conducted as described in the previous paragraph, with an exception that a FlexDrop IV dispenser (PerkinElmer, Waltham, MA) was used for liquid dispensing.
Pilot Screen by the Cdc7-Dbf4 Kinase Assay with the SPA Method
A collection of 2,879 compounds that contains known drugs and bioactives26 was screened at concentration of 10 μM in 1% DMSO (v/v) in duplicate. 1 μL of 100 μM solution of each compound in 10% DMSO (v/v) were transferred to 384-well microtiter plates with the PP-384-M Personal Pipettor. 10% DMSO (v/v) was added to column 13 of each plate for the no inhibition control, and 450 mM EDTA in 10% DMSO (v/v) was added to column 14 of each plate for the inhibition control. The subsequent steps of Cdc7-Dbf4 kinase reaction and the detection of the radiometric signal as described above. The assay steps are summarized in Table 1.
Table 1.
Steps of the Cdc7-Dbf4 kinase assay with the SPA method.
| Step | Parameter | Value | Description |
|---|---|---|---|
| 1 | Library compounds | 1 μL | Final 10 μM in 1 % DMSO (v/v) |
| 2 | No inhibition control | 1 μL | Final 1 % DMSO (v/v) |
| 3 | Inhibition control | 1 μL | Final 45 mM EDTA in 1 % DMSO (v/v) |
| 4 | Enzyme | 5 μL | 5 ng Cdc7-Dbf4 heterodimer |
| 5 | Pre incubation | 10 min | Room temperature |
| 6 | ATP | 4 μL | Final 25 μM [γ-33P]-ATP, 5 μCi/nmol |
| 7 | Incubation | 2 hr | Room temperature |
| 8 | Imaging beads | 80 μL | HIS TAG PS Imaging beads |
| 9 | Incubation | 1 hr | Room temperature |
| 10 | Centrifugation | 30 sec | 3,000 rpm |
| 11 | Assay readout | Epi mirror: empty Emission mirror: empty |
LEADseeker multimodality imaging system |
| Step | Notes |
|---|---|
| 1 to 3 | Dispensing on the PP-384-M Personal Pipettor using a custom 384 head. |
| 4 | Dispensing with the FlexDrop IV. |
| 5 | Plates incubated at room temperature for 10 min. |
| 6 | Dispensing with the FlexDrop IV. |
| 7 | Plates incubated at room temperature for 2 hr. |
| 8 | Dispensing with the FlexDrop IV. |
| 9 | Plates incubated at room temperature for 1 hr. |
| 10 | Plates centrifuged at 3,000 rpm; 30 s. |
| 11 | Radiometric signal quantified with empty epi mirror and empty emission mirror. [14C]-plate as a reference. |
Evaluation of ADP Processing Step of the LUM Method
10 mM ADP solution and 10 mM ATP solution (pH 7) from ADP-Glo Kinase Assay kit (Promega, Madison, WI) were separately diluted to a concentration of 27 μM in the kinase buffer. From these dilutions, 12 mixtures of ADP and ATP with a total nucleotide concentration of 27 μM were prepared that had the following ADP concentration: 0, 0.27, 0.54, 1.08, 1.62, 2.16, 2.7, 5.4, 10.8, 16.2, 21.6, and 27 μM. 0.5 μL of 10% DMSO (v/v), 3 μL of the dialysis buffer, and 3 μL of each mixture were dispensed to a 384-well microtiter plate (Corning #3570). Total nucleotide concentration of these mixtures was 12.5 μM, and ADP concentrations were as follows: 0, 0.125, 0.25, 0.5, 0.75, 1, 1.25, 2.5, 5, 7.5, 10, and 12.5 μM. 6 μL of ADP-Glo Reagent from ADP-Glo Kinase Assay kit were added for ATP depletion, and the plate was incubated for 40 min at room temperature. 12 μL of Kinase Detection Reagent from ADP-Glo Kinase Assay kit were added for ATP regeneration and luciferase reaction, and the plate was incubated for 30 min at room temperature. The luminescence signal was detected with the LEADseeker.
Effects of EDTA on ADP processing were tested with a matrix of 7 ADP/ATP mixtures (0, 0.25, 0.5, 1, 1.5, 2, and 2.5 μM ADP with a total nucleotide concentration of 25 μM) and 6 EDTA dilutions (0, 10, 20, 40, 60 and 90 mM EDTA). 3 μL of each ADP/ATP mixture were dispensed in a 384-well microtiter plate, and 3 μL of the 6 EDTA dilutions in the dialysis buffer were added in matrix, resulting in 42 ADP/ATP/EDTA mixtures with a total nucleotide concentration of 12.5 μM that had 7 ADP concentrations (0, 0.125, 0.25, 0.5, 0.75, 1, and 1.25 μM) and 6 EDTA concentrations (0, 5, 10, 20, 30, and 45 mM). These mixtures were incubated for 40 min with 6 μL of ADP-Glo Reagent, and received 3 μL of the dialysis buffer and 15 μL of Kinase Detection Reagent. After an incubation of 30 min, the luminescence signal was detected with the LEADseeker.
Effects of EDTA on ATP regeneration and luciferase reaction were tested with the 7 ADP/ATP mixtures (0, 0.25, 0.5, 1, 1.5, 2, and 2.5 μM ADP with a total nucleotide concentration of 25 μM) and the 6 EDTA dilutions (0, 10, 20, 40, 60 and 90 mM EDTA) that are described in the previous paragraph. 3 μL of the 7 ADP/ATP mixtures and 3 μL of the dialysis buffer were dispensed in a 384-well microtiter plate. These mixtures were incubated with 6 μL of ADP-Glo Reagent, and received 3 μL of the 6 EDTA dilutions in matrix. The resulting 42 ADP/ATP/EDTA mixtures were incubated with 15 μL of Kinase Detection Reagent and the luminescence signal was detected with the LEADseeker.
Development of the Cdc7-Dbf4 Kinase Assay with the LUM Method
The assay performance was assessed with three 384-well microtiter plates for the high control (the “no inhibition” control) and three 384-well microtiter plates for the low control (the “no reaction” control). 0.5 μL of 10% DMSO (v/v) were added to the no inhibition control plates and the no reaction control plates with the PP-384-M Personal Pipettor. After this step, the FlexDrop IV dispenser was used for liquid dispensing. Cdc7-Dbf4 heterodimer stock was freshly diluted to a concentration of 1.7 ng/μL in the kinase buffer, and 3 μL of the dilution were dispensed to the no inhibition control plates. 3 μL of the dialysis buffer were dispensed to the no reaction control plates. After incubation at room temperature for 20 min, 3 μL of 27 μM ATP in the kinase buffer were dispensed, and the plates were incubated of 2 hr at room temperature. 6 μL of ADP-Glo Reagent were added for an incubation of 40 min at room temperature, and 12 μL of Kinase Detection Reagent were added for an incubation of 30 min at room temperature. The luminescence signal was detected with the LEADseeker.
Pilot Screen by the Cdc7-Dbf4 Kinase Assay with the LUM Method
A collection of 3,519 compounds for known drugs and bioactives (Prestwick Chemicals and MicroSource Discovery Systems, Inc.) was screened at 10 μM concentration in 1 % DMSO (v/v) in duplicate. This library contains 2,879 compounds tested in the previous screen with the SPA method. 0.5 μL of each compound solution in 10% DMSO (v/v) were transferred to 384-well microtiter plates with the PP-384-M Personal Pipettor. 10% DMSO (v/v) was added to column 13 and 14 of each plate. Cdc7-Dbf4 heterodimer stock was freshly diluted to a concentration of 1.7 ng/μL in the kinase buffer, and 3 μL of the dilution were dispensed to every well except for column 14 with the FlexDrop IV. 3 μL of the dialysis buffer were manually plated to the wells in column 14 with a multichannel pipettor. After incubation at room temperature for 20 min, 3 μL of 27 μM ATP in the kinase buffer were dispensed, and the reaction mixtures were incubated for 2 hr at room temperature. Incubation with ADP-Glo Reagent and Kinase Detection Reagent followed by detection of the luminescence signal are described in the previous section. The whole assay steps are summarized in Table 2.
Table 2.
Steps of the Cdc7-Dbf4 kinase assay with the LUM method.
| Step | Parameter | Value | Description |
|---|---|---|---|
| 1 | Library compounds | 0.5 μL | Final 10 μM in 1 % DMSO (v/v) |
| 2 | No inhibition control, no reaction control | 0.5 μL | Final 1 % DMSO (v/v) |
| 3 | Enzyme | 3 μL | 5 ng Cdc7-Dbf4 heterodimer in Dialysis buffer for the library compounds and no inhibition control |
| 4 | Dialysis buffer | 3 μL | Dialysis buffer for no reaction control |
| 5 | Pre incubation | 20 min | Room temperature |
| 6 | ATP | 3 μL | Final 12.5 μM ATP |
| 7 | Incubation | 2 hr | Room temperature |
| 8 | ATP depletion | 6 μL | ADP-Glo Reagent |
| 9 | Incubation | 40 min | Room temperature |
| 10 | ATP regeneration, Luciferase reaction | 12 μL | Kinase Detection Reagent |
| 11 | Incubation | 30 min | Room temperature |
| 12 | Assay readout | Epi mirror: empty Emission mirror: empty |
LEADseeker multimodality imaging system |
| Step | Notes |
|---|---|
| 1 and 2 | Dispensing on the PP-384-M Personal Pipettor using a custom 384 head. |
| 3 | Dispensing with the FlexDrop IV. |
| 4 | Dispensing manually. |
| 5 | Plates incubated at room temperature for 20 min. |
| 6 | Dispensing with the FlexDrop IV. |
| 7 | Plates incubated at room temperature for 2 hr. |
| 8 | Dispensing with the FlexDrop IV. |
| 9 | Plates incubated at room temperature for 40 min. |
| 10 | Dispensing with the FlexDrop IV. |
| 11 | Plates incubated at room temperature for 30 min. |
| 12 | Luminescence signal quantified with empty epi mirror and empty emission mirror. [14C]-plate as a reference. |
Dose-Response Study of the Primary Positives with the LUM Method
Three 12-point doubling dilutions of the compounds in 10% DMSO (v/v) were prepared in an intermediate 384-well microtiter plates with 1,000, 100, and 10 μM as the upper limit. 0.5 μL of each dilution were transferred to 384-well microtiter plates with the PP-384-M Personal Pipettor. Cdc7-Dbf4 heterodimer stock was freshly diluted to a concentration of 1.7 ng/μL in the kinase buffer, and 3 μL of the dilution were dispensed to the wells. After incubation at room temperature for 20 min, 3 μL of 27 μM ATP in the kinase buffer were dispensed, and the reaction mixtures were incubated for 2 hr at room temperature. The final concentrations of each compound were 12-point doubling dilutions in 1% DMSO (v/v) with 77, 7.7, and 0.8 μM as the highest concentration. Incubation with ADP-Glo Reagent and Kinase Detection Reagent followed by detection of the luminescence signal are described in the previous section. Dose response was assessed in duplicate, and the dose-response curve of the average was fitted by the logistic 4-parameter equation of SigmaPlot (Systat Software Inc., San Jose, CA). The IC50 value was used to represent the potency of each compound.
Dose-Response Study of the Primary Positives in the ADP Processing Step of the LUM Method
0.5 μL of the three 12-point doubling dilutions from the dose-response study in ADP production were transferred to 384-well microtiter plates with the PP-384-M Personal Pipettor. 3 μL of the dialysis buffer and 3 μl of the kinase buffer that contained 2.5 μM ADP and 22.5 μM ATP were added to the wells. Incubation with ADP-Glo Reagent and Kinase Detection Reagent followed by detection of the luminescence signal are described in the previous section. Dose response was assessed in triplicate, and the dose-response curve of the average was fitted by the logistic 4-parameter equation of SigmaPlot. The IC50 value was used to represent the potency of each compound.
Dose-Response Study of the Primary Positives in Luminescence Detection Step of the LUM Method
3 μl of the dialysis buffer and 3 μl of the kinase buffer that contained 2.5 μM ADP and 22.5 μM ATP were plated in 384-well microtiter plates. Incubation with ADP-Glo Reagent and Kinase Detection Reagent followed by detection of the luminescence signal are described in the previous section. Then 0.5 μL of the 3 12-point doubling dilutions from the dose-response study in ADP production were added, and the luminescence signal was detected again. Dose-response was assessed in triplicate, and the dose-response curve of the average was fitted by the logistic 4-parameter equation of SigmaPlot. The IC50 value was used to represent the potency of each compound.
Solubility of the Primary Positives
The solubility of each compound was determined by laser nephelometry27 with the 3 12-point doubling dilutions from the dose-response study in ADP production.
Statistical Analysis
The Z′ factor28 was used to assess assay performance. The Z′ factor constitutes a dimensionless parameter that ranges from 1 (infinite separation) to < 0. It is defined as: Z′ = 1−(3σc+ + 3σc−)/|μc+ − μc−| where σc+, σc−,μc+ andμc− are the standard deviations (σ) and averages (μ) of the high (c+) and low (c−) control. In the screen with the SPA method, the high control contained 1% DMSO (v/v) (the no inhibition control) and the low control contained 45 mM EDTA in 1% DMSO (v/v) (the inhibition control). In the screen with the LUM method, the high control contained 1% DMSO (v/v) (the no inhibition control) and the low control contained 1% DMSO (v/v) and the dialysis buffer with no Cdc7-Dbf4 heterodimer (the no reaction control).
Data Management
Data files from the LEADseeker were loaded into HTS Core’s Oncology Research Information System (ORIS) and powered by ChemAxon Cheminformatic tools (ChemAxon, Hungary).
RESULTS
Development of the Cdc7-Dbf4 Kinase Assay with the SPA Method
To screen human Cdc7-Dbf4 kinase inhibitors, we co-expressed polyhistidine-tagged Cdc7 (His6-Cdc7) and polyhistidine- and FLAG-tagged Dbf4 (His6-FLAG2-Dbf4) in Sf9 cells using the baculovirus expression system and purified the Cdc7-Dbf4 heterodimer with nickel-agarose and anti FLAG antibody. We developed Cdc7-Dbf4 kinase assay which directly measures auto-phosphorylation with [γ-33P]-ATP. After the phosphorylation was completed, a suspension of HIS TAG PS Imaging beads was dispensed to the reaction mixture. These imaging beads bind to the phosphorylated Cdc7-Dbf4 heterodimer at the polyhistidine tag and yield the light emission in the red region (about 615 nm) by capturing the emitted β particles of [33P]-phosphate, which was detected with the LEADseeker.
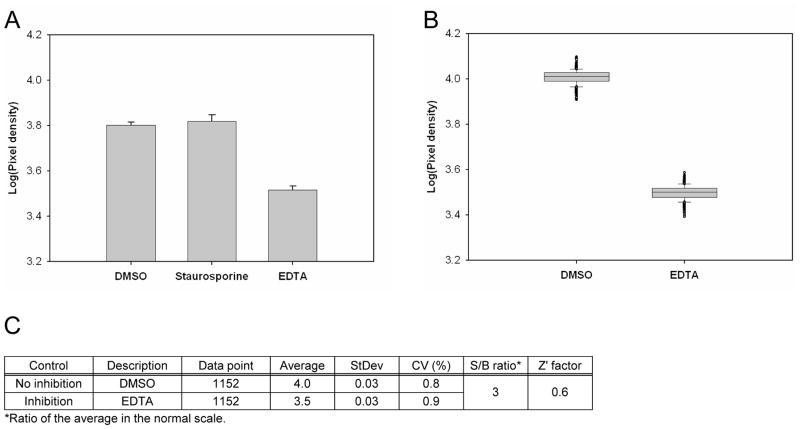
To select the low control (the “inhibition” control), we incubated 5 ng of Cdc7-Dbf4 heterodimer with 25 μM [γ-33P]-ATP (5 μCi/nmol) in a volume of 10 μL in the presence of 10 μM pan kinase inhibitor Staurosporine in 1% DMSO (v/v) or 45 mM EDTA in 1% DMSO (v/v), and calculated the signal-to-background ratio (S/B ratio) and the Z′ factor28 relative to the high control (the “no inhibition” control) that contained 1% DMSO (v/v). The volume of the control, Cdc7-Dbf4 heterodimer, and [γ-33P]-ATP was 1, 5, and 4 μL, respectively. After an incubation of 2 hr, we dispensed 80 μL suspension of the imaging beads to the reaction mixture and detected the radiometric signals after an incubation of 1 hr (Figure 1A). Only EDTA inhibited the Cdc7-Dbf4 kinase activity, with a S/B ratio of about 2 in the normal scale and a Z′ factor of about 0.6. We ran the assay in three 384-well microtiter plates that contained 1% DMSO (v/v) for the no inhibition control and three 384-well microtiter plates that contained 45 mM EDTA and 1% DMSO (v/v) for the inhibition control, and evaluated the assay performance by calculating percent coefficients of variation (%CV) and the Z′ factor. Figure 1B shows a box plot of the luminescence signal of 1,152 data points of the no inhibition control and the inhibition control. The assay had an averaged high signal of 4.0 pixel densities with the no inhibition control and an averaged low signal of 3.5 pixel densities with the inhibition control in logarithmic scale, and the S/B ratio was about 3 in the normal scale. The CV of the no inhibition control and the inhibition control was 0.8% and 0.9%, respectively, and the Z′ factor was 0.6 (Figure 1C). These statistics showed assay robustness, and the low %CV value gave us confidence to conduct a pilot screen in this assay format.
Figure 1. Pilot screen by the Cdc7-Dbf4 kinase assay with the SPA method.
(A). Control selection. 5 ng of Cdc7-Dbf4 heterodimer were incubated in a volume of 10 μL for 2 hr at room temperature with 25 μM [γ-33P]-ATP (5 μCi/nmol) in the presence of 1% DMSO (v/v), 10 μM Staurosporine in 1% DMSO (v/v), or 45 mM EDTA in 1% DMSO (v/v) in a 384-well microtiter plate. HIS TAG PS Imaging beads were dispensed, and the plate was sealed and incubated for 1 hr. After a centrifugation for 30 sec at 3,000 rpm, the radiometric signal was detected with the LEADseeker. The results are the average ± standard error (Avg ± SE) of 10 data points (n=10). (B). Control assessment. Three 384-well micro-titer plates contained 1% DMSO (v/v) as the “no inhibition” control and three 384-well micro-titer plates contained 45 mM EDTA in 1% DMSO (v/v) as the “inhibition” control. The radiometric signal of 1,152 data points is presented as a box plot. (C). Statistics of the no inhibition control and the inhibition control with 1,152 data points. (D). Pilot screen of a collection of 2,879 compounds. Screen was conducted in duplicate, with 18 assay plates. Chart of the Z′ factor of each assay plate is presented. The Z′ factor was calculated with the average and standard deviation of the radiometric signal of 16 wells of the no inhibition control and the inhibition control. The results of 9 assay plates of Set 1 (□) and 9 assay plates of Set 2 (■) are shown. Dotted line shows the average of the Z′ factor of the 18 assay plates (0.76). (E). Scatter plot analysis of the pilot screen data correlating the percent inhibition of the duplicate data. X- and Y-axis shows the percent inhibition of each compound in Set 1 and 2, respectively. Tannic acid and Gentian violet showed the inhibition of higher than 30% (dotted lines) in both data sets and were selected as positives (●).
Pilot Screen by the Cdc7-Dbf4 Kinase Assay with the SPA Method
We screened a collection of 2,879 compounds that contains known drugs and bioactives26 at 10 μM concentration in 1% DMSO (v/v) in duplicate. The assay protocols are summarized in Table 1. There were 16 wells of the no inhibition control and 16 wells of the inhibition control per plate which monitored assay performance during the screening on the basis of the Z′ factor for each plate. A total of 18 assay plates consistently showed a Z′ factor of between 0.6 and 0.8 (Figure 1D).
For each data set, we calculated the percentage of inhibition relative to the no inhibition control and the inhibition control, and plotted against each other to examine correlation (Figure 1E). We used an inhibition threshold of 30% to select positives, and found that Tannic acid and Gentian Violet showed greater than 30% inhibition in both data sets.
Development of the Cdc7-Dbf4 Kinase Assay with the LUM Method
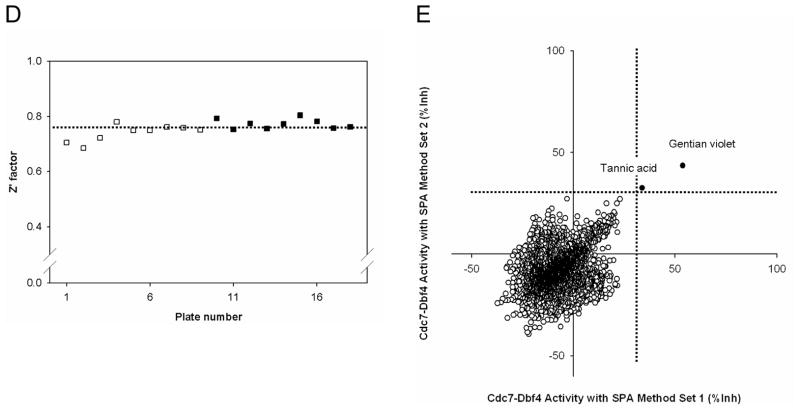
We developed the Cdc7-Dbf4 kinase assay with the LUM method to indirectly measure ADP production using ADP-Glo Kinase Assay kit.17 The scheme of this assay is depicted in Figure 2A. This assay consists of a two step process: ADP production and ADP processing. In ADP production, ATP is incubated with Cdc7-Dbf4 heterodimer (Cdc7-Dbf4 kinase reaction) and hydrolyzed to ADP and inorganic phosphate. ADP processing consists of ATP depletion, ATP regeneration, and luciferase reaction. The remaining ATP in the Cdc7-Dbf4 kinase reaction mixture is depleted by the incubation with ADP-Glo Reagent (ATP depletion). Then ADP is converted to ATP (ATP regeneration) and subsequently used in ATP-dependent monooxygenation of luciferin by luciferase (luciferase reaction). The resulting luminescence signal is proportional to ADP produced in the Cdc7-Dbf4 kinase reaction. ATP regeneration and luciferase reaction are conducted in one step by the incubation with Kinase Detection Reagent.
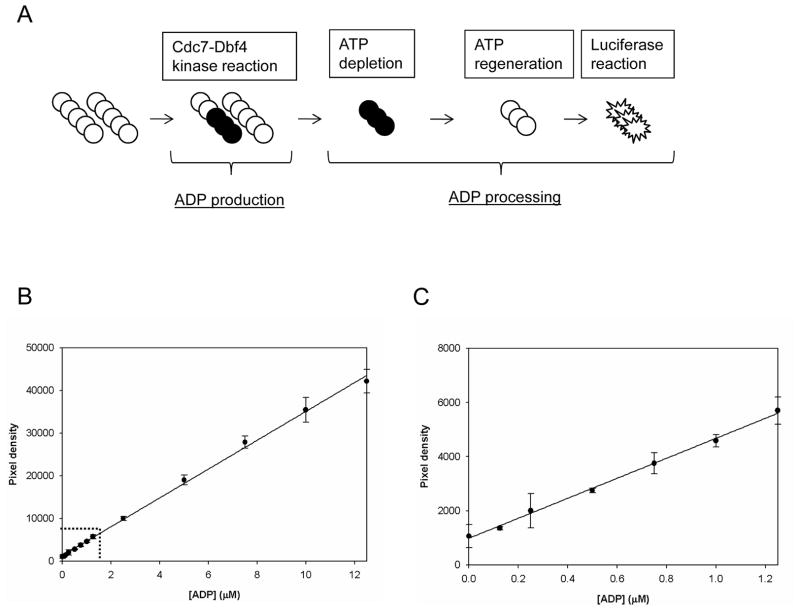
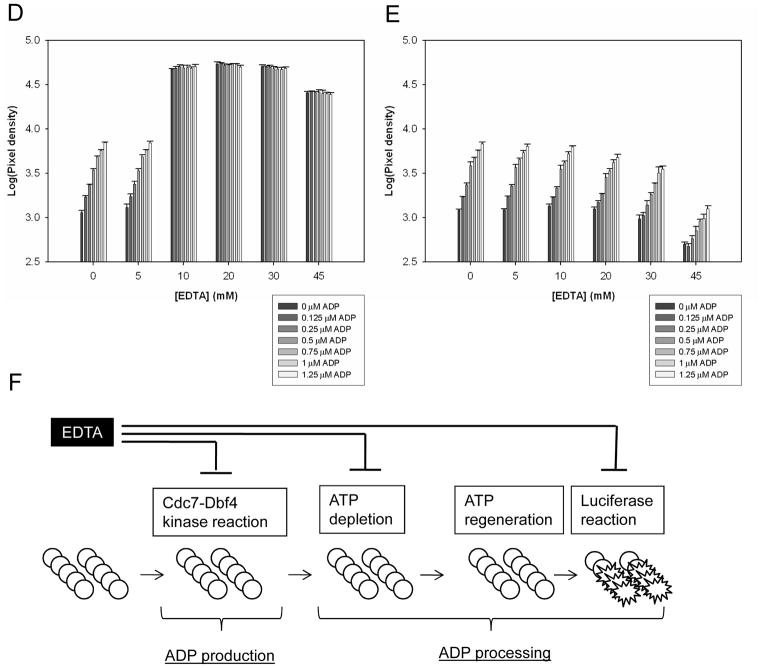
Figure 2. Evaluation of ADP processing step of the LUM method.
(A). Scheme of the LUM method to detect ADP produced in Cdc7-Dbf4 kinase reaction. This assay consists of a two step process: ADP production and ADP processing. In ADP production, ATP (○) is incubated with Cdc7-Dbf4 heterodimer (Cdc7-Dbf4 kinase reaction) and hydrolyzed to ADP (●) and inorganic phosphate (not shown). ADP processing consists of the following 3 steps: ATP depletion, the depletion of the remaining ATP; ATP regeneration, the conversion of the nascent ADP to ATP; luciferase reaction, ATP-dependent monooxygenation of luciferin by luciferase. ATP depletion is conducted by incubation with ADP-Glo Reagent, and ATP regeneration and luciferase reaction are conducted in a single step by incubation with Kinase Detection Reagent. The luminescence signal is proportional to ADP produced in the Cdc7-Dbf4 kinase reaction. (B). ADP standard curve. 12 mixtures of ADP and ATP with a total nucleotide concentration of 12.5 μM and ADP of the indicated concentration were prepared. Each mixture was incubated with ADP-Glo Reagent and Kinase Detection Reagent, and the luminescence signal was detected with the LEADseeker. The results are the Avg ± SE of 14 data points (n=14), and curve of the average was fitted by the single 3-parameter equation of SigmaPlot. (C). Magnified results in the range of 0–1.25 μM ADP indicated with dotted lines in Panel (B). (D). EDTA effects on ADP processing. 42 ADP/ATP/EDTA mixtures of a total nucleotide concentration of 12.5 μM with 7 ADP concentrations and 6 EDTA concentrations were dispensed in a volume of 6 μL in a 384-well micro-titer plate. After incubation with 6 μL of ADP-Glo Reagent, 3 μL of the dialysis buffer and 15 μL of Kinase Detection Reagent were dispensed, and after an incubation, the luminescence signal was detected with the LEADseeker. The results are the Avg ± SE of 4 data points (n=4). (E). EDTA effects on ATP regeneration and luciferase reaction. 6 μL of the 7 ADP/ATP mixtures with a total nucleotide concentration of 12.5 μM were incubated with 6 μL of ADP-Glo Reagent, and received 3 μL of the 6 EDTA dilutions of 0, 10, 20, 40, 60 and 90 mM in matrix. The mixtures were incubated with 15 μL of Kinase Detection Reagent for ATP regeneration and luciferase reaction and the luminescence signal was detected with the LEADseeker. The results are the Avg ± SE of 4 data points (n=4). Note that X-axis corresponds to the x-axis of the graph in panel (D) and does not show the final concentration in the reaction mixtures for ATP depletion and luciferase reaction. See Materials and Methods for details. (F). Scheme of the EDTA effects on ADP production and ADP processing. EDTA at 45 mM in the Cdc7-Dbf4 kinase reaction inhibits ADP production, ATP depletion, and luciferase reaction. See text for details.
The manufacturer recommends making volumetric ratio of kinase reaction mixture, ADP-Glo Reagent, and Kinase Detection Reagent 1:1:2. To save on reagents, we reduced the volume of the kinase reaction mixture from 10 μL in the assay with the SPA method to 6.5 μL by changing the volume of compound, Cdc7-Dbf4 heterodimer, ATP from 1, 5, and 4 μL to 0.5, 3, and 3 μL, respectively, and added 6 μL of ADP-Glo Reagent and 12 μL of Kinase Detection Reagent. The volumetric ratio of the kinase reaction mixture, ADP-Glo Reagent, and Kinase Detection Reagent was 6.5:6:12. Before measuring ADP production in the Cdc7-Dbf4 kinase reaction, we evaluated ADP processing of the LUM method which consists of ATP depletion, ATP regeneration, and luciferase reaction. We constructed an ADP standard curve with 12 mixtures of ADP and ATP with a total nucleotide concentration of 12.5 μM and ADP of 0, 0.125, 0.25, 0.5, 0.75, 1, 1.25, 2.5, 5, 7.5, 10, and 12.5 μM. We incubated these mixtures with ADP-Glo Reagent for ATP depletion and with Kinase Detection Reagent for ATP regeneration and luciferase reaction, and measured the luminescence signals with the LEADseeker (Figure 2B and C). The signal was proportional to the ADP concentration in the range of 0–1.25 μM, and the S/B ratio was about 3 at 1.25 μM ADP which corresponds to 10% conversion of ATP to ADP relative to 0 μM ADP (Figure 2C). This value is translated into the Z′ factor of higher than 0.5 in a screen. The signal at 0 μM ADP (0 μM ADP/12.5 μM ATP) was about 1,000 pixel densities (Figure 2C), and this background became lower than 300 pixel densities when we used the buffer that did not contain ATP (not shown). We speculated that this background was the signal of contaminated ADP in the ATP reagent in the ADP-Glo Kinase Assay kit.17
We observed that 45 mM EDTA inhibited the Cdc7-Dbf4 kinase activity in the SPA method (Figure 1A) and hence, used EDTA of this concentration as the inhibition control (Figure 1B). The manufacturer recommends maintaining the final magnesium ion concentration at least 0.5 mM in the LUM method. We tested the effects of EDTA on ADP processing by titrating EDTA concentration in a matrix with ADP/ATP mixtures under the Cdc7-Dbf4 kinase reaction conditions that contained 10 mM MgCl2. We plated 42 ADP/ATP/EDTA mixtures with a total nucleotide concentration of 12.5 μM and 7 ADP concentrations (0, 0.125, 0.25, 0.5, 0.75, 1, and 1.25 μM) and 6 EDTA concentrations (0, 5, 10, 20, 30 and 45 mM) in a 384-well microtiter plate, incubated these mixtures with ADP-Glo Reagent and Kinase Detection Reagent, and measured the luminescence signal (Figure 2D). With 5 mM EDTA, the signals were comparable to the data of 0 mM EDTA and proportional to the ADP concentration. At 10 mM of EDTA and higher concentration, the signals were about 10 times higher and lost correlation with the ADP concentration.
To dissect the effects of EDTA in ADP processing of the LUM method, we added the EDTA reagents to the ADP/ATP mixtures after ATP depletion. The LUM method uses luciferase from firefly Photuris pennsylvanica which requires magnesium ions.17 Unlike the results of the previous experiment in which the EDTA reagents were added before ATP depletion (Figure 2D), the luminescence signal predictably decreased with the addition of the EDTA reagents of the same volume after ATP depletion (Figure 2E), presumably because EDTA inhibited luciferase in Kinase Detection Reagent by chelating magnesium ion. We present a possible scenario of the addition of 45 mM EDTA to the Cdc7-Dbf4 kinase assay with the LUM method (Figure 2F). EDTA at 45 mM in Cdc7-Dbf4 kinase reaction inhibits ADP production, leaving ATP in the reaction mixture. In ADP processing, EDTA (diluted to be 22.5 mM with the addition of ADP-Glo Reagent) inhibits ATP depletion, leaving intact ATP. In the next step, EDTA (diluted to be 11.3 mM with the addition of Kinase Detection Reagent) inhibits luciferase reaction. Overall, the signal with 45 mM EDTA would be higher than 0 mM EDTA (the high control). We predicted these results by comparing the signals between 1.25 μM ADP of 0 mM EDTA and 0 μM ADP of 45 mM EDTA in Figure 2D, and decided to replace EDTA as the inhibition control with the dialysis buffer that did not contain Cdc7-Dbf4 heterodimer as the “no reaction” control.
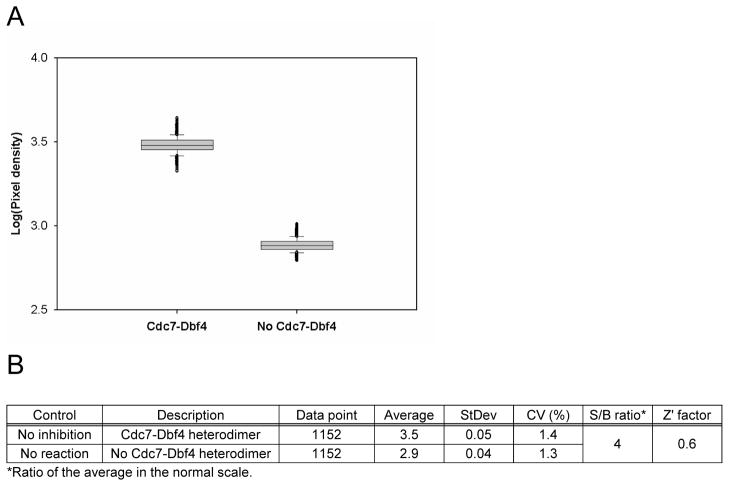
We evaluated the performance of the LUM method by conducting Cdc7-Dbf4 kinase reaction under the similar conditions in the assay with the SPA method for ATP concentration, buffer, and incubation time. We had three 384-well plates that contained 1% DMSO (v/v) as the no inhibition control and three 384-well plates that contained 1% DMSO (v/v) but no Cdc7-Dbf4 heterodimer as the no reaction control. Figure 3A shows a box plot of the luminescence signal of 1,152 data points of each control. The assay had an averaged high signal of 3.5 pixel densities with the no inhibition control and an averaged low signal of 2.9 pixel densities with the no reaction control in the logarithmic scale. The signal ratio of these controls in the normal scale was about 4. Data variability was low, with CVs of 1.4% and 1.3% for the no inhibition control and the no reaction control, respectively, and Z′ factor was 0.6 (Figure 3B). We concluded that the LUM method with the no reaction control showed comparable statistics with the SPA method with the inhibition control and was compatible for the pilot screen of the same compound colletion for the comparison.
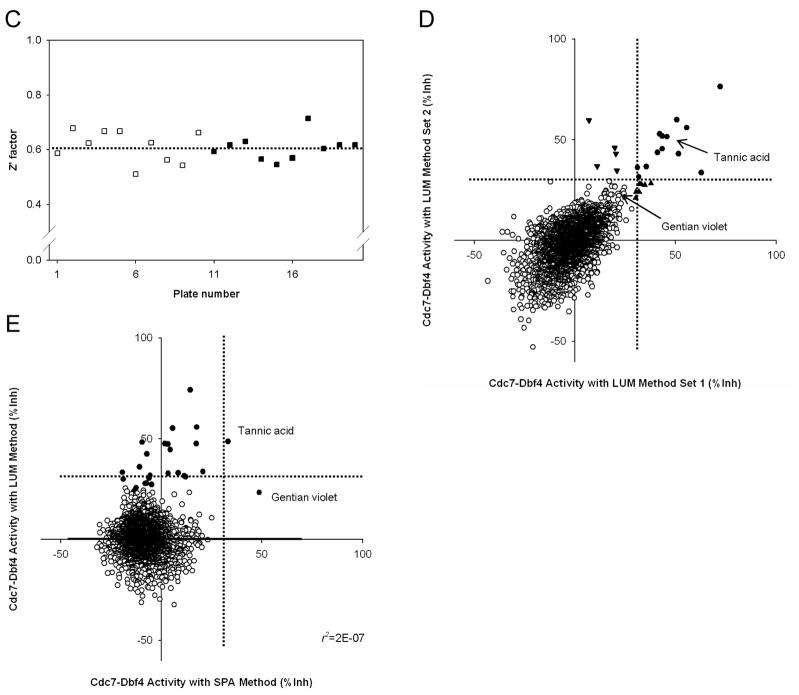
Figure 3. Pilot screen by Cdc7-Dbf4 kinase assay with the LUM method.
(A). Control assessment. Three 384-well plates contained 1% DMSO (v/v) and 5 ng Cdc7-Dbf4 heterodimer as the “no inhibition” control, and three 384-well plates contained 1% DMSO (v/v) and the dialysis buffer that did not contain Cdc7-Dbf4 heterodimer as the “no reaction” control. The luminescence signal of 1,152 data points is presented as a box plot. (B). Statistics of the no inhibition control and the no reaction control with 1,152 data points. (C). Pilot screen of a collection of 3,519 compounds. Screen was conducted in duplicate, with 20 assay plates. The Z′ factor of each assay plate is presented. The Z′ factor was calculated with the average and standard deviation of pixel density of the luminescence signal of 16 wells of the no inhibition control and the no reaction control. The results of 10 assay plates of Set 1 (□) and 10 assay plates of Set 2 (■) are shown. Dotted line shows the average of the Z′ factor of the 20 assay plates (0.61). (D). Scatter plot analysis of the pilot screen data correlating the percent inhibition of the duplicate data. X- and Y-axis shows the percent inhibition of each compound in Set 1 and 2, respectively. A total of 25 compounds that showed the percent inhibition of higher than 30% threshold (dotted lines) in either both Set 1 and Set 2 (●), in Set 1 (▲), or in Set 2 (▼) were selected as the positives. Tannic acid and Gentian violet, the two positives in the previous screen with the SPA method (Figure 1E), are indicated with arrows. Tannic acid showed 46% and 52% inhibition in Set 1 and Set 2, respectively. Gentian violet showed 23% inhibition in both sets. (E). Scatter plot of the averaged percent inhibition of 2,879 compounds between the SPA method and the LUM method. The average of the duplicate data in each method is shown. Black circles (●) indicate the 25 positives of the LUM method (Panel D) and the 2 positives of the SPA method, Tannic acid and Gentian violet (Figure 1D). Gentian violet was positive only in the SPA method, and Tannic acid was positive in both methods. Note that some of the positives in the LUM method showed higher than 30% inhibition in one of the two data sets (▲ and ▼ in Panel D) and the averages of some of such compounds are lower than 30%. There is no correlation between the 2 methods (r2=2E-7).
Pilot Screen by the Cdc7-Dbf4 Kinase Assay with the LUM Method
We screened a collection of 3,519 compounds that contained 2,879 compounds tested in the previous screen with the SPA method. The whole assay steps are summarized in Table 2. We tested these compounds at 10 μM in 1% DMSO (v/v) in duplicate, and monitored assay performance during the screening by the Z′ factor of each plate, using 16 wells of the no inhibition control and the no reaction control per plate. A total of 20 assay plates consistently showed a Z′ factor of higher than 0.5 (Figure 3C). These statistics were comparable to those obtained in the control run (Figure 3B) and showed assay robustness and consistency.
Figure 3D shows the plot of the percentage of inhibition relative to the no inhibition control and the no reaction control between Set 1 and 2. Some compounds inhibited Cdc7-Dbf4 kinase activity at percent inhibition of even higher than 50%. These results were in contrast to the previous screen with the SPA method, in which only Tannic acid and Gentian violet showed 30~50% inhibition (Tannic acid showed 34% and 33% inhibition in Set 1 and Set 2, respectively; and Gentian violet, 54% and 43% inhibition in Set 1 and Set 2, respectively (Figure 1E)). We arbitrarily chose the same threshold at 30% inhibition which we used in the previous screen, and identified 25 positives showing percent inhibition of higher than 30% in at least one data set (13 compounds in both sets, 7 compounds only in Set 1, 5 compounds only in Set 2: Figure 3D). The initial hit rate of this screen was 0.71%. Interestingly, between the 2 positives in the previous screen, only Tannic acid was positive with the LUM method (46% and 52% inhibition in Set 1 and Set 2, respectively), and Gentian acid was inactive in both data sets (23% inhibition in both sets).
To compare the SPA method and the LUM method against the same compounds, we calculated the average of the percent inhibition of two data sets of the collection of 2,879 compounds tested in both screens. Surprisingly, there was no correlation of these averages between these methods (Figure 3E). All of the positives in the LUM method (25 compounds which showed higher than 30% inhibition in at least one data set: Figure 3D) were also tested in the previous screen with the SPA method, and the average of the percent inhibition was lower than 30% for most of them (Figure 3E). The only exception was Tannic acid, which was positive in both methods (49% inhibition in the LUM method and 34 % inhibition in the SPA method). Gentian violet, another positive in the SPA method (49% inhibition), was inactive in the LUM method (23% inhibition). (Note: 12 positives in the LUM method were active only in one of the two data sets (Figure 3D) and the average of some of these compounds was lower than 30% (Figure 3E). But Gentian violet was inactive in both data sets (Figure 3D).) Overall, screening of the identical compound collection under the similar conditions identified 25 positives with the LUM method (the hit rate of 0.87%) and only 2 positives with the SPA method (the hit rate of 0.07%), with Tannic acid being common to both. The LUM method identified 24 positives which were missed with the SPA method. These results show that the LUM method has much higher sensitivity than the SPA method and the selection of this method gave a strong impact on hit identification.
Confirmatory Study of the Primary Positives
Among the 26 positives combined from the two screens (25 positives in the LUM method, 2 positives in the SPA method), 20 positives were resupplied (Table 3) for confirmatory study. These 20 positives were the collection of 19 positives in the LUM method and 2 positives in the SPA method (one overlap in both methods). Among the 19 positives in the LUM methods, 9 positives were positive in both sets and 10 positives were positives only in one set. We also included 12 known kinase inhibitors (Table 4), and studied dose response of these 32 compounds by the Cdc7-Dbf4 kinase assay with the LUM method. We prepared three 12-point doubling dilutions of each compound starting from 77, 7.7 and 0.8 μM as upper limits, and conducted the Cdc7-Dbf4 kinase assay to measure ADP production with the LUM method. Using the same compound dilutions, we also studied dose response in ADP processing and luminescence detection of the LUM method to identify false positives which inhibit these steps, not the Cdc7-Dbf4 kinase reaction. To study dose response in ADP processing, we added each compound dilution to an ADP/ATP mixture that contained 1.25 μM ADP and 11.25 μM ATP, incubated these mixtures with ADP-Glo Reagent and Kinase Detection Reagent for ADP processing, and measured the luminescence signal. To study dose response in luminescence detection, we incubated the same ADP/ATP mixture (without compounds) with ADP-Glo Reagent and Kinase Detection Reagent to complete ADP processing, and compared the luminescence signal before and after adding each compound dilution. We also checked the solubility of these compounds by laser nephelometry27 to rule out the possibility that the inhibition of the Cdc7-Dbf4 kinase activity by these compounds is due to a low solubility.29 We conducted dose response in ADP production in duplicate, and other studies in triplicate.
Table 3.
Dose response and solubility of the 20 active compounds in the primary screens.
| Structure | Name | ADP production IC50 (μM) | ADP processing IC50 (μM) | Luminescence detection IC50 (μM) | Solubility | Use/Therapy |
|---|---|---|---|---|---|---|

|
Iriginol hexaaceatate | 1.01±0.04 | N.E.1 | N.E. | Soluble | Semisynthetic compound. Has not been approved as a drug. |
|
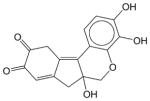
Hematein | 3.13±0.36 | N.E. | N.E. | Soluble | Anti-inflammatory and anti atherogenic effect in the rabbit model. Tested for the treatment of porphyria. Has not been approved as a drug. |

|
Caffeic acid | 6.19.±0.42 | N.E. | N.E. | Soluble | A natural dietary phenolic compound found in plants that is an anti-oxidant. Inhibits the synthesis of leukotrienes. Inhibits carcinogenesis. Has not been approved as a drug. |
|
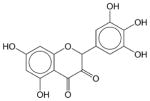
Myricetin | 12.04±2.55 | N.E. | N.E. | Soluble | A naturally occurring flavonol with antioxidant properties. Reduced the risk of pancreatic cancer. |

|
Ferulic acid | 13.19±3.90 | N.E. | N.E. | Soluble | Anti neoplastic, choleretic, food preservative. Tested for Alzheimer disease in Japan. Has not been approved as a drug. |

|
Quercetin | 59.71±28.56 | N.E. | N.E. | Soluble | Anti tumor agent; induces apoptosis and inhibits synthesis of heat shock proteins. Reduced the risk of pancreatic cancer. |
|
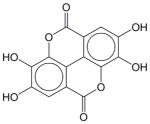
Ellagic acid | 0.77±0.06 | Inhibits ATP depletion at higher concentration | N.E.1 | Soluble | Hemostatic, anti neoplastic, anti mutagenic. Anti proliferative and anti oxidant properties in animal models. Has not been approved as a drug. |

|
Irigenol | 1.15±0.07 | Inhibits ATP depletion at higher concentration | N.E. | Soluble | Plant product. Has not been approved as a drug. |
|
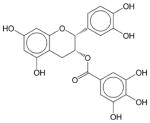
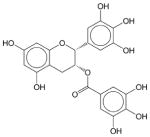
Epicatechin monogallate | 33.66±7.55 | Inhibits ATP depletion at higher concentration | N.E. | Soluble | Antioxidant polyphenol flavinoid. Inhibits Scrapie-associated prion formation. Has not been approved as a drug. |
|
Epigallocatechin-3-monogallate | 38.64±24.93 | Inhibits ATP depletion at higher concentration | N.E. | Soluble | Antioxidant polyphenol flavonoid that inhibits telomerase and DNA methyltransferase. Inhibits Scrapie-associated prion formation. Has not been approved as a drug. |
|
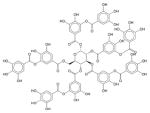
Tannic acid | 0.77±0.24 | Inhibits ATP depletion at higher concentration | N.E. | Soluble | Nonspecific enzyme/receptor blocker. A specific commercial form of tannin, a polyphenol that is commonly found in topical skin ointments. |
|
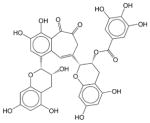
Theaflavin monogallates | 4.27±0.53 | Inhibits ATP depletion at higher concentration | N.E. | Soluble | Black tea polyphenol. Inhibits growth of cancer cells but not normal cells. Has not been approved as a drug.gua |
|
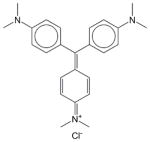
Gentian violet | 12.81±2.57 | 9.47±0.58 | 10.31±1.01 | Soluble | Anti bacterial, anthelmintic effect. Antiseptic to treat fungal infections of the skin. |

|
Pararosaniline pamoate | 14.94±4.66 | 9.04±0.82 | 11.64±1.89 | Soluble | Anthelmintic, anti schistosomal drug. |

|
Enalapril maleate | N.E.1 | N.E. | N.E. | Soluble | Angiotensin converting enzyme inhibitor. Anti hypertensive drug. |

|
Fisetin | N.E. | N.E. | N.E. | Soluble | Anti oxidant, anti inflammatory, and anti carcinogenic effect. Has not been approved as a drug. |
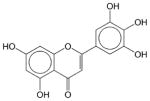
|
Hieracin | N.E. | N.E. | N.E. | Soluble | Known guaianolide. Has not been approved as a drug. |

|
Iodipamide | N.E. | N.E. | N.E. | Soluble | Radioopaque agent. Used for diagnosis tests for the biliary excretion. |

|
Purpurogallin | N.E.1 | N.E. | N.E. | Soluble | Plant phenol. Anti oxidant. Added to fats-oils, fuels, and lubricants as an oxidation retardant. |

|
Pyrogallin | N.E. | N.E. | N.E. | Soluble | Anti infectant. Has not been approved as a drug. |
N.E., no effect.
Table 4.
Dose-response and solubility of the 12 kinase inhibitors.
| Structure | Name | ADP production IC50 (μM) | ADP processing IC50 (μM) | Luminescence detection IC50 (μM) | Solubility | Use/Therapy |
|---|---|---|---|---|---|---|
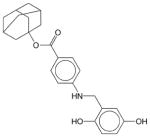
|
Adaphostin | N.E.1 | N.E. | N.E. | Soluble | BCR-ABL inhibitor; adamantyl ester of tyrphostin AG 957. Shows selective activity against chronic and acute myeloid leukemia. Has not been approved as a drug. |

|
Dasatinib | N.E. | N.E. | N.E. | Soluble | BCR-ABL inhibitor. A cancer drug Sprycel for use in patients with chronic myelogenous leukemia after imatinib treatment and Philadelphia chromosome-positive acute lymphoblastic leukemia. |

|
DMPQ | N.E. | N.E. | N.E. | Soluble | PDGFRβ inhibitor. Has not been approved as a drug. |

|
Erbstatin | N.E. | N.E. | N.E. | Soluble | EGFR inhibitor. Has not been approved as a drug. |

|
Erk inhibitor | N.E. | N.E. | N.E. | Soluble | Extracellular signal-regulated kinase inhibitor. Has not been approved as a drug. |

|
Gefitinib | N.E. | N.E. | N.E. | Soluble | EGFR inhibitor. A cancer drug Iressa for use in patients with non-small cell lung cancer with EGFR mutations in Europe, Asia, and Australia. |
|
|
Gleevec | N.E.1 | N.E. | N.E. | Soluble | BCR-ABL inhibitor. A cancer drug Imatinib for use in patients with chronic myelogeneous leukemia and gastrointestinal tumors. |
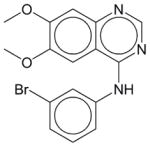
|
PD 153035 | N.E. | N.E. | N.E. | Soluble | EGFR inhibitor, with an IC50 of 25 pM. Inhibits other purified tyrosine kinases only at micromolar or higher concentrations. Has not been approved as a drug. |
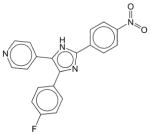
|
PD 169316 | N.E. | N.E. | N.E. | Soluble | A selective inhibitor of p38 MAPK; induces apoptosis of neuronal and non-neuronal cells deprived of specific trophic factors. Has not been approved as a drug. |

|
Phloretin | N.E. | N.E. | N.E. | Soluble | Inhibits glucose transmembrane transport and protein kinase C activity. Induces growth inhibition and apoptosis in human leukemia and colon cancer cells. Has not been approved as a drug. |
|
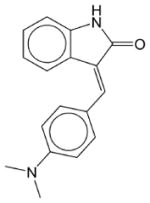
SU 4312 | N.E. | N.E. | N.E. | Soluble | VEGFR 1/2 and PDGFR inhibitor. Has not been approved as a drug. |
|
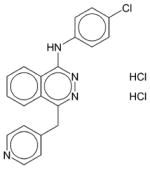
Vatalanib | N.E. | N.E. | N.E. | Soluble | VEGF inhibitor; PTK787. Inhibits angiogenesis. Phase III trials in people with metastatic colorectal cancer. Has not been approved as a drug. |
N.E., no effect.
Among the 20 positives which were resupplied and tested, 14 compounds (70%) exhibited dose response in ADP production at concentrations lower than 77 μM, with apparent IC50 values ranging from 0.6 to 60 μM (Table 3). In contrast, none of the 12 kinase inhibitors showed inhibition (Table 4). The negative results of these kinase inhibitors show the high purity of the Cdc7-Dbf4 heterodimer preparation.
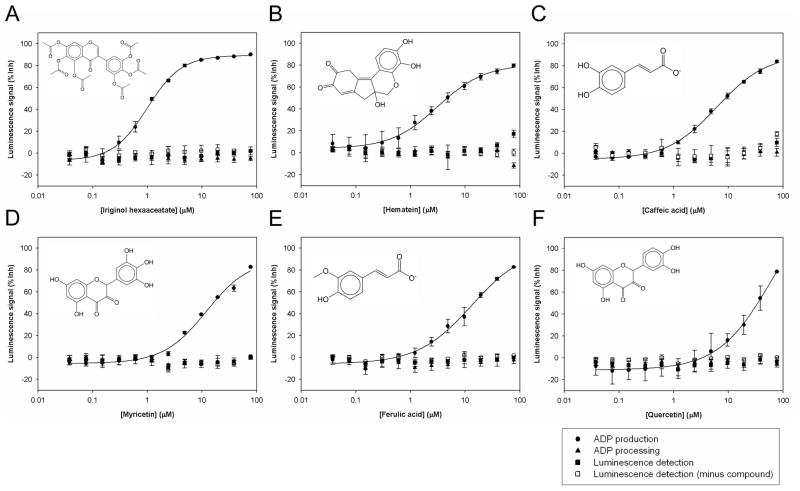
The laser nephelometry did not show any solubility limit lower than 77 μM of the 14 positives which inhibited ADP production with an IC50 of 0.6~60 μM. 6 compounds, Iriginol hexaaceatate, Hematein, Caffeic acid, Myricetin, Ferulic acid, and Quercetin, did not inhibit ADP processing or luminescence detection and were confirmed Cdc7-Dbf4 kinase inhibitors (Figure 4, Table 3).
Figure 4. Dose response of 6 confirmed Cdc7-Dbf4 kinase inhibitors.
The results of ADP production (●), ADP processing (▲), and luminescence detection (■) of the following 6 compounds in the LUM method are shown: (A). Iriginol hexaaceatate; (B). Hematein; (C). Caffeic acid; (D). Myricetin; (E). Ferulic acid; (F). Quercetin. The results of luminescence detection before each compound dilution was added are also shown (□). The results of ADP production are the Avg ± SE of 2 data points (n=2), and the results of ADP processing and luminescence detection are the Avg ± SE of 3 data points (n=3). Dose response curve of the average was fitted by the logistic 4-parameter equation of SigmaPlot. Solid lines show the curve fit of ADP production. The IC50 values of ADP production of each compound are as follows: (A). Iriginol hexaaceatate, 1.01±0.04 μM; (B). Hematein, 3.13±0.36 μM; (C). Caffeic acid, 6.19±0.42 μM; (D). Myricetin, 12.04±2.55 μM; (E). Ferulic acid, 13.19±3.90 μM; (F). Quercetin, 59.71±28.56 μM.
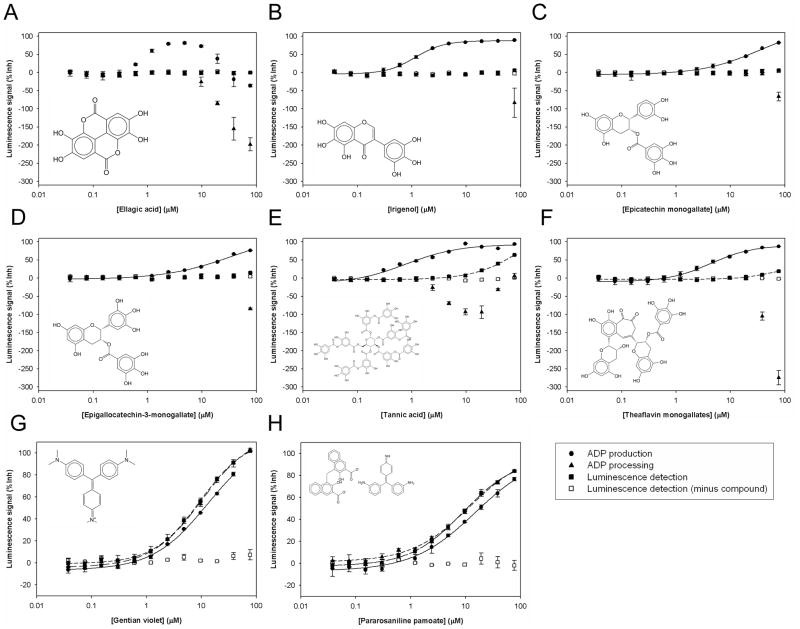
Other 6 compounds, Ellagic acid, Irigenol, Epicatechin monogallate, Epigallocatechin-3-monogallate, Tannic acid, and Theaflavin monogallates, inhibited ADP production with an IC50 of 1~40 μM. Interestingly, these compounds increased the luminescence signal of ADP processing at higher concentration than in the range of ADP production inhibition (Figure 5A–5F, Table 3). These results were similar to the data of EDTA addition (Figure 2D), which indicate that these primary positives also inhibit ATP depletion. Ellagic acid showed an IC50 of about 0.8 μM in ADP production at lower than 10 μM, but the inhibition of ATP depletion became dominant and masked the inhibition of ADP production at higher than 10 μM (Figure 5A). Tannic acid, which was the only overlap between the 2 assays, showed an IC50 of about 0.8 μM in ADP production (Figure 5E). This compound also inhibited ATP depletion at higher than 0.2 μM, and this inhibition started to decline at 10 μM, the concentration at which this compound inhibits luminescence detection. Because the concentration of these 6 compounds for the inhibition of ADP production was 10~102 times lower than the range for the inhibition of ATP depletion and luminescence detection, we categorized these compounds as Cdc7-Dbf4 kinase inhibitors.
Figure 5. Dose response of 6 confirmed Cdc7-Dbf4 kinase inhibitors that also inhibit ATP depletion and 2 false positives that inhibit luminescence detection.
The results of ADP production (●), ADP processing (▲), and luminescence detection (■) of the following 8 compounds in the LUM method are shown: (A). Ellagic acid; (B). Irigenol; (C). Epicatechin monogallate; (D). Epigallocatechin-3-monogallate; (E). Tannic acid; (F). Theaflavin monogallates. (G). Gentian violet; (H). Pararosaniline pamoate. The results of luminescence detection before each compound dilution was added are also shown (□). The results of ADP production are the Avg ± SE of 2 data points (n=2), and the results of ADP processing and luminescence detection are the Avg ± SE of 3 data points (n=3). Dose response curve of the average was fitted by the logistic 4-parameter equation of SigmaPlot. Solid line show the curve fit of ADP production. The IC50 values of ADP production of Ellagic acid, Irigenol, Epicatechin monogallate, Epigallocatechin-3-monogallate, Tannic acid, and Theaflavin monogallates are as follows: (A). Ellagic acid, 0.77±0.06 μM; (B). Irigenol, 1.15±0.07 μM; (C). Epicatechin monogallate, 33.66±7.55 μM; (D). Epigallocatechin-3-monogallate, 38.64±24.93 μM; (E). Tannic acid, 0.77±0.24 μM; (F). Theaflavin monogallates, 4.27±0.53 μM. The IC50 value of Ellagic acid is determined with the data of the concentration of lower than 10 μM. Short dash lines show the curve fit of luminescence detection of Tannic acid and Theaflavin monogallates. The IC50 values of luminescence detection of these compounds are greater than 77 μM. The IC50 values of ADP production, ADP processing, and luminescence detection of Gentian violet and Pararosaniline pamoate are as follows: (G). Gentian violet: 12.81±2.57 μM, 9.47±0.58 μM, 10.31±1.01 μM; (H). Pararosaniline pamoate: 14.94±4.66 μM, 9.04±0.82 μM, 11.64±1.89 μM.
Gentian violet, one of the 2 positives in the screen with the SPA method, and Pararosaniline pamoate inhibited luminescence detection in the same dose dependent fashion for the ADP production inhibition (Figure 5G and 5H, Table 3) and were categorized as false positive. The rest of the compounds did not reproduce their positive results in the primary screen with the LUM method (Table 3). Among the 19 positives with the LUM method, we confirmed 12 compounds as Cdc7-Dbf4 kinase inhibitors, with a confirmation rate of 63% (12/19). In the 9 LUM positives that were positive in both sets, we confirmed 6 compounds, with a confirmation rate of 67% (6/9). In the 10 LUM positives that were positive only in one set, we confirmed 6 compounds, with a confirmation rate of 60% (6/10).
DISCUSSION
Based on the kinase assay results from several comparative studies, serious doubts were raised over the supposition that identical hits should be identified independent of detection technology.19–21 The counter-argument, by contrast, contended that different assay technologies should lead to identical hits so long as high-quality experimental settings were ensured.23 Our results show that this is not always the case. In the SPA and LUM methods, we incubated Cdc7-Dbf4 kinase with ATP under the similar conditions for ATP concentration, buffer composition, and incubation time. Both methods showed high performance, with the Z′ factor of 0.7 (Figure 1D) and 0.6 (Figure 3C). Nonetheless, no data correlation was observed between the two methods (Figure 3E), suggesting that the choice of detection technology had an impact on hit identification. Even under the identical selection criteria of 30% in percent inhibition, the SPA method identified only two compounds while the LUM method identified 25 compounds (Figure 1E and Figure 3D). The two compounds identified in the SPA screen were Tannic acid and Gentian violet (Figure 1E), with only the former as an overlap with the LUM screen (Figure 3E). Tannic acid is known to be a non-specific inhibitor which is also active in other assays,26,27 and inhibits ATP depletion of the LUM method (Figure 5E). Gentian violet showed dose response in luminescence detection of the LUM method in the same fashion in ADP production (Figure 5G) and was judged as false positive. This result suggests the possibility that the result of this compound in the SPA method may also have been a false positive. Of the 25 positives from the LUM screen, we tested 19 positives and confirmed 12 positives. The overall confirmation rate was 63%. The confirmation rate was comparable between the 9 LUM positives that were positive in both sets (67%) and the 10 LUM positives that were positive only in one set (60%).
In contrast to the reported, comparable IC50 values obtained from equivalent luminescent and phosphorylation radiometric assays30 suggesting similarity in assay sensitivity, our results provided a different picture in that the former assay actually displayed a higher level of sensitivity than the latter one. One possible scenario that accounts for this discrepancy may stem from the difference in reaction conditions between the two assays. Specifically, ATP concentration was 103 times higher in the luminescence assay for ADP production (equivalent to our LUM method) than in the radiometric assay for phosphorylation (equivalent to our SPA method).30 In terms of signal detection mechanisms, the SPA method relies on direct measurement of phosphate incorporation into the substrate and is dependent upon the proximity between imaging beads and [33P]-phosphate incorporated into the Cdc7-Dbf4 kinase. The LUM method, by contrast, measures ADP production in a proximity independent manner. The very feature of the proportionality between the signal and the amount of ADP renders the signal being amplified into a wide spectrum of dynamic ranges, hence giving rise to the higher level of sensitivity of the LUM method compared to the SPA method.
Independency of the LUM method upon proximity may also be an advantage over non-radiometric based platforms such as DELFIA, TR-FRET, and AlphaScreen all of which depend on proximity. Another advantage of the LUM method is that it is equipped with a broader range of ATP concentration levels (up to 1 mM17) in comparison to radiometric and non-radiometric platforms. Even the ATP consumption assay platform using the same firefly luciferase16 requires high levels of enzyme concentration at high levels of ATP consumption for a robust assay window to detect decrease of the signal. In contrast, the LUM method detects the signal increase and therefore has big dynamic range at lower enzyme concentration and ATP conversion level. The luminescence-based assay in general is susceptible to false positive results produced by luciferase inhibitors which widely exist in the combinatorial library.18,31 The LUM method uses luciferase from firefly Photuris pennsylvanica which is less susceptible than a generic luciferese from firefly Photinus pyralis.18,31 The LUM method is also susceptible to false positives which inhibit luciferase detection and the components of ATP regeneration, and false negatives which inhibit ATP depletion. However, our study provides lines of supporting evidence that a methodically designed confirmation assay can eliminate such false results and identify the compounds with true activity against the target.
CONCLUSION
We report the comparison of performance between the SPA method and the LUM method in the pilot screen for Cdc7-Dbf4 kinase inhibitors. Our results show that the choice of detection can be a strong impact on hit identification even when the assay is conducted under high quality and similar conditions. Ideally, the assay development scientist should test a set of samples in several detection technologies under the identical reaction conditions and select the one that shows the highest assay quality. We also show the advantages of the LUM method against the SPA method with respect to high assay sensitivity and performance. Together with the recent report of miniaturization of this method in the 1536-well plate format,31 our report opens the door to an adaptation of this method to HTS of large chemical libraries.
Supplementary Material
Acknowledgments
The authors wish to thank the members of the HTS Core Facility for their help during the course of this study, especially Drs. Christophe Antczak and Nancy Liu-Sullivan for discussion. The HTS Core Facility is partially supported by Mr. William H. Goodwin and Mrs. Alice Goodwin and the Commonwealth Foundation for Cancer Research, the Experimental Therapeutics Center of the Memorial Sloan-Kettering Cancer Center, the William Randolph Hearst Fund in Experimental Therapeutics, the Lillian S. Wells Foundation, and by a NIH/NCI Cancer Center Support Grant 5 P30 CA008748-44. Work in the Frattini laboratory is supported by the Leukemia-lymphoma Society, the Geoffrey Beene Cancer Research Center, the Mr. William H. Goodwin and Mrs. Alice Goodwin and the Commonwealth Foundation for Cancer Research, and the Experimental Therapeutics Center of MSKCC.
ABBREVIATIONS
- SPA
scintillation proximity assay
- ELISA
enzyme-linked immunosorbent assay
- DELFIA
dissociation enhanced lanthanide fluorescence immunoassay
- TR-FRET
time-resolved fluorescence resonance energy transfer
- FP
fluorescence polarization
- LUM
luminescence detection of ADP production
- Avg
average
- SE
standard error
References
- 1.Hunter T. Signaling – 2000 and beyond. Cell. 2000;100:113–127. doi: 10.1016/s0092-8674(00)81688-8. [DOI] [PubMed] [Google Scholar]
- 2.Cohen P. Protein kinases--the major drug targets of the twenty-first century? Nat Rev Drug Discov. 2002;1:309–315. doi: 10.1038/nrd773. [DOI] [PubMed] [Google Scholar]
- 3.Eglen RM, Reisine T. The current status of drug discovery against the human kinome. Assay Drug Dev Technol. 2009;7:22–43. doi: 10.1089/adt.2008.164. [DOI] [PubMed] [Google Scholar]
- 4.Grant SK. Therapeutic protein kinase inhibitors. Cell Mol Life Sci. 2009;66:1163–1177. doi: 10.1007/s00018-008-8539-7. [DOI] [PMC free article] [PubMed] [Google Scholar]
- 5.Zhang J, Yang PL, Gray NS. Targeting cancer with small molecule kinase inhibitors. Nat Rev Cancer. 2009;9:28–39. doi: 10.1038/nrc2559. [DOI] [PubMed] [Google Scholar]
- 6.von Ahsen O, Bömer U. High-throughput screening for kinase inhibitors. Chembiochem. 2005;6:481–490. doi: 10.1002/cbic.200400211. [DOI] [PubMed] [Google Scholar]
- 7.Wesche H, Xiao SH, Young SW. High throughput screening for protein kinase inhibitors. Comb Chem High Throughput Screen. 2005;8:181–195. doi: 10.2174/1386207053258514. [DOI] [PubMed] [Google Scholar]
- 8.Park YW, Cummings RT, Wu L, Zheng S, Cameron PM, Woods A, Zaller DM, Marcy AI, Hermes JD. Homogeneous proximity tyrosine kinase assays. scintillation proximity assay versus homogeneous time-resolved fluorescence. Anal Biochem. 1999;269:94–104. doi: 10.1006/abio.1999.4029. [DOI] [PubMed] [Google Scholar]
- 9.Khawaja X, Dunlop J, Kowal D. Scintillation proximity assay in lead discovery. Expert Opin Drug Discov. 2008;3:1267–1280. doi: 10.1517/17460441.3.11.1267. [DOI] [PubMed] [Google Scholar]
- 10.DeForge LE, Cochran AG, Yeh SH, Robinson BS, Billeci KL, Wong WL. Substrate capacity considerations in developing kinase assays. Assay Drug Dev Technol. 2004;2:131–140. doi: 10.1089/154065804323056477. [DOI] [PubMed] [Google Scholar]
- 11.Beasley JR, McCoy PM, Walker TL, Dunn DA. Miniaturized, ultra-high throughput screening of tyrosine kinases using homogeneous, competitive fluorescence immunoassays. Assay Drug Dev Technol. 2004;2:141–151. doi: 10.1089/154065804323056486. [DOI] [PubMed] [Google Scholar]
- 12.Tanaka K, Koresawa M, Iida M, Fukasawa K, Stec E, Cassaday J, Chase P, Rickert K, Hodder P, Takagi T, Komatani H. Multiplexed random peptide library and phospho-specific antibodies facilitate human polo-like kinase 1 inhibitor screen. Assay Drug Dev Technol. 2010;8:47–62. doi: 10.1089/adt.2009.0212. [DOI] [PMC free article] [PubMed] [Google Scholar]
- 13.Sharlow ER, Leimgruber S, Yellow-Duke A, Barrett R, Wang QJ, Lazo JS. Development, validation and implementation of immobilized metal affinity for phosphochemicals (IMAP)-based high-throughput screening assays for low-molecular-weight compound libraries. Nat Protoc. 2008;3:1350–1363. doi: 10.1038/nprot.2008.111. [DOI] [PubMed] [Google Scholar]
- 14.Klumpp M, Boettcher A, Becker D, Meder G, Blank J, Leder L, Forstner M, Ottl J, Mayr LM. Readout technologies for highly miniaturized kinase assays applicable to high-throughput screening in a 1536-well format. J Biomol Screen. 2006;11:617–633. doi: 10.1177/1087057106288444. [DOI] [PubMed] [Google Scholar]
- 15.Veach DR, Namavari M, Beresten T, Balatoni J, Minchenko M, Djaballah H, Finn RD, Clarkson B, Gelovani JG, Bornmann WG, Larson SM. Synthesis and in vitro examination of [124I]-, [125I]- and [131I]-2-(4-iodophenylamino) pyrido[2,3-d]pyrimidin-7-one radiolabeled Abl kinase inhibitors. Nucl Med Biol. 2005;32:313–321. doi: 10.1016/j.nucmedbio.2005.01.008. [DOI] [PubMed] [Google Scholar]
- 16.Schröter T, Minond D, Weiser A, Dao C, Habel J, Spicer T, Chase P, Baillargeon P, Scampavia L, Schürer S, Chung C, Mader C, Southern M, Tsinoremas N, LoGrasso P, Hodder P. Comparison of miniaturized time-resolved fluorescence resonance energy transfer and enzyme-coupled luciferase high-throughput screening assays to discover inhibitors of Rho-kinase II (ROCK-II) J Biomol Screen. 2008;13:17–28. doi: 10.1177/1087057107310806. [DOI] [PubMed] [Google Scholar]
- 17.Zegzouti H, Zdanovskaia M, Hsiao K, Goueli SA. ADP-Glo. A Bioluminescence and homogeneous ADP monitoring assay for kinases. Assay Drug Dev Technol. 2009;7:560–572. doi: 10.1089/adt.2009.0222. [DOI] [PubMed] [Google Scholar]
- 18.Auld DS, Zhang YQ, Southall NT, Rai G, Landsman M, MacLure J, Langevin D, Thomas CJ, Austin CP, Inglese J. A basis for reduced chemical library inhibition of firefly luciferase obtained from directed evolution. J Med Chem. 2009;52:1450–1458. doi: 10.1021/jm8014525. [DOI] [PMC free article] [PubMed] [Google Scholar]
- 19.Sills MA, Weiss D, Pham Q, Schweitzer R, Wu X, Wu JJ. Comparison of assay technologies for a tyrosine kinase assay generates different results in high throughput screening. J Biomol Screen. 2002;7:191–214. doi: 10.1177/108705710200700304. [DOI] [PubMed] [Google Scholar]
- 20.Wu X, Glickman JF, Bowen BR, Sills MA. Comparison of assay technologies for a nuclear receptor assay screen reveals differences in the sets of identified functional antagonists. J Biomol Screen. 2003;8:381–392. doi: 10.1177/1087057103256466. [DOI] [PubMed] [Google Scholar]
- 21.Wu X, Sills MA, Zhang JH. Further comparison of primary hit identification by different assay technologies and effects of assay measurement variability. J Biomol Screen. 2005;10:581–589. doi: 10.1177/1087057105275628. [DOI] [PubMed] [Google Scholar]
- 22.Hubert CL, Sherling SE, Johnston PA, Stancato LF. Data concordance from a comparison between filter binding and fluorescence polarization assay formats for identification of ROCK-II inhibitors. J Biomol Screen. 2003;8:399–409. doi: 10.1177/1087057103255071. [DOI] [PubMed] [Google Scholar]
- 23.von Ahsen O, Schmidt A, Klotz M, Parczyk K. Assay concordance between SPA and TR- FRET in high-throughput screening. J Biomol Screen. 2006;11:606–616. doi: 10.1177/1087057106288183. [DOI] [PubMed] [Google Scholar]
- 24.Labib K. How do Cdc7 and cyclin-dependent kinases trigger the initiation of chromosome replication in eukaryotic cells? Genes Dev. 2010;24:1208–1219. doi: 10.1101/gad.1933010. [DOI] [PMC free article] [PubMed] [Google Scholar]
- 25.Montagnoli A, Moll J, Colotta F. Targeting cell division cycle dc7 kinase. a new approach for cancer therapy. Clin Cancer Res. 2010;16:4503–4508. doi: 10.1158/1078-0432.CCR-10-0185. [DOI] [PubMed] [Google Scholar]
- 26.Antczak C, Shum D, Radu C, Seshan VE, Djaballah H. Development and validation of a high-density fluorescence polarization-based assay for the trypanosoma RNA triphosphatase TbCet1. Comb Chem High Throughput Screen. 2009;12:258–268. doi: 10.2174/138620709787581729. [DOI] [PMC free article] [PubMed] [Google Scholar]
- 27.Antczak C, Shum D, Escobar S, Bassit B, Kim E, Seshan VE, Wu N, Yang G, Ouerfelli O, Li YM, Scheinberg DA, Djaballah H. High-throughput identification of inhibitors of human mitochondrial peptide deformylase. J Biomol Screen. 2007;12:521–535. doi: 10.1177/1087057107300463. [DOI] [PMC free article] [PubMed] [Google Scholar]
- 28.Zhang JH, Chung TD, Oldenburg KR. A simple statistical parameter for use in evaluation and validation of high-throughput screening assays. J Biomol Screen. 1999;4:67–73. doi: 10.1177/108705719900400206. [DOI] [PubMed] [Google Scholar]
- 29.Thorne N, Auld DS, Inglese J. Apparent activity in high-throughput screening. origins of compound-dependent assay interference. Curr Opin Chem Biol. 2010;14:315–324. doi: 10.1016/j.cbpa.2010.03.020. [DOI] [PMC free article] [PubMed] [Google Scholar]
- 30.Li H, Totoritis RD, Lor LA, Schwartz B, Caprioli P, Jurewicz AJ, Zhang G. Evaluation of an antibody-free ADP detection assay. ADP-Glo Assay Drug Dev Technol. 2009;7:598–605. doi: 10.1089/adt.2009.0221. [DOI] [PubMed] [Google Scholar]
- 31.Tanega C, Shen M, Mott BT, Thomas CJ, MacArthur R, Inglese J, Auld DS. Comparison of bioluminescent kinase assays by substrate depletion and product formation. Assay Drug Dev Technol. 2009;7:606–614. doi: 10.1089/adt.2009.0230. [DOI] [PMC free article] [PubMed] [Google Scholar]
Associated Data
This section collects any data citations, data availability statements, or supplementary materials included in this article.


