

Abstract
Macroscopic objects are usually manipulated by force and observed with light. On the nanoscale, however, this is often done oppositely: individual macromolecules are manipulated by light and monitored with force. This procedure, which is the basis of single-molecule force spectroscopy, has led to much of our quantitative understanding of how DNA works, and is now routinely applied to explore molecular structure and interactions, DNA–protein reactions and protein folding. Here we develop the technique further by introducing a dynamic force spectroscopy set-up for a non-invasive inspection of the tension dynamics in a taut strand of DNA. The internal contraction after a sudden release of the molecule is shown to give rise to a drastically enhanced viscous friction, as revealed by the slow relaxation of an attached colloidal tracer. Our systematic theory explains the data quantitatively and provides a powerful tool for the rational design of new dynamic force spectroscopy assays.
 Single-molecule force spectroscopy provides useful quantitative information about the properties of macromolecules. Otto and colleagues non-invasively inspect the tension dynamics in a taut strand of DNA, thereby extending the use of single-molecule force spectroscopy to the study of macromolecular dynamics.
Life literally is a tour de force. And much of the mechanical load exerted on tissues and cells is supported and transmitted by biomolecules that can be classified as semiflexible polymers1. Already at physiological force levels, semiflexible biopolymers exhibit non-Hookean stretching behaviour, which sets them apart from other nanoscopic force-bearing elements, such as AFM tips or optical tweezers. Their characteristic force–extension relation under static tension2,3,4 has become the workhorse of a whole industry of single-molecule force spectroscopy methods, employing the polymers as gauges, linkers5, molecular handles6, or as a virtual magnifying glass to explore the molecular world at ever higher spatial7,8 and temporal9 resolution. However, the mechanical nonlinearity substantially complicates the dynamic response to external perturbations. If you excite an overdamped linear spring, the excitation always decays exponentially and the spring attains its equilibrium state within a characteristic relaxation time. In contrast, polymeric response curves exhibit no well-defined relaxation timescale and their relaxation generally passes through a multitude of power-law regimes, subtly dependent on the details of the applied force protocol10,11. Mathematically speaking, the response is not governed by the relaxation of a single eigenmode (a single equivalent spring-dashpot element) but by a whole hierarchy of bending fluctuations of different wavelengths and their corresponding relaxation times. As demonstrated below, such complex mode superpositions can give rise to somewhat unintuitive and sometimes surprising dynamical effects.
A major source of complication in dynamics, compared with the better understood stationary situation, lies within the intricate coupling of the conformational dynamics of a stretched polymer to the solvent hydrodynamics. In its equilibrium conformation, as a coil of radius R, the polymer has a friction coefficient comparable to that of a colloidal bead of about the same radius. In contrast, if the polymer has a straight, rod-like conformation, it feels a friction force proportional to its contour length L>>R. For a λ-phage DNA, L/R≈20, which underscores how important the effect can become. The result of a more quantitative theoretical analysis for our specific experimental set-up is illustrated in Fig. 1. It shows that the friction coefficient of a DNA-coated colloidal bead (Fig. 1b) would increase by ≈30% if one of the molecules of its coating layer could be permanently transformed into a straight conformation of length L=16 μm (Fig. 1c). The purpose of the following discussion is to demonstrate both experimentally and theoretically that a much more dramatic, roughly fourfold, friction enhancement can be achieved if the initially stretched polymer is additionally allowed to recoil dynamically (Fig. 1d). At the origin of this observation lies an excess viscous friction that is self-generated by the internal conformational dynamics. To our knowledge, this is the first time this effect has been isolated experimentally, as earlier measurements were either limited to small fluctuations around the stretched state12 or suppressed the generation of excess friction through the attachment of large beads to the recoiling polymer end13,14,15. In the following, we elucidate the underlying physics of the enhanced friction and describe our dedicated set-up to measure it. We then present our measurement results and interpret them in the light of a systematic theory of nonequilibrium polymer dynamics16.
Figure 1. Relaxation times in a single-molecule force spectroscopy set-up sensitively depend on the molecular conformation.

(Illustration of the theoretical predictions for our experimental set-up with DNA length L=16 μm and persistence length  , and trap stiffness ktrap=0.023 pN nm−1). (a) Equilibrium random coil: hydrodynamic radius rH≈0.5 μm, friction coefficient γ≈6πηrH=8.4 pN ms μm−1, and relaxation time τ=γ/ktrap≈0.36 ms. (b) DNA-coated bead: γbead≈29 pN ms μm−1, τ≈1.3 ms (both values experimentally determined). (c) Rigid-rod scenario (DNA-coated bead with one DNA molecule straightened out):
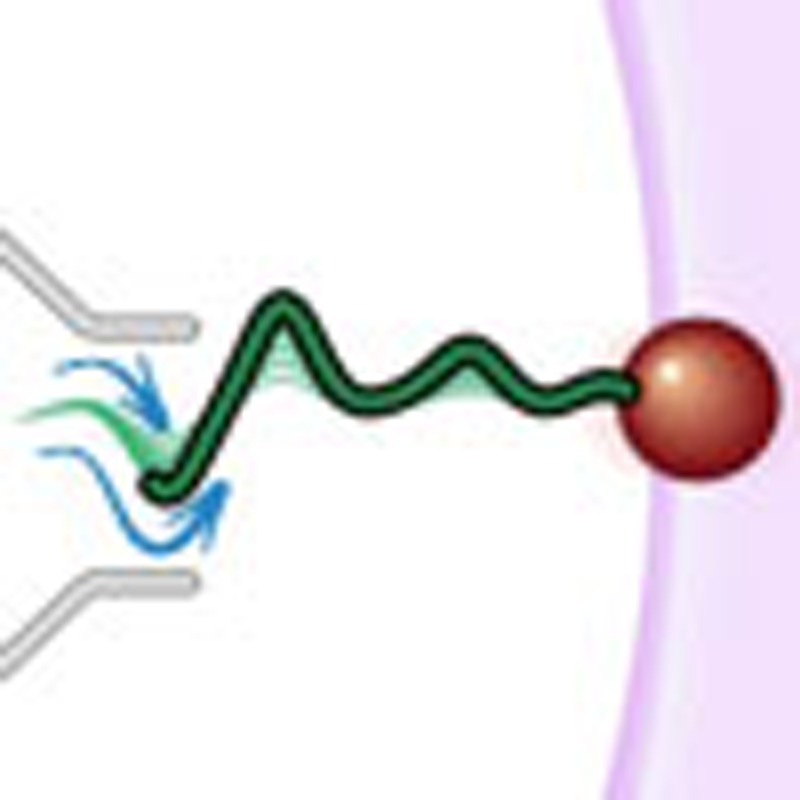
  pN ms μm−1, τ≈1.7 ms. (d) Stretch relaxation (DNA-coated bead with one initially stretched polymer that is freely retracting): γ≈39 pN ms μm−1, τ≈5 ms (determined via ftrap(τ)=ftrap(0)/e). (e) The recoiling of a polymer from a stretched initial state is entirely driven by entropic forces or ‘thermal noise’ (red arrows). The additional contour length required to create the wiggles in the contour has to be pulled in from the polymer ends. The concomitant solvent flow (blue) exerts counteractive longitudinal drag forces that limit the maximum retraction speed and ultimately lead to the excess friction seen in scenario (d).
In semiflexible polymer dynamics, hydrodynamic friction arises both due to the polymer’s transverse bending undulations and due to the contour’s longitudinal motion with respect to the background solvent. For a weakly bending (stretched) polymer, longitudinal fluctuations are geometrically strongly suppressed relative to transverse fluctuations. The linear dynamics of transverse bending modes therefore not only dominates moderate transverse contour excursions, but also slow longitudinal fluctuations—for example, the dynamic longitudinal mean-square displacement of a monomer at late times t→∞. But theory predicts that the short-time longitudinal dynamics, which becomes accessible by our dedicated experimental set-up, is strongly nonlinear and dominated by longitudinal drag. An example is provided by the initial stretching dynamics in response to a suddenly applied pulling force10,17,18,19.
But such a fast stretching is limited by longitudinal drag for a relatively short initial phase of inhomogeneous tension propagation only. Sizable longitudinal motion also occurs during the reverse process of contraction, when the pulled-out wrinkles autonomously recover to their equilibrium level after the external tension is suddenly released—that is, during the initial stage of ‘coiling up’20. This ‘release’ scenario, sketched in Fig. 1e, arguably allows for the best experimental control over the comparatively scarcely investigated longitudinal motion limited by longitudinal drag, as it gives rise to an extended phase of quasistatic homogeneous tension relaxation limited by longitudinal drag16,21. A first glimpse of this type of motion—a power-law growth of the retraction or ‘length deficit’ with t1/3—has already previously been caught22. But with our set-up, which enables us to directly monitor the decay of the backbone tension, we can for the first time inspect the underlying physical mechanism. As we demonstrate next, the recoiling, although it is solely driven by entropy, viz., by the thermal forces resulting from the random bombardement of the polymer backbone with solvent molecules, involves such high local retraction velocities as to create the massive excess friction alluded to above (Fig. 1d).
Results
Measurements
Our dedicated set-up to reversibly and non-invasively stretch and release a strand of λ-phage DNA is sketched in Fig. 2. A comprehensive description of the experimental procedures can be found in the Methods. Briefly, a calibrated optical trap embedded within a microfluidic cell serves to hold or relocate a single DNA-coated colloidal bead23. One of the grafted DNA molecules on the bead is pulled straight by applying an electrophoretic force with a nearby nanocapillary. After the electric field has abruptly been switched off at time t=0, a high-speed video camera tracks the bead displacement in the trap with submillisecond time resolution24. From the bead position, we infer the force ftrap(t) exerted by the trap onto the bead. Up to the relatively small bead friction (that is fully included in our theory), ftrap(t) is the value fP(L, t) of the backbone tension profile fP(s, t) at the grafted end s=L. Typical time traces of the force ftrap(t) exerted by the trap onto the bead are depicted in Fig. 3.
Figure 2. Sketch of the experimental set-up.

(a) One strand of DNA is stretched to about 90% longitudinal extension between the nanocapillary and the optical trap; tension is fully equilibrated, that is,  . (b) After turning off the external potential at time t=0, the polymer retracts and the tension decays, allowing the attached bead to slowly relax towards its equilibrium position under the influence of the linear trap force ftrap(t), the polymer backbone tension fP(L,t), and the (small) friction
  generated by the bead itself.
Figure 3. The time-dependent force ftrap(t) on the bead (deduced from the position of the bead in the tweezers).

Apart from the (small) friction force  onto the bead itself, ftrap(t) can be identified with the force fP(L,t) exerted by the stretched polymer onto the bead. Experimental data were obtained from 36 independent single-molecule measurements (moving average over 5 ms) at five different KCl concentrations c=20, 50 mM (a, 10 traces), c=100 mM (b, 10 traces), c=500 mM (c, 8 traces), c=750 mM (d, 8 traces). Theory curves: ftrap(t) including the dynamic backbone tension of the recoiling polymer and the bead drag (solid line), using a concentration-dependent persistence length of
  ,
,  ,
,  ,
,  ,
,  (33), and a friction coefficient per length
  ; for comparison, the prediction for the hypothetical rigid-rod scenario from Fig. 1c (dotted) is also shown. At low salt concentrations (a) the surface charge of the capillaries has a significant influence on the ionic current34 and the observed relaxation characteristics exhibit a larger variability. Alternative plots with theory curves for
  (independent of the salt concentration) are shown in Supplementary Fig. S1. A replication of the experiment using a different measurement protocol is documented in Supplementary Fig. S2.
Theory
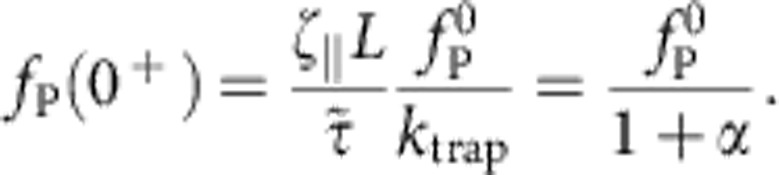
Our systematic theory is in good quantitative agreement with the data (Fig. 3, lines). Since the optically trapped bead moves by no more than ≈200 nm during the whole experiment, the bead-attached end can be thought fixed, thus closely approximating the “release” scenario described in refs. 16,25. Yet, taking also the slight bead motion into account, the theory allows us to reconstruct from ftrap(t) the complete spatio-temporal evolution of the tension profile fP(s, t), including the tension fP(L, t) at the grafted polymer end, (Fig. 4) and the local retraction velocity along the polymer backbone (Fig. 5). In the taut initial state, the tension  is constant throughout the polymer. Once the nanocapillary voltage has been switched off, the polymer end is force free, fP(0, t>0)=0. After a fast tension propagating period that cannot fully be resolved with our set-up, the backbone tension fP(s, t) approaches a characteristic invariant spatial shape
  , with slowly decaying amplitude (Fig. 4, see also the inset in Fig. 5 for a schematic illustration of the corresponding conformational dynamics). Notably, the force exerted by the polymer onto the trapped bead is predicted to be independent of the precise initial condition (and in particular of the precise value of the initial stretching force
  , in good accord with our data in Fig. 3). According to Newton’s third law the systematic variations in the backbone tension are balanced by the longitudinal viscous friction force acting along the polymer, from which the growth and decay of the retraction velocity along the polymer can be inferred10,11,16,25, as depicted in Fig. 5.
Figure 4. Evolution of the backbone tension along the polymer.

Numerical solutions of equation 4 for a set of three different initial conditions (corresponding to boundary layer widths of about 1, 2 and 4 μm coloured cyan, blue (dashed) and black (dotted), respectively) at various times t (in ms). The tension profiles quickly converge from their different initial states and settle onto a unique scaling function  with a slowly decaying amplitude, rendering the tension at the bead-laden end independent of the precise initial condition.
Figure 5. Retraction velocities along the polymer backbone at different times.

Theoretically reconstructed profiles v(s, t) of the local longitudinal contour velocity, based on the dynamic decay of the force ftrap(t) on the bead in Fig. 3. The computed velocity profile quickly settles down to an almost linear profile after the propagation layer has swept through the polymer (at t≈1 ms). Yet, substantial retraction velocities persist near the free end, and the resulting enhanced friction (Fig. 1c) considerably retards the decay of the backbone tension at the grafted end. Inset: qualitative sketch (not to scale) of the recoil process and the accompanying change in backbone tension (from top to bottom).
Discussion
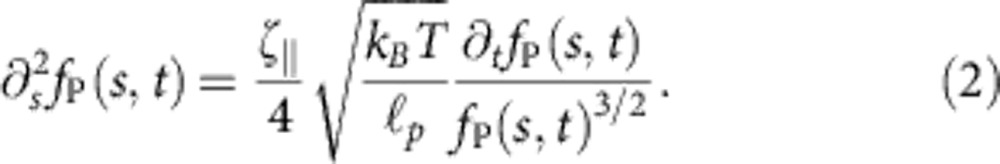
The exact mechanism giving rise to the observed slow relaxation behaviour is intuitively best understood as a dynamical equivalent of the static worm-like chain force–extension relation. On a scaling level, we balance the effective friction force  (2) that retards the retraction of the end-to-end distance z of the molecule by the entropic driving force
  that follows from the well-known Marko–Siggia expression for an almost straight conformation. Time integration then yields the aforementioned t1/3—growth of the deficit L−z and the asymptotic power-law decay
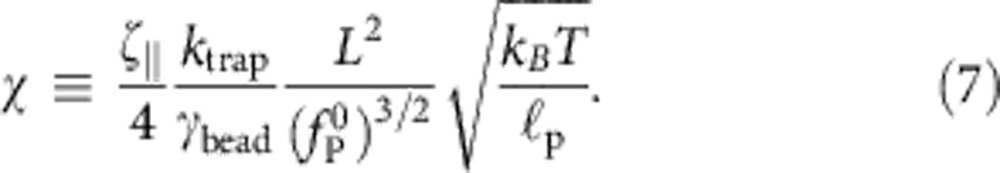
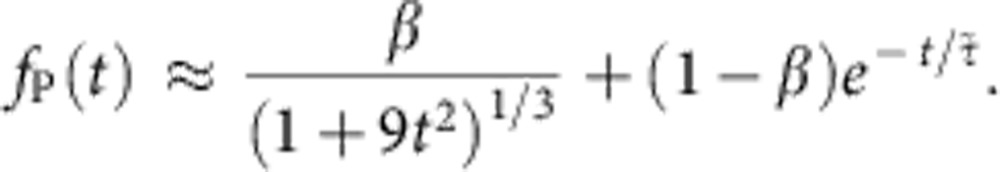
  of the tension25,26. By allowing both the tension and the contraction to vary along the backbone, the argument can be made rigorous to yield the correct partial differential equation governing the evolution of fP(s, t) (21,25). Further, including the optical trap and the bead friction, we obtain a slightly more complicated set of equations that can be solved numerically. To ease data analysis in future applications, we have extracted an approximate semi-empirical formula from this first-principles theory (the relevant equations of motion and the definitions of χ and α are given in the Methods section),
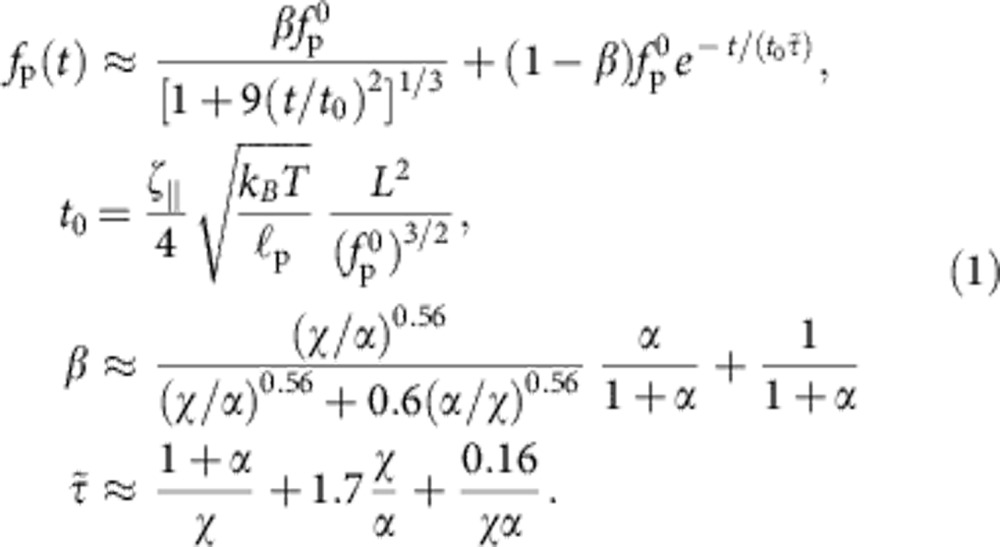 |
This formula was validated against the exact numerical solutions which it matches closely over a wide range of polymer lengths L, bead sizes γbead, trap stiffnesses ktrap, persistence lengths  and initial values of the tension
  . It interpolates between the purely exponential retraction obtained for negligible excess friction (as, for example, in the limit of a very short/stiff polymer) and the algebraic retraction fP(t)~t−2/3 that would result for a rigidly fixed polymer end25 (corresponding to the limit of a very stiff trap). Thereby, it provides a precise quantification of the friction enhancement anticipated in Fig. 1 and a very convenient starting point for further quantitative applications of our dynamic force spectroscopy set-up. Both dimensionless parameters χ and α are unambiguously defined in terms of experimental conditions (cf. Methods), thus leaving no free parameter save for the effective friction coefficient
  . The friction coefficient per length
  can be estimated asymptotically
  (for a stretched molecule of diameter a=2 nm (27)), and we have used this value for all of our theory curves. This renders the comparison between data and analytical theory in Fig. 3 parameter free.
In summary, combining experiment and theory, we have developed a quantitative dynamic force spectroscopy set-up. We demonstrated that the internal dynamics of a recoiling taut DNA molecule generates a large excess friction that drastically delays the relaxation of an attached tracer bead, as quantitatively predicted by a simple but precise analytical approximation to the systematic theory. The theory also enabled us to reconstruct the complete spatio-temporal evolution of both the backbone tension and the rebound velocity along the polymer, from records of the tracer relaxation. In the future, it might be interesting to use this quantitative set-up to reveal how the characteristic dynamics is modified by the presence of DNA–protein interactions, nicks or supercoils28.
Methods
Experimental
The microfluidic cell consists of polydimethylsiloxane (PDMS) and encompasses two 100 μl reservoirs connected by a nanocapillary, whose orifice size defines the active sensing volume for single-molecule studies. We use quartz glass capillaries (Hilgenberg, Germany) with an outer diameter of 0.5 mm and a wall thickness of 0.064 mm (20 mM) and 0.1 mm (50–750 mM), respectively. At the bottom the microfluidic cell is sealed with a glass cover slide of 100 μm (20 mM)/130−160 μm (50−750 mM) thickness. The electric potential is applied with the help of two Ag/AgCl electrodes, one of them residing within the nanocapillary, the other located in front of the capillary tip. We use a potassium chloride (KCl) solution at concentrations of 20, 50, 100, 500 and 750 mM in 10 mM Tris buffer at pH 8.
Our custom-built optical tweezers set-up is assembled on an optical table and uses a 5-W ytterbium fibre laser (YLM-5-LP, IPG Laser, Germany) at a wavelength of λ=1,064 nm (24). Whereas the optical trap itself is static, the microfluidic cell is mounted onto a xyz piezo nanopositioning system (P-517.3 and E-710.3, Physik Instrumente, Germany). With a range of 100 μm in xy- and 20 μm in z-direction it allows for nm-precise manoeuvring of entrapped beads in relation to the surrounding cell. Illumination of the region of interest inside the sample cell is either done using a standard white light source (DC-950 Fiber-Lite, Edmund Optics, USA), or an optical fibre (100 W mercury arc lamp, LOT-Oriel, UK and 600 μm multimode silica fibre, NA0.39, Thorlabs, UK). In combination with a high-speed CMOS camera (MC1362, Mikrotron, Germany) this modular approach allows for real-time tracking of optically trapped colloids at up to 10,000 fps (frames per second) with 2 nm spatial resolution24.
A Faraday cage encloses the sample cell. The externally applied electric potential is held constant by a commercial amplifier (Axopatch 200B, Axon Instruments, USA) in voltage-clamp mode. Its headstage is mounted inside the Faraday cage and connected to the Ag/AgCl electrodes of the microfluidic cell. Concurrent measurements of the ionic current through the nanocapillary29 allow the simultaneous trapping of multiple DNA strands to be ruled out.
Our DNA specimens are extracted from bacteriophage lambda (λ-DNA, New England Biolabs, United Kingdom). We attach biotinylated λ-DNA to 2.1 μm streptavidin functionalized polystyrene colloids (Kisker, Germany)30. With a binding constant of KA=4 × 10⁻¹⁴ mol the interaction between biotin and streptavidin is almost covalent and hence suitable for long-term experiments31.
Before each experiment we determine the nanocapillary tip diameter via its current–voltage characteristics23. Afterwards, λ-DNA-coated colloids are flushed into the microfluidic cell and the optical trap is calibrated by analysing its power spectral density24,32. The proper grafting of λ-DNA to our polystyrene colloids is verified by repeating the power spectrum calibration for a number of particles.
Tension dynamics
Apart from a short-lived initial regime (t~ns) that we cannot measure here, the relaxation behaviour of a freely contracting semiflexible polymer is governed by a generalization of the Marko–Siggia force–extension relation2 to space- and time-dependent backbone tension fP(s, t)
 |
For a freely relaxing chain, the above equation has been derived and solved systematically in the literature16,25. Within this theoretical framework, our stretching apparatus constitutes an initial condition fP(s, t=0), where the force gradient ∂sfP(s, t=0) is linearly proportional to the electric field and thus to the resistivity determined by the nanocapillary cross section,
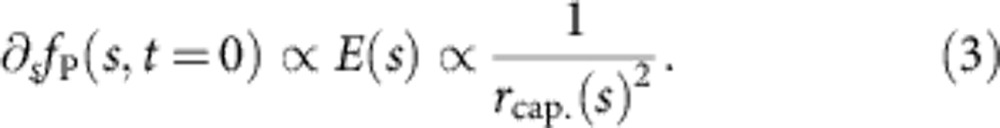 |
The fairly complex distribution of forces acting within the nanocapillary provides a good experimental approximation to a point force applied to the polymer end, as details of the initially applied tension profile  quickly diffuse away during tension propagation, see Fig. 4. Although in principle equation 2 breaks down close to the force-free end, and hydrodynamic interactions with the pore entrance or hydrodynamic boundary effects might locally increase the longitudinal friction coefficient
  , these finer points turn out to be negligible (Supplementary Notes 1 and 2, Supplementary Figs S3 and S4).
We now extend equation 2 to dynamic force spectroscopy assays by coupling one polymer end to a linear trap of stiffness kbead and drag coefficient γbead. Given a certain time-dependent bead velocity vbead(t) that must agree with the local polymer velocity  at the bead-laden end, the dynamic tension profile is then determined as follows,
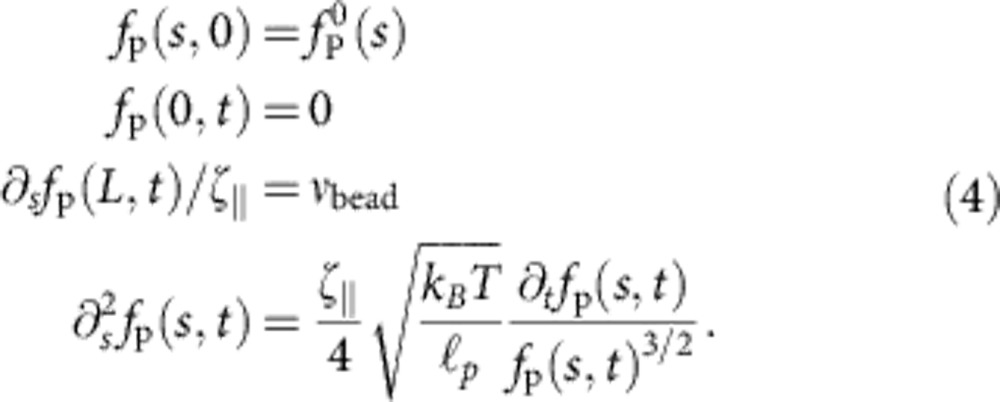 |
The bead velocity vbead is not an external parameter but depends on the polymeric force fP exerted on the bead. As bead and trap together constitute a linear overdamped subsystem with characteristic relaxation time ktrap/γbead, we can infer the bead velocity from the time-dependent polymer backbone tension evaluated at its bead-attached end fP(L, t),
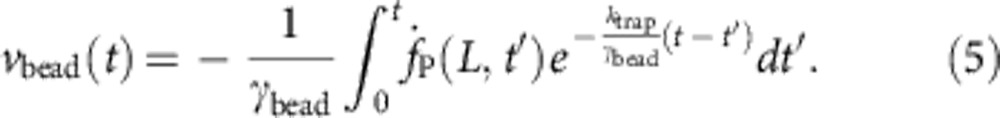 |
This closes equation 4, which we solve self-consistently by iterating in vbead(t) (Supplementary Methods).
To obtain a uniformly valid practical approximation to the resulting force relaxation fP(t):=fP(L, t), we first reexpress the above system of equations in dimensionless form by measuring fP in units of  , distance s in units of polymer length L and time t in units of
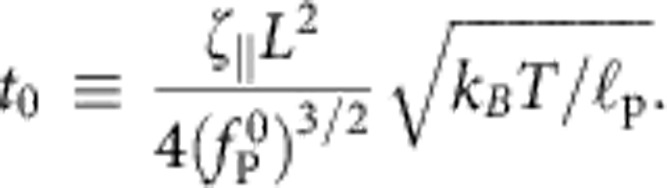 |
The equations of motion then read
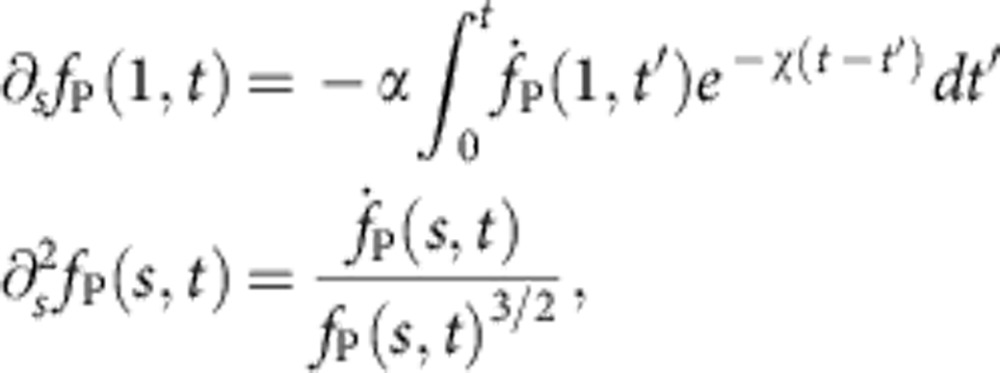 |
where
 |
denotes the ratio between ‘static’ polymer drag and bead drag and
 |
is a measure of trap stiffness. Although the above equations may be solved to high accuracy using very little numerical effort (see Supplementary Methods), one should not underestimate the advantages of having a ready-made analytical expression for practical experimental work at hand. For this reason, we have devised the semi-empirical formula equation 1 that closely matches the result of the numerical integration, even in the nonasymptotic regime of initial decay, characterized by  . We now sketch its derivation.
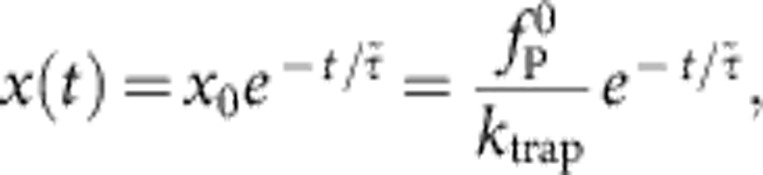
For ktrap∝χ→∞, the bead-attached polymer end would not move at all, thus rendering the polymer dynamically equivalent to one half of a freely retracting polymer of length 2L. It has been shown before25 that the latter scenario gives rise to a self-similar tension profile decaying like t−2/3 at large times; as we infer from our numerical data, a regularized variant fP(L, t)~(1+9t2)−1/3 provides a reasonable nonasymptotic fit at the cost of a mismatching prefactor at t→∞. The opposite limit χ→0 can be realized by γbead→∞ or L→0. In both cases, the relaxation is completely dominated by bead friction, thus yielding an exponentially relaxing force  with characteristic relaxation time
  which, in units of t0, reads
  . For general values of α and χ, we interpolate between both extremes using the superposition ansatz with a mixing parameter β,
 |
Next, we vary both χ and α on a logarithmic scale, solving for fP numerically and fitting the above ansatz to the obtained solutions on the interval between  and
and  .
.
To make sure we have covered all regions of interest, we verify that our data closely approaches the asymptotic solutions β(χ→∞)=1 (since χ→∞ can be realized by taking ktrap to infinity, leading back to the pure release scenario), β(α→0)=1 (directly follows from the dimensionless equations of motion) and β(χ→0)=1/(1+α). The latter asymptote corresponds to a virtually infinite persistence length  , such that the polymer retracts as a solid object of drag coefficient
  and producing purely exponential relaxation on a timescale
  as discussed above. In contrast, the timescale of internal contraction remains unchanged in units of t0 such that tension propagation amounts to a sudden drop from the initially applied force
  to some smaller force
  , which we identify with the force needed to drag along the polymer at an instantaneous speed
  . As
. As
 |
we have
 |
For large α, we do not have an analytic expression for finite χ. However, as for any finite χ, β must approach zero as α→∞, we know that all nontrivial values of β are realized for very large values of χ as α diverges. The boundary condition at the bead-attached end thus simplifies to
 |
We thus only need to make sure that our numerical data approaches a self-similar shape fP(χ, α)=fP(α/χ) in the limit of large α. Taking this into account, we arrive at the approximate expressions for β and  shown in equation 1. Figure 6 illustrates the quality of our empirical interpolation formula for nonasymptotic values of χ and α.
Figure 6. Analytical approximation versus exact numerical theory.

The dimensionless parameters α and χ denote polymer size and trap stiffness, respectively; see equations 6 and 7. All insets show the (reduced) time-dependent force  exerted by the polymer on the tracer bead over (reduced) time t/t0: numerical solution (solid lines), equation 1 (cyan dashed), pure release approximation neglecting the bead motion (blue). The analytical formula, equation 1, is generally accurate, with the exception of a narrow region χ>1, 1<α/χ<8, here delineated by the dashed white line, where the exact solution deviates by more than
  from the approximate result within the fitting interval.
Author contributions
U.K., O.O. and N.L. devised and carried out the measurements; O.O. and S.S. analysed the experimental data; S.S. and K.K. provided the theoretical description; K.K., U.K. and S.S. wrote the paper. O.O. and S.S. contributed equally to the study. ALL authors discussed the results and commented on the manuscript.
Additional information
How to cite this article: Otto, O. et al. Rapid internal contraction boosts DNA friction. Nat. Commun. 4:1780 doi: 10.1038/ncomms2790 (2013).
Supplementary Material
Supplementary Figures S1-S4, Supplementary Methods and Supplementary Notes 1-2
Acknowledgments
We thank Ralf Seidel for discussions, Benedikt Obermayer for providing us with a numerical solver for the full (non-quasistatic) theory of tension propagation and Lorenz Steinbock for the preparation of our glass nanocapillaries. S.S. acknowledges financial support from the Deutsche Forschungsgemeinschaft (DFG) through FOR 877, the European Social Fund and the Leipzig School of Natural Sciences—Building with Molecules and Nano-objects (BuildMoNa). O.O. is supported by a Ph.D. fellowship from the Boehringer Ingelheim Fonds. U.F.K. was supported through an Emmy Noether grant from the Deutsche Forschungsgemeinschaft and an ERC starting grant. N.L. acknowledges financial support from the George and Lillian Schiff Foundation and Trinity College, Cambridge.
References
- Kasza K. et al. The cell as a material. Curr. Opin. Cell Biol. 19, 101–107 (2007). [DOI] [PubMed] [Google Scholar]
- Marko J. F. & Siggia E. D. Stretching DNA. Macromolecules 28, 8759–8770 (1995). [Google Scholar]
- Bustamante C., Bryant Z. & Smith S. Ten years of tension: single-molecule DNA mechanics. Nature 421, 423–427 (2003). [DOI] [PubMed] [Google Scholar]
- Gebhardt J., Bornschlögl T. & Rief M. Full distance-resolved folding energy landscape of one single protein molecule. Proc. Natl Acad. Sci. 107, 2013–2018 (2010). [DOI] [PMC free article] [PubMed] [Google Scholar]
- Aubin-Tam M. et al. Adhesion through single peptide aptamers. J. Phys. Chem. A 115, 3657–3664 (2011). [DOI] [PMC free article] [PubMed] [Google Scholar]
- Koch S. & Wang M. Dynamic force spectroscopy of protein-DNA Interactions by unzipping DNA. Phys. Rev. Lett. 91, 028103 (2003). [DOI] [PubMed] [Google Scholar]
- Li H. et al. Reverse engineering of the giant muscle protein titin. Nature 418, 998–1002 (2002). [DOI] [PubMed] [Google Scholar]
- Grandbois M., Beyer M., Rief M., Clausen H. & Gaub H. How strong is a covalent bond? Science 283, 1727–1730 (1999). [DOI] [PubMed] [Google Scholar]
- Müller D. & Anderson K. Biomolecular imaging using atomic force microscopy. Trends Biotechnol. 20, S45–S49 (2002).12570160 [Google Scholar]
- Hallatschek O., Frey E. & Kroy K. Propagation and relaxation of tension in stiff polymers. Phys. Rev. Lett. 94, 077804 (2005). [DOI] [PubMed] [Google Scholar]
- Obermayer B., Möbius W., Hallatschek O., Frey E. & Kroy K. Freely relaxing polymers remember how they were straightened. Phys. Rev. E 79, 021804 (2009). [DOI] [PubMed] [Google Scholar]
- Meiners J. & Quake S. Femtonewton force spectroscopy of single extended DNA molecules. Phys. Rev. Lett. 84, 5014–5017 (2000). [DOI] [PubMed] [Google Scholar]
- Goshen E., Zhao W., Carmon G., Rosen S. & Feingold M. Relaxation dynamics of a single DNA molecule. Phys. Rev. E 71, 061920 (2005). [DOI] [PubMed] [Google Scholar]
- Bohbot-Raviv Y., Zhao W., Feingold M., Wiggins C. & Granek R. Relaxation Dynamics of semiflexible polymers. Phys. Rev. Lett. 92, 098101 (2004). [DOI] [PubMed] [Google Scholar]
- Crut A., Koster D. A., Seidel R., Wiggins C. H. & Dekker N. H. Fast dynamics of supercoiled DNA revealed by single-molecule experiments. Proc. Natl Acad. Sci. 104, 11957–11962 (2007). [DOI] [PMC free article] [PubMed] [Google Scholar]
- Hallatschek O., Frey E. & Kroy K. Tension dynamics in semiflexible polymers. I. Coarse-grained equations of motion. Phys. Rev. E 75, 031905 (2007). [DOI] [PubMed] [Google Scholar]
- Seifert U., Wintz W. & Nelson P. Straightening of thermal fluctuations in semiflexible polymers by applied tension. Phys. Rev. Lett. 77, 5389–5392 (1996). [DOI] [PubMed] [Google Scholar]
- Ajdari A., Jülicher F. & Maggs A. Pulling on a filament. J. Phys. I France 7, 823–826 (1997). [Google Scholar]
- Everaers R., Jülicher F., Ajdari A. & Maggs A. Dynamic fluctuations of semiflexible filaments. Phys. Rev. Lett. 82, 3717–3720 (1999). [Google Scholar]
- Turner S., Cabodi M. & Craighead H. Confinement-induced entropic recoil of single DNA molecules in a nanofluidic structure. Phys. Rev. Lett. 88, 128103 (2002). [DOI] [PubMed] [Google Scholar]
- Brochard-Wyart F., Buguin A. & de Gennes P. Dynamics of taut DNA chains. Europhys. Lett. 47, 171–174 (1999). [Google Scholar]
- Schroeder C., Shaqfeh E. & Chu S. Effect of hydrodynamic interactions on DNA dynamics in extensional flow: simulation and single molecule experiment. Macromolecules 37, 9242–9256 (2004). [Google Scholar]
- Steinbock L., Otto O., Chimerel C., Gornall J. & Keyser U. Detecting DNA folding with nanocapillaries. Nano Lett. 10, 2493–2497 (2010). [DOI] [PubMed] [Google Scholar]
- Otto O. et al. Real-time particle tracking at 10,000 fps using optical fiber illumination. Opt. Express 18, 22722–22733 (2010). [DOI] [PubMed] [Google Scholar]
- Hallatschek O., Frey E. & Kroy K. Tension dynamics in semiflexible polymers. II. Scaling solutions and applications. Phys. Rev. E 75, 031906 (2007). [DOI] [PubMed] [Google Scholar]
- Shaqfeh E., McKinley G., Woo N., Nguyen D. & Sridhar T. On the polymer entropic force singularity and its relation to extensional stress relaxation and filament recoil. J. Rheol. 48, 209–221 (2004). [Google Scholar]
- Batchelor G. K. Slender-body theory for particles of arbitrary cross-section in Stokes flow. J. Fluid Mech. 44, 419–440 (1970). [Google Scholar]
- van Loenhout M. T. J. et al. Dynamics of DNA supercoils. Science 338, 94–97 (2012). [DOI] [PubMed] [Google Scholar]
- Otto O., Steinbock L., Wong D., Gornall J. & Keyser U. Direct force and ionic-current measurements on DNA in a nanocapillary. Rev. Sci. Instrum. 82, 086102 (2011). [DOI] [PubMed] [Google Scholar]
- Steinbock L. et al. Probing DNA with micro- and nanocapillaries and optical tweezers. J. Phys. Condens. Matter 22, 454113 (2010). [DOI] [PubMed] [Google Scholar]
- Holmberg A. et al. The biotin-streptavidin interaction can be reversibly broken using water at elevated temperatures. Electrophoresis 26, 501–510 (2005). [DOI] [PubMed] [Google Scholar]
- Berg-Sø rensen K. & Flyvbjerg H. Power spectrum analysis for optical tweezers. Rev. Sci. Instrum. 75, 594–612 (2004). [DOI] [PubMed] [Google Scholar]
- Manning G. S. The persistence length of DNA is reached from the persistence length of its null isomer through an internal electrostatic stretching force. Biophys. J. 91, 3607–3616 (2006). [DOI] [PMC free article] [PubMed] [Google Scholar]
- Smeets R. M. M., Keyser U. F., Krapf D., Wu M. Y., Nynke H. & Dekker C. Salt dependence of ion transport and DNA translocation through solid-state nanopores. Nano Lett. 6, 89–95 (2006). [DOI] [PubMed] [Google Scholar]
Associated Data
This section collects any data citations, data availability statements, or supplementary materials included in this article.
Supplementary Materials
Supplementary Figures S1-S4, Supplementary Methods and Supplementary Notes 1-2