Abstract
We examined the effects of anthocyanidins (cyanidin, delphinidin, malvidin, peonidin, petunidin, pelargonidin) on the aryl hydrocarbon receptor (AhR) – CYP1A1 signaling pathway in human hepatocytes, hepatic HepG2 and intestinal LS174T cancer cells. AhR-dependent reporter gene expression in transfected HepG2 cells was increased by pelargonidin in a concentration-dependent manner at 24 h. Similarly, pelargonidin induced the expression of CYP1A1 mRNA up to 5-fold in HepG2 and LS174T cells relative to the induction by 5 nM 2,3,7,8-tetrachlorodibenzodioxin (TCDD), the most potent activator of AhR. CYP1A1 and CYP1A2 mRNAs were also increased by pelargonidin in three primary human hepatocytes cultures (approx. 5% of TCDD potency) and the increase in CYP1A1 protein in HepG2 and LS174T cells was comparable to the increase in catalytic activity of CYP1A1 enzyme. Ligand binding analysis demonstrated that pelargonidin was a weak ligand of AhR.
Enzyme kinetic analyses using human liver microsomes revealed inhibition of CYP1A1 activity by delphinidin (IC50 78 µM) and pelargonidin (IC50 33 µM).
Overall, although most anthocyanidins had no effects on AhR-CYP1A1 signaling, pelargonidin can bind to and activate the AhR and AhR-dependent gene expression, and pelargonidin and delphinidin inhibit the CYP1A1 catalytic activity.
Keywords: aryl hydrocarbon receptor, cytochrome P450, anthocyanidins, pelargonidin, food-drug interactions
1. INTRODUCTION
Anthocyanidins and anthocyanins are naturally occurring flavonoid compounds that are responsible for typical color (bluish-red, orange-red, orange) and biological effects of many fruits, berries and vegetables. Anthocyanidins are aglycon (sugar-free) backbones of anthocyanins, which are conjugated with various sugars, such as xylose, arabinose, glucose, galactose and rhamnose in the latter compounds (Welch et al. 2008). The most commonly occurring anthocyanidins in higher plants are pelargonidin, peonidin, cyanidin, malvidin, petunidin and delphinidin (Kong et al. 2003). Anthocyanidins are liberated from anthocyanins in the gastrointestinal tract mainly due to action of the intestinal microflora (Keppler and Humpf 2005). Although the bioavailability of anthocyanins and anthocyanidins is generally low, they can be absorbed in the gastrointestinal tract and have been detected in human plasma (McGhie and Walton 2007). Anthocyanins and anthocyanidins possess antioxidant, antitumor and antimutagenic properties in vivo (Kong et al. 2003). The aglycones generated from the most abundant anthocyanins have been shown to inhibit the growth of human stomach, colon, lung, breast and CNS cancer cells (Zhang et al. 2005). Both the human intestine and liver are organs rich in drug-metabolizing enzymes, which interact with drugs and food constituents. Among the drug-metabolizing enzymes, cytochromes P450 (CYPs) are the most important and most generally distributed enzymes responsible for more than two thirds of metabolic processes with known mechanisms (Pavek and Dvorak 2008). Cytochromes P450 1A, namely, CYP1A2 (present mainly in the liver) and CYP1A1 (mostly extrahepatic, but present in the liver after induction) are the evolutionary oldest and best-studied forms of this enzyme and they are known for their roles in activation of carcinogens (e.g. polycyclic aromatic hydrocarbons and heterocyclic amines), and in the metabolism of drugs (e.g. tricyclic antidepressants and theophylline) (Anzenbacher and Anzenbacherova 2001; Monostory et al. 2009). Both CYP1A1 and CYP1A2 are transcriptionally regulated by the aryl hydrocarbon receptor (AhR), and they are inducible by a variety of xenobiotic AhR ligands, including drugs (e.g. omeprazole), natural compounds (e.g. berberine), synthetic chemicals (e.g. specific inhibitor of c-jun-N-terminal kinase SP600125) and environmental pollutants (e.g. polyhalogenated biphenyls, polycyclic aromatic hydrocarbons, dioxins) (Denison and Nagy 2003; Stejskalova et al. 2011).
Besides its role in CYP1A genes induction, the AhR plays many physiological functions and it is involved in chemically-induced carcinogenesis (Abel and Haarmann-Stemmann 2010). Therefore, it is of topical interest to identify chemicals that affect the AhR-CYP1A signaling pathway and resulting enzymatic activities, with regard to putative food-drug interactions and effects on human health. Anthocyanins are contained in common food, beverages and dietary supplements. Structurally, they are considered as polyphenolic compounds together with flavonoids, flavones and isoflavones. While the effects of flavonoids, flavones and isoflavones on AhR-CYP1A have been broadly studied (Amakura et al. 2008; Hodek et al. 2002), there are no reports of interactions between anthocyanins and the AhR-CYP1A signaling pathway. In the present paper, we have examined the effects of the anthocyanidins cyanidin, delphinidin, malvidin, peonidin, petunidin and pelargonidin, on the aryl hydrocarbon receptor (AhR) – CYP1A1 signaling pathway in primary human hepatocytes and, in human hepatic HepG2 and intestinal LS174T cancer cell lines. We found that pelargonidin activates the AhR and induces CYP1A genes by a ligand-dependent mechanism, and that pelargonidin and delphinidin can inhibit CYP1A1 catalytic activity. The other anthocyanidins did not affect AhR-CYP1A1 signaling.
2. MATERIALS AND METHODS
2.1. Compounds and reagents
Dimethylsulfoxide (DMSO), resveratrol and hygromycin B were purchased from Sigma-Aldrich (Prague, Czech Republic). The anthocyanidins, cyanidin chloride (ref.#0909S; purity ≥96%), delphinidin chloride (ref.#0904S; purity ≥97%), malvidin chloride (ref.#0913S; purity ≥97%), peonidin chloride (ref.#0906S; purity ≥97%), petunidin chloride (ref.#0942S; purity ≥95%) and pelargonidin chloride (ref.#0912S; purity ≥97%) were purchased from Extrasynthese (Lyon, France). Luciferase lysis buffer and P450-Glo CYP1A1 assay were from Promega (www.promega.com; Hercules, CA). 2,3,7,8-Tetrachlorodibenzo-p-dioxin (TCDD) was from Ultra Scientific (RI, USA). Oligonucleotide primers used in RT-PCR reactions were from Invitrogen. LightCycler FastStart DNA MasterPLUS SYBR Green I was from Roche Diagnostic Corporation (Intes Bohemia, Czech Republic). All other chemicals were of the highest quality commercially available.
2.2. Human hepatocytes
Human hepatocytes were obtained from two sources: (i) human liver obtained from multiorgan donors LH44 (F, 57 years) and LH45 (M, 46 years); tissue acquisition protocol was in accordance with the requirements issued by local ethical commission in the Czech Republic; (ii) Long-term human hepatocytes in monolayer Batch HEP220670 (F, 64 years) (Biopredic International, Rennes, France). Hepatocytes were treated in a serum-free medium for 24 h or 48 h with the tested compounds, TCDD (5 nM) and/or vehicle (DMSO; 0.1% v/v). Cultures were maintained at 37°C and 5% CO2 in a humidified incubator.
2.3. Cancer cell lines
Human Caucasian hepatocellular carcinoma cells HepG2 (ECACC No. 85011430) and human Caucasian colon adenocarcinoma cells LS174T (ECACC No. 87060401) were purchased from ECACC and were cultured as recommended by manufacturer. Cells were maintained at 37°C and 5% CO2 in a humidified incubator.
2.4. Gene reporter assay
Experiments were performed in a stably transfected gene reporter cell line AZ-AHR, which was derived from HepG2 cells transfected with a construct containing several AhR binding sites upstream of a luciferase reporter gene (Novotna et al. 2011). Following plating, cells were stabilized for 16 h and then incubated for 24 h with tested compounds, TCDD (5 nM), resveratrol and/or vehicle (DMSO; 0.1% v/v). After the treatments, cells were lysed using Reporter Lysis Buffer (Promega, Madison, WI, USA) according to manufacturers´ instructions, and luciferase activity was measured.
2.5. Quantitative reverse transcriptase polymerase chain reaction (qRT-PCR)
Total RNA was isolated using TRI Reagent® and cDNA was synthesized according to the common protocol, using M-MLV Reverse Transcriptase F-572 (Finnzymes) and random hexamers 3801 (Takara). qRT-PCR was carried out on Light Cycler apparatus 480 II (Roche Diagnostic Corporation, Prague, Czech Republic). The levels of CYP1A1, CYP1A2 and GAPDH mRNAs were determined as described elsewhere (Dvorak et al. 2008). The measurements were performed in triplicates. Gene expression levels were normalized to glyceraldehyde-3-phosphate dehydrogenase (GAPDH), a housekeeping gene. Data were processed by delta-delta method.
2.6. Protein detection and Western blotting
Total protein extracts were prepared as described elsewhere (Pavek et al. 2007). Following SDS-PAGE separation and Western-blot transfer, blots were probed with antibody against CYP1A1 (goat polyclonal; sc-1616), purchased from Santa Cruz Biotechnology (Santa Cruz, USA). Chemiluminescent detection was performed using horseradish peroxidase-conjugated secondary antibody and an Amersham (GE Healthcare) ECL kit.
2.7. 7-Ethoxyresorufin-O-deethylase (EROD) activity of CYP1A1/2 in cell cultures
HepG2 cells and/or LS174T cells were seeded in 96-well plates at a density of 2.4×10⁴cells/cm2 in DMEM supplemented with 10% FCS and stabilized for 24 h. Cells were then incubated for 48 h with test compounds, TCDD (5 nM) and/or vehicle (DMSO; 0.1% v/v). The 7-ethoxyresorufin-O-deethylase (EROD) activity in cell cultures was measured as described elsewhere (Donato et al. 1993). Briefly, monolayers were washed with PBS and the serum-free medium containing 8 µM 7-ethoxyresorufin and 10 µM dicumarol was applied to cells. Following 30 min of incubation at 37°C, an aliquot of 75 µL of the medium was mixed with 125 µL of methanol and fluorescence was measured in a 96-well plate with 530 nm excitation and 590 nm emission filters. The data were expressed as the ratio of treated over control values (DMSO-treated cells).
2.8. Enzyme activity of CYP1A1 and CYP1A2 in human liver microsomes
Pooled human liver microsomes were obtained from Biopredic (Rennes, France) in accordance with ethical regulations of the country of origin (France). They were from twenty-six donors (twenty males and six females) with a protein content of 25 mg/ml; the CYP1A1/2, CYP2A6, CYP2B6, CYP2C9, CYP2C19, CYP2E1 and CYP3A4/5 enzyme activities were verified before the experiment.
Activity of CYP1A1/2 was measured either as EROD (see above) with 7-ethoxyresorufin as substrate according to established method (Leclercq et al. 1996) or by a luciferase based assay with CYP1A1 specific substrate Luciferin-CEE (www.promega.com, Promega, Hercules, CA). Amount of product of the reaction was determined by HPLC (Shimadzu Class VP, Tokyo, Japan) with fluorescence detection or by measuring the luminescence using Infinite M200 spectrophotometer/spectrofluorometer/luminometer (TECAN Austria, Vienna). Anthocyanidins were dissolved in aqueous solution of pH 3.5 to concentration of 1 mM. Incubation mixture contained 100 mM potassium phosphate buffer (pH 7.4), NADPH-generating system (0.8 mM NADP+, 5.8 mM isocitrate, 0.3 unit/ml of isocitrate dehydrogenase and 8 mM MgCl2), 35 pmol human liver microsomes and 2.6 µM 7-ethoxyresorufin. Final incubation mixture volume was 100 µl. Inhibition experiments were performed with five concentrations of anthocyanidins (10, 20, 40, 80, 100 µM). Experimental conditions were the same as above. Reaction mixtures were pre-incubated with inhibitors at 37°C for 30 min. With luciferin-CEE luminogenic substrate, microsomes with 22 pmol total CYP were preincubated with 60 µM luciferin-CEE and pelargonidin or delphinidin (same final concentrations as above) for 30 minutes at 37°C; then, NADPH-generating system was added (same as above) and the system was incubated for 10 min. Detection reagent was then added and the reaction mixture was incubated for 20 min. according to the recommended protocol (www.promega.com). Two independent experiments were done with duplicates which did not differ by more than 10%. Inhibition of CYP1A activities was in all cases evaluated by plotting the respective remaining activity versus the inhibitor concentration.
2.9. AhR ligand binding assay
[3H]TCDD was kindly provided by Dr Steven Safe (Texas A&M university) and 2,3,7,8- tetrachlorodibenzofuran (TCDF) was from Accustandard (New Haven, CT USA). The competitive displacement of [3H]TCDD from guinea pig hepatic cytosol was as previously described (Korashy et al. 2011). Briefly, hepatic guinea pig cytosol diluted to 8 mg/ml protein in MEDG (25 mM MOPS-NaOH, pH 7.5, 1 mM EDTA, 1 mM DTT, 10% v/v glycerol) was incubated with different concentrations of pelargonidin chloride or 200 nM TCDF for 30 min at room temperature or on ice, and further incubated for 1 h at room temperature in the presence of 2 nM [3H]TCDD. The amount of [3H]TCDD specific binding was determined by hydroxyapatite protocol, and specific binding was determined as the difference between the ‘no competitor’ and TCDF reaction (Denison 2002).
3. RESULTS
3.1. Effects of anthocyanidins on transcriptional activity of AhR in AZ-AHR reporter cell line
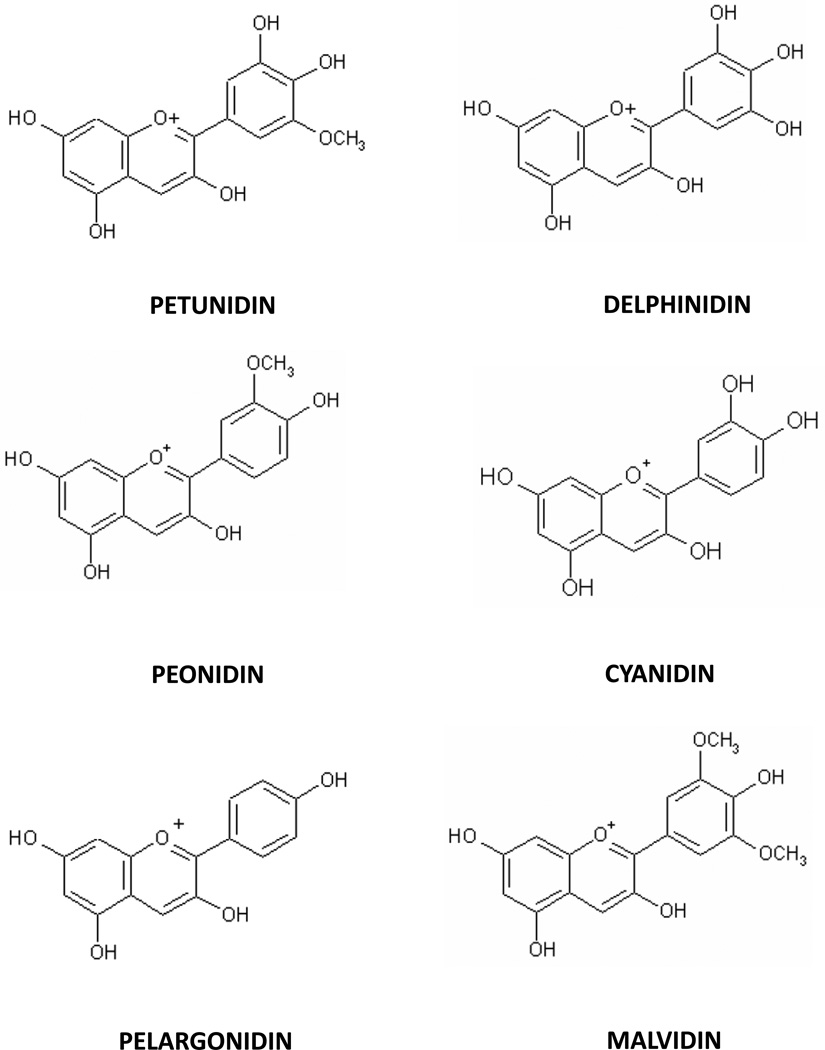
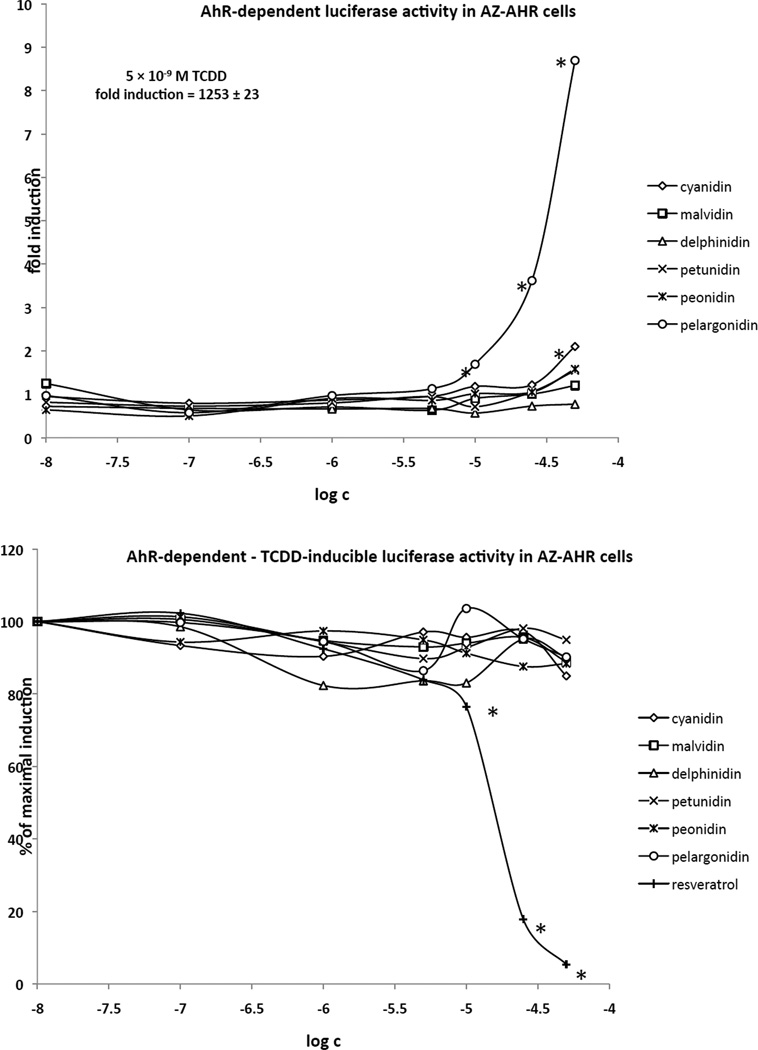
In the first series of experiments, we examined the effects of the various anthocyanidins (chemical structures shown in Figure 1) on transcriptional activity of AhR. Experiments were performed in recombinant AZ-AHR cells, which are HepG2 cells that had been stably transfected with an AhR-responsive luciferase reporter plasmid (Novotna et al. 2011). In agonist experiments, the cells were incubated for 24 h with increasing concentrations (10 nM – 50 µM) of anthocyanidins (cyanidin, delphinidin, malvidin, peonidin, petunidin, pelargonidin), TCDD (5 nM) or vehicle (0.1% v/v DMSO). Luciferase activity was increased 1253-fold by TCDD, the most potent activator of AhR. Pelargonidin produced a concentration-dependent induction of luciferase activity, which was significantly different from vehicle at concentrations of 10 µM and higher (Figure 2, upper panel). Although the magnitude of induction by 50 µM pelargonidin was 9-fold greater than that of the vehicle (DMSO) control, the magnitude of the induction response was very low when compared to TCDD (i.e. less than 1% of the maximal level of induction by TCDD). While very low, but significant level of induction of luciferase activity was observed for 50 µM cyanidin (Figure 2, upper panel), no significant induction of luciferase activity was observed with delphinidin, malvidin, peonidin or petunidin. In antagonist experiments, the cells were incubated with increasing concentrations of anthocyanidins and/or resveratrol in the presence of TCDD. While the induction of luciferase activity was not significantly altered by any of the anthocyanidins tested, resveratrol, a known antagonist of AhR, produced a concentration-dependent decrease of TCDD-induced luciferase activity to a maximum of 95% inhibition at 50 µM resveratrol (Figure 2, lower panel). Taken together, these results indicate that pelargonidin is a weak AhR agonist with no apparent antagonist activity.
Figure 1. Chemical structures of anthocyanidins.
Figure 2. Effects of anthocyanidins on transcriptional activity of AhR in AZ-AHR reporter cell line.
AZ-AHR cells were seeded in 96-well plates and stabilized for 16 h. Thereafter, the cells were treated for 24 h with anthocyanidins (10 nM – 50 µM; i.e. cyanidin, delphinidin, malvidin, peonidin, petunidin, pelargonidin), 2,3,7,8- tetrachlorodibenzo-p-dioxin (TCDD; 5 nM) and/or vehicle (DMSO; 0.1% v/v). Upper panel: Agonist mode, i.e. incubation with individual compounds; Lower panel: Antagonist mode, i.e. combined incubation of 5 nM TCDD plus tested compounds and/or resveratrol in increasing concentrations. After the treatments, cells were lysed and luciferase activity was measured. The data are the mean from triplicate measurements and are expressed either as fold induction over DMSO-treated cells (agonist mode) or as percentage of the induction by TCDD (antagonist mode). Experiments were performed in three different passages of AZ-AHR cells. The differences between individual measurements were lower that 5%. * - values significantly different from the vehicle value (p < 0.05) as determined by the Student’s t-test.
3.2. Effects of anthocyanidins on CYP1A1 expression in cancer cells HepG2 and LS174T
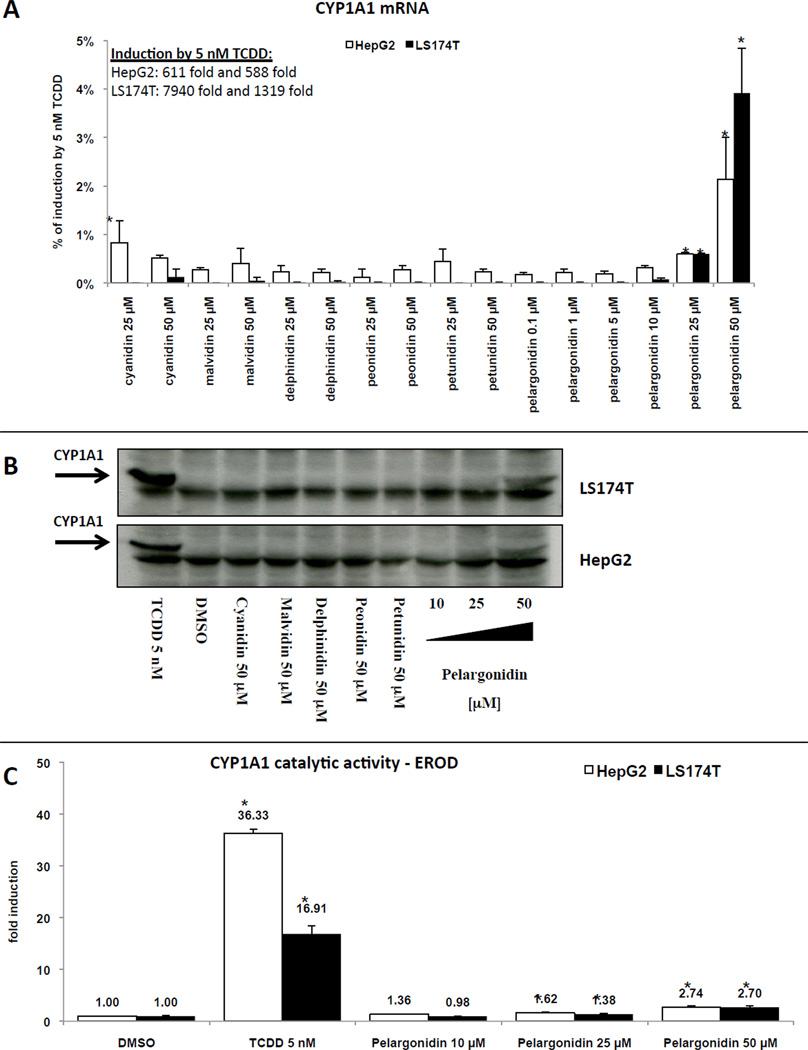
A typical target gene of ligand- and AhR-dependent signal transduction is CYP1A1. Therefore, we studied the effects of anthocyanidins on the expression of CYP1A1 mRNA, protein and enzyme catalytic activity in hepatic HepG2 and intestinal LS174T human cancer cells. Cells were incubated with anthocyanidins, TCDD (5 nM) and DMSO (0.1% v/v) for 24 h and 48 h. TCDD strongly induced CYP1A1 mRNA after 24 h of incubation in HepG2 cells (588-fold and 611-fold) and in LS174T cells (1319-fold and 7940-fold). While cyanidin, delphinidin, malvidin, peonidin and petunidin did not influence CYP1A1 mRNA, protein and enzyme activity levels, pelargonidin increased CYP1A1 mRNA expression in concentration-dependent manner in both cell lines. However, pelargonidin was a relatively weak inducer of CYP1A1 mRNA in HepG2 and LS174T cells increasing CYP1A1 mRNA levels by only about 2% and 4% of that observed with a maximal inducing concentration of TCDD, respectively (Figure 3A). Pelargonidin (50 µM) incubation did increase CYP1A1 protein levels in HepG2 and LS174T cell lines after 48 h incubation (Figure 3B). EROD activity in HepG2 and LS174T cells was induced 36-fold and 17-fold by TCDD after 24 h of incubation, respectively. Similarly to its effect on CYP1A1 mRNA and protein levels, pelargonidin increased EROD activity ~3-fold in concentration-dependent manner in both cell lines (Figure 3C). Collectively, these results further support the conclusion that pelargonidin is an AhR agonist, albeit relatively weak compared to TCDD.
Figure 3. Effects of anthocyanidins on CYP1A1 expression in HepG2 and LS174T cells.
Panel A: Cells were treated with cyanidin (25 µM and 50 µM), delphinidin (25 µM and 50 µM), malvidin (25 µM and 50 µM), peonidin (25 µM and 50 µM), petunidin (25 µM and 50 µM), pelargonidin (0.1 µM, 1 µM, 5 µM, 10 µM, 25 µM and 50 µM), TCDD (5 nM) and vehicle (DMSO; 0.1% v/v). Bar graph shows representative RT-PCR analyses (3 independent experiments) of CYP1A1 mRNA after 24 h treatment. The data are the mean from triplicate measurements and are expressed as percentage of maximal induction attained in TCDD-treated cells. The data were normalized per GAPDH mRNA levels. * - value is significantly different from DMSO-treated cells (p < 0.05) as determined by the Student’s t-test. Panel B: Cells were treated with cyanidin (50 µM), delphinidin (50 µM), malvidin (50 µM), peonidin (50 µM), petunidin (50 µM), pelargonidin (10 µM, 25 µM and 50 µM), TCDD (5 nM) and vehicle (DMSO; 0.1% v/v) for 48 h. Western blots show a representative analysis of CYP1A1 protein. Similar profiles were observed in three independent experiments. As a loading control, the blots were probed to actin (data not shown). Panel C: Cells were treated with pelargonidin (10 µM, 25 µM and 50 µM), TCDD (5 nM) and vehicle (DMSO; 0.1% v/v) for 48 h. Catalytic activity of CYP1A1 (EROD) was measured as described in detail in Methods section. The data are mean from triplicate measurements and are expressed as fold induction over DMSO-treated cells. * - value is significantly different from DMSO-treated cells (p < 0.05) as determined by the Student’s t-test.
3.3. Effects of anthocyanidins on CYP1A1 and CYP1A2 expression in primary human hepatocytes
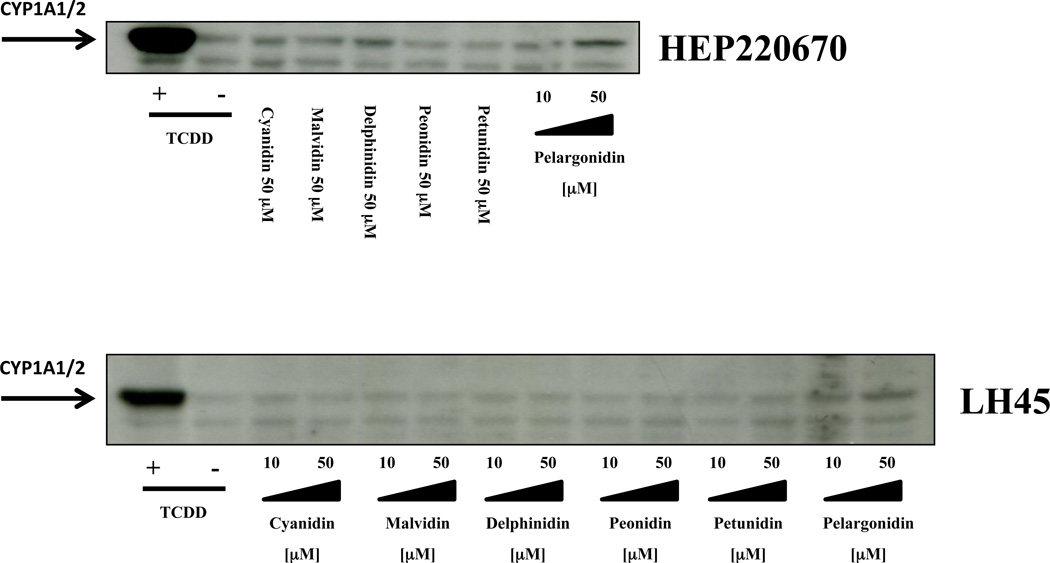
In the next series of experiments, we tested the effects of anthocyanidins on the expression of CYP1A genes in primary human hepatocytes. In contrast to the cell lines, human hepatocytes express a full panel of drug-metabolizing enzymes, hence, the mixed effects of the parent compounds and their metabolites are examined. Three different primary human hepatocytes cultures were used (HH44, HH45 and HEP220670). Dioxin strongly induced the expression of CYP1A1 and CYP1A2 mRNAs in all human hepatocytes cultures at 24 h, and the magnitude of induction ranged between 160–331 fold and 52–144 fold, respectively. Pelargonidin induced CYP1A1 and CY1A2 mRNAs in concentration-dependent manner in all of the primary hepatocytes cultures (Table 1). While slight induction of CYP1A1 and CYP1A2 mRNAs was observed for other tested anthocyanidins, these increases occurred in a culture dependent manner, i.e. they were not systematic. The levels of CYP1A proteins in two human hepatocytes cultures were moderately increased only by incubation with 50 µM pelargonidin for 48 h, as compared to the vehicle-treated cells (Figure 4).
1.
Effects of anthocyanidins on the expression of CYP1A1 and CYP1A2 mRNAs in primary human hepatocytes treated for 24 h with tested compounds. Results are expressed as fold induction over the vehicle-treated cells. Data are mean ± S.D. from triplicate measurements. nd = not determined
| COMPOUND | HH 44 | HH 45 | HEP220670 | |||
|---|---|---|---|---|---|---|
| CYP1A1 | CYP1A2 | CYP1A1 | CYP1A2 | CYP1A1 | CYP1A2 | |
| DMSO | 1.00 ± 0.06 | 1.00 ± 0.06 | 1.00 ± 0.36 | 1.00 ± 0.36 | 1.00 ± 0.14 | 1.00 ± 0.13 |
| TCDD | 159.79 ± 10.5 | 63.34 ± 0.93 | 330.84 ± 57.4 | 51.62 ± 9.13 | 229.13 ± 6.74 | 143.51 ± 0.70 |
| cyanidin 10 µM | 2.29 ± 0.07 | 4.71 ± 0.61 | 0.95 ± 0.26 | 1.42 ± 0.40 | nd | nd |
| cyanidin 50 µM | 2.11 ± 0.23 | 4.96 ± 1.35 | 0.96 ± 0.10 | 2.02 ± 0.26 | 1.80 ± 0.20 | 1.90 ± 0.21 |
| malvidin 10 µM | 0.90 ± 0.05 | 1.89 ± 0.01 | 1.51 ± 0.03 | 1.51 ± 0.06 | nd | nd |
| malvidin 50 µM | 1.35 ± 0.03 | 2.29 ± 0.08 | 1.83 ± 0.15 | 2.96 ± 0.38 | 1.11 ± 0.03 | 1.40 ± 0.05 |
| delphinidin 10 µM | 1.20 ± 0.20 | 2.47 ± 0.14 | 2.19 ± 0.27 | 1.99 ± 0.25 | nd | nd |
| delphinidin 50 µM | 0.96 ± 0.20 | 013 ± 0.02 | 1.16 ± 0.19 | 1.26 ± 0.38 | 1.13 ± 0.03 | 1.33 ± 0.02 |
| peonidin 10 µM | 1.64 ± 0.01 | 1.05 ± 0.05 | 0.84 ± 0.12 | 1.07 ± 0.13 | nd | nd |
| peonidin 50 µM | 3.52 ± 0.80 | 1.61 ± 0.19 | 1.11 ± 0.10 | 1.53 ± 0.13 | 1.57 ± 0.08 | 1.82 ± 0.08 |
| petunidin 10 µM | 1.40 ± 0.32 | 0.69 ± 0.01 | 2.58 ± 0.15 | 2.12 ± 0.14 | nd | nd |
| petunidin 50 µM | 2.35 ± 0.13 | 0.67 ± 0.02 | 1.48 ± 0.18 | 2.57 ± 0.29 | 1.13 ± 0.07 | 0.85 ± 0.03 |
| pelargonidin 10 µM | 14.62 ± 1.64 | 0.53 ± 0.02 | 3.43 ± 0.39 | 2.13 ± 0.25 | 1.59 ± 0.03 | 1.89 ± 0.04 |
| pelargonidin 50 µM | 22.24 ± 3.06 | 0.73 ± 0.07 | 15.3 ± 0.34 | 2.61 ± 0.11 | 5.90 ± 0.09 | 5.41 ± 0.06 |
Figure 4. Effects of anthocyanidins on CYP1A protein expression in primary human hepatocytes.
Cells were treated with cyanidin (10 µM and 50 µM), delphinidin (10 µM and 50 µM), malvidin (10 µM and 50 µM), peonidin (10 µM and 50 µM), petunidin (10 µM and 50 µM), pelargonidin (10 µM and 50 µM), TCDD (5 nM) and vehicle (DMSO; 0.1% V/V) for 48 h. Western blots show analyses of CYP1A proteins from two different primary human hepatocytes cultures. As a loading control, the blots were probed to actin (data not shown).
3.4. Ligand binding assay
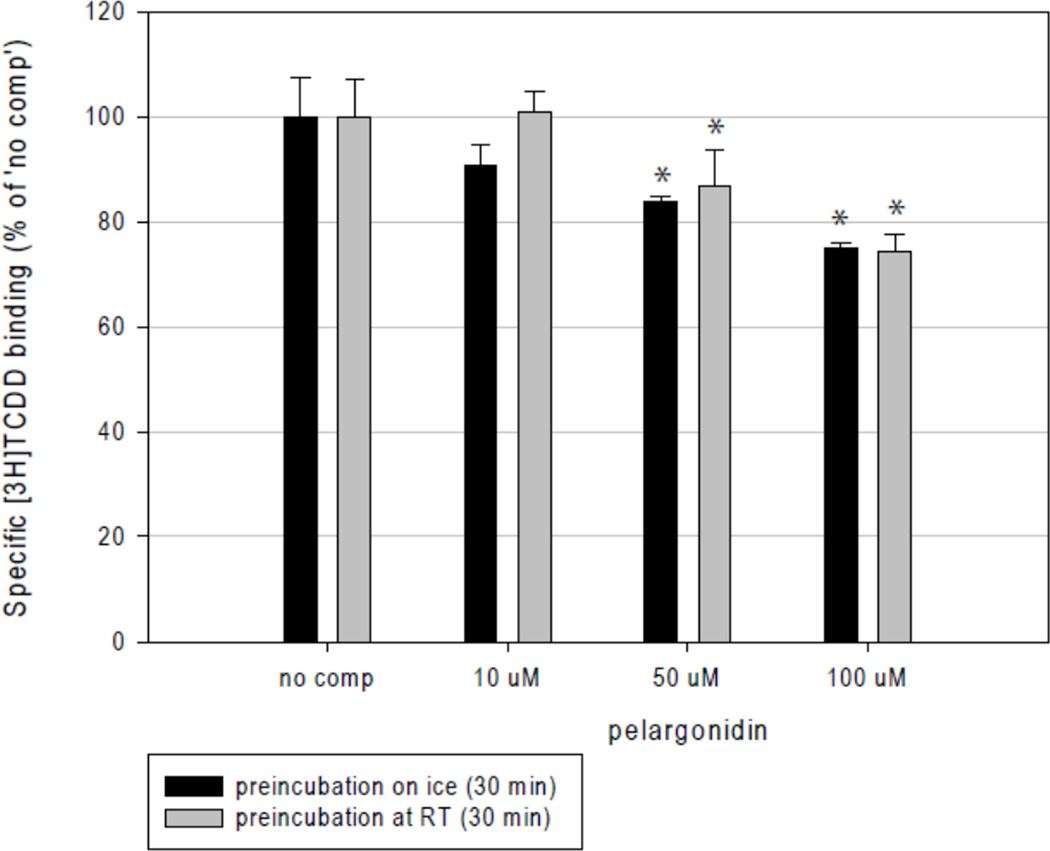
Activation of AhR may occur by ligand-dependent or ligand-independent mechanisms. Therefore, we tested whether the effects of pelargonidin on AhR-CYP1A1 signaling pathway involved binding of pelargonidin to the AhR. For this purpose, we performed AhR ligand binding assays using guinea pig hepatic cytosol. Pelargonidin competitively inhibited [3H]-TCDD binding to the AhR when present in the binding incubation at 50 µM (13–16% inhibition) or 100 µM (25% inhibition), when cytosol was pre-incubated with pelargonidin on ice or at room temperature; there were no consistent differences between pre-incubation conditions (Figure 5). These data are consistent with the previous results which suggest that pelargonidin is a weak ligand/agonist of the AhR, and that the effects of pelargonidin on AhR-CYP1A1 signaling pathway likely occur via a ligand-dependent mechanism.
Figure 5. Ligand binding assay.
Pelargonidin chloride is a weak AhR ligand. Guinea pig hepatic cytosol was pre-incubated with indicated concentrations of pelargonidin chloride or TCDF for 30 min at room temperature or on ice, followed by addition of 2 nM [3H]TCDD and further incubation for 1 h at room temperature. Ligand binding to the cytosolic proteins was determined by the hydroxyapatite binding protocol and scintillation counting. Specific binding was determined as a difference between total and non-specific (TCDF) reactions. The values are presented as mean ± SD of three independent reactions. * - values significantly different from the ‘no competitor’ reaction at P<0.05 as determined by the Student’s t-test. The results are representative of two independent experiments.
3.5. Effects of anthocyanidins on CYP1A1 and CYP1A2 catalytic activity in human liver microsomes
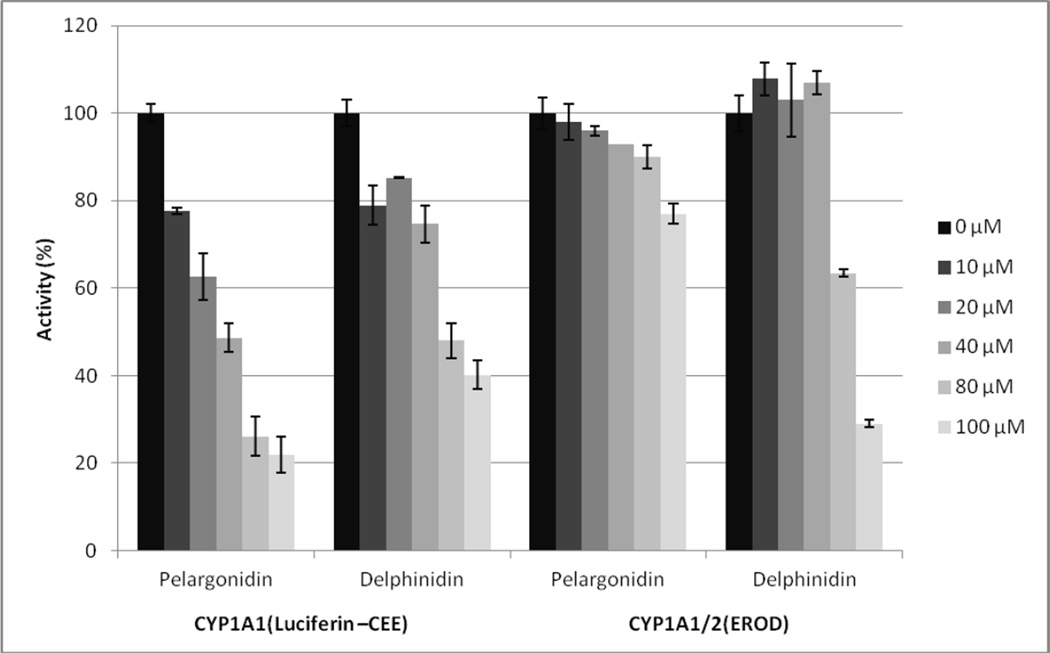
Given the ability of many AhR ligands to also bind to and be metabolized by the coordinately induced CYP1A1/2, we directly examined the effects of anthocyanidins on the activities of two drug metabolizing enzymes by determining their effects on CYP1A1/2 catalytic (EROD) and to CYP1A1- specific luciferin activating activity using human microsomes. Results of these competitive kinetic analyses revealed a weak concentration-dependent inhibition of CYP1A1/2 EROD activity (the EROD deethylating activity is not specific either to CYP1A1 or CYP1A2 as both enzymes share this activity with CYP1A1 being more active) following the addition of petunidin, cyanidin, peonidin and malvidin, albeit to a relatively low extent (to 80% – 95% of the original activity at the highest concentration (i.e. 100 µM) of the respective anthocyanidin). In contrast, delphinidin inhibited CYP1A1/2 EROD activity down to 28% and pelargonidin to 75% of the initial activity (data not shown). This was why with these two anthocyanidins the second, luciferin-based activity specific for CYP1A1 has been followed. CYP1A1 has been chosen for detailed study on the basis of results with AhR activation and CYP1A1 expression in cancer cells (see the respective paragraphs). The data (Figure 6) clearly show the inhibition of CYP1A1 activity down to 22% and 40% of the initial activity (i.e. without anthocyanidin added) corresponding to IC50 values of 33 µM and 77 µM for pelargonidin and delphinidin, respectively. These results thus document the ability of at least two anthocyanidins to interact with drug metabolizing system of CYP1A1/2.
Figure 6. Effects of anthocyanidins on CYP1A1 catalytic activity in human liver microsomes.
Inhibition of human microsomal CYP1A1 catalytic activity by pelargonidin and delphinidin expressed as the amount of activity remaining relative to control (without anthocyanidin) in percent. Concentration of respective anthocyanidins in the reaction mixture was 0, 10, 20, 40, 80 and 100 µM. For experimental details, see the Methods section.
4. DISCUSSION
The phenomenon of food-drug interactions has emerged in the last few years. It comprises pharmacokinetic and toxicokinetic interactions between food constituents and drugs that modify their relative potency and efficacy. While drug-drug interactions may be effectively managed by a physician who prescribes the drugs, the food-drug interactions are not subject to such control. Therefore, it is of value to search for food constituents that may cause or contribute to food-drug interactions. These compounds may be natural food constituents (e.g. alkaloids, polyphenolics, terpenes), artificial food additives (e.g. sweeteners, preservatives, taste and flavor enhancers, colorings, stabilizers etc.) and even contaminants (e.g. persistent organic pollutants). Food-drug interactions may occur in two main ways, i.e. by inhibition or induction of drug metabolizing enzymes. Recently, we described the effects of extracts from ready-to-drink teas (Kamenickova et al. 2012) and flavored mineral waters (Kamenickova and Dvorak 2012) on the AhR-CYP1A1 signaling pathway in human hepatocytes and human cancer cell lines. We found that extracts from some of non-alcoholic beverages activated AhR and induced CYP1A1/2 and CYP3A4 genes. In the present paper, we studied the effects of six major anthocyanidins on AhR-dependent gene expression and on CYP1A1/2 expression, production and enzymatic activity. Analysis of inhibition of the CYP1A1/2 activity revealed that the effects of the majority of these compounds on metabolic pathways mediated by CYP1A1/2 enzymes are not likely. However, pelargonidin and delphinidin were shown to interfere with CYP1A1/2 drug metabolizing system (Figure 6), although this effect occurred at concentrations higher than those corresponding to the average values reached in human plasma after fruit or juice consumption, i.e. 274 nmol/L and 1220 ng/L for pelargonidin (Mullen et al. 2008) and delphinidin glycosides (Frank et al. 2005), respectively. Since CYP1A enzymes are responsible for activation of many pro-carcinogens (e.g. polycyclic aromatic hydrocarbons) and detoxication of many others (Anzenbacher and Anzenbacherova 2001; Monostory et al. 2009), interference of anthocyanidins present in food with these enzymes may be even beneficial.
The major finding of the current paper is that pelargonidin is a weak ligand/agonist of the AhR, as revealed by ligand binding assay in guinea pig cytosols (Figure 5) and gene reporter assays in recombinant human AZ-AHR cells (Figure 2), respectively. Pelargonidin also induced CYP1A1 mRNA, protein and catalytic activity in human hepatic HepG2 and human intestinal LS174T cancer cells (Figure 3) and also induced CYP1A1 mRNA and to a lesser extent that of CYP1A2 mRNA in three different primary human hepatocytes cultures (Table 1). The levels of CYP1A proteins were slightly elevated by 50 µM pelargonidin in human hepatocytes (Figure 4). While we also observed slight induction of CYP1A1/2 mRNAs in human hepatocytes by 50 µM cyaniding these effects were not consistent, possibly due to the metabolic transformation of cyanidin in human hepatocytes. Other antocyanidins, i.e. delphinidin, peonidin, petunidin and malvidin did not display significant and systematic effects on AhR transcriptional activity and CYP1A1 expression. Regarding structure-activity relationship, pelargonidin is the only anthocyanidin mono-substituted (monohydroxylated) at the phenyl group bound at 2-position of the chromenylium backbone. Speculatively, this feature may be one of the explanations for the unique activity of pelargonidin towards the AhR, because other anthocyanidins are either di-substituted (cyanidin, peonidin) or tri-substituted (malvidin, petunidin, delphinidin) (Figure 1).
Taken together, pelargonidin activates AhR through a ligand dependent mechanism, and induces CYP1A and AhR-dependent reporter genes expression in human cancer cell lines and human hepatocytes, which may be of toxicological significance, with respect to multiple roles of AhR in human organism.
ACKNOWLEDGEMENTS
Our laboratories are supported by a grant GACR 303/12/G163 from the Czech Scientific Agency and a grant from the National Institute of Environmental Health Sciences (ES04699).
Abbreviations
- AhR
Aryl Hydrocarbon Receptor
- EROD
ethoxyresorufin-O-deethylase
- TCDD
2,3,7,8- tetrachlorodibenzo-p-dioxin
Footnotes
CONFLICT OF INTEREST
The authors declare that they have no conflict of interest.
REFERENCES
- Abel J, Haarmann-Stemmann T. An introduction to the molecular basics of aryl hydrocarbon receptor biology. Biological chemistry. 2010;391(11):1235–1248. doi: 10.1515/BC.2010.128. [DOI] [PubMed] [Google Scholar]
- Amakura Y, Tsutsumi T, Sasaki K, Nakamura M, Yoshida T, Maitani T. Influence of food polyphenols on aryl hydrocarbon receptor-signaling pathway estimated by in vitro bioassay. Phytochemistry. 2008;69(18):3117–3130. doi: 10.1016/j.phytochem.2007.07.022. [DOI] [PubMed] [Google Scholar]
- Anzenbacher P, Anzenbacherova E. Cytochromes P450 and metabolism of xenobiotics. Cellular and molecular life sciences: CMLS. 2001;58(5–6):737–747. doi: 10.1007/PL00000897. [DOI] [PMC free article] [PubMed] [Google Scholar]
- Denison MS, Nagy SR. Activation of the aryl hydrocarbon receptor by structurally diverse exogenous and endogenous chemicals. Annual review of pharmacology and toxicology. 2003;43:309–334. doi: 10.1146/annurev.pharmtox.43.100901.135828. [DOI] [PubMed] [Google Scholar]
- Denison MS, Rogers JM, Rushing SR, Jones CL, Tetangco SC, Health-Pagliuso S. Analysis of the AhR Receptor Signal Transduction Pathway. In: Maines M, Costa LG, Reed DJ, Sassa S, Sipes IG, editors. Current Protocols in Toxicology. New York: John Wiley and Sons; 2002. pp. 4.8.1–4.8.45. [DOI] [PubMed] [Google Scholar]
- Donato MT, Gomez-Lechon MJ, Castell JV. A microassay for measuring cytochrome P450IA1 and P450IIB1 activities in intact human and rat hepatocytes cultured on 96-well plates. Anal Biochem. 1993;213(1):29–33. doi: 10.1006/abio.1993.1381. [DOI] [PubMed] [Google Scholar]
- Dvorak Z, Vrzal R, Henklova P, et al. JNK inhibitor SP600125 is a partial agonist of human aryl hydrocarbon receptor and induces CYP1A1 and CYP1A2 genes in primary human hepatocytes. Biochem Pharmacol. 2008;75(2):580–588. doi: 10.1016/j.bcp.2007.09.013. [DOI] [PubMed] [Google Scholar]
- Frank T, Janssen M, Netzel M, et al. Pharmacokinetics of anthocyanidin-3-glycosides following consumption of Hibiscus sabdariffa L. extract. Journal of clinical pharmacology. 2005;45(2):203–210. doi: 10.1177/0091270004270561. [DOI] [PubMed] [Google Scholar]
- Hodek P, Trefil P, Stiborova M. Flavonoids-potent and versatile biologically active compounds interacting with cytochromes P450. Chemico-biological interactions. 2002;139(1):1–21. doi: 10.1016/s0009-2797(01)00285-x. [DOI] [PubMed] [Google Scholar]
- Kamenickova A, Dvorak Z. Effects of flavored mineral waters on AhR-CYP1A1 signaling pathway in primary human hepatocytes and in human hepatic and intestinal cancer cells. Food and chemical toxicology : an international journal published for the British Industrial Biological Research Association. 2012;50(6):1933–1939. doi: 10.1016/j.fct.2012.03.073. [DOI] [PubMed] [Google Scholar]
- Kamenickova A, Vrzal R, Dvorak Z. Effects of ready to drink teas on AhR- and PXR-mediated expression of cytochromes P450 CYP1A1 and CYP3A4 in human cancer cell lines and primary human hepatocytes. Food Chem. 2012;131(4):1201–1206. [Google Scholar]
- Keppler K, Humpf HU. Metabolism of anthocyanins and their phenolic degradation products by the intestinal microflora. Bioorganic & medicinal chemistry. 2005;13(17):5195–5205. doi: 10.1016/j.bmc.2005.05.003. [DOI] [PubMed] [Google Scholar]
- Kong JM, Chia LS, Goh NK, Chia TF, Brouillard R. Analysis and biological activities of anthocyanins. Phytochemistry. 2003;64(5):923–933. doi: 10.1016/s0031-9422(03)00438-2. [DOI] [PubMed] [Google Scholar]
- Korashy HM, Anwar-Mohamed A, Soshilov AA, Denison MS, El-Kadi AO. The p38 MAPK inhibitor SB203580 induces cytochrome P450 1A1 gene expression in murine and human hepatoma cell lines through ligand-dependent aryl hydrocarbon receptor activation. Chemical research in toxicology. 2011;24(9):1540–1548. doi: 10.1021/tx200141p. [DOI] [PMC free article] [PubMed] [Google Scholar]
- Leclercq I, Desager JP, Vandenplas C, Horsmans Y. Fast determination of low-level cytochrome P-450 1A1 activity by high-performance liquid chromatography with fluorescence or visible absorbance detection. Journal of chromatography B, Biomedical applications. 1996;681(2):227–232. doi: 10.1016/0378-4347(95)00543-9. [DOI] [PubMed] [Google Scholar]
- McGhie TK, Walton MC. The bioavailability and absorption of anthocyanins: towards a better understanding. Molecular nutrition & food research. 2007;51(6):702–713. doi: 10.1002/mnfr.200700092. [DOI] [PubMed] [Google Scholar]
- Monostory K, Pascussi JM, Kobori L, Dvorak Z. Hormonal regulation of CYP1A expression. Drug metabolism reviews. 2009;41(4):547–572. doi: 10.1080/03602530903112284. [DOI] [PubMed] [Google Scholar]
- Mullen W, Edwards CA, Serafini M, Crozier A. Bioavailability of pelargonidin-3-O-glucoside and its metabolites in humans following the ingestion of strawberries with and without cream. Journal of agricultural and food chemistry. 2008;56(3):713–719. doi: 10.1021/jf072000p. [DOI] [PubMed] [Google Scholar]
- Novotna A, Pavek P, Dvorak Z. Novel stably transfected gene reporter human hepatoma cell line for assessment of aryl hydrocarbon receptor transcriptional activity: construction and characterization. Environmental science & technology. 2011;45(23):10133–10139. doi: 10.1021/es2029334. [DOI] [PubMed] [Google Scholar]
- Pavek P, Cerveny L, Svecova L, et al. Examination of Glucocorticoid receptor alpha-mediated transcriptional regulation of P-glycoprotein, CYP3A4, and CYP2C9 genes in placental trophoblast cell lines. Placenta. 2007;28(10):1004–1011. doi: 10.1016/j.placenta.2007.05.001. [DOI] [PubMed] [Google Scholar]
- Pavek P, Dvorak Z. Xenobiotic-induced transcriptional regulation of xenobiotic metabolizing enzymes of the cytochrome P450 superfamily in human extrahepatic tissues. Current drug metabolism. 2008;9(2):129–143. doi: 10.2174/138920008783571774. [DOI] [PubMed] [Google Scholar]
- Stejskalova L, Dvorak Z, Pavek P. Endogenous and exogenous ligands of aryl hydrocarbon receptor: current state of art. Current drug metabolism. 2011;12(2):198–212. doi: 10.2174/138920011795016818. [DOI] [PubMed] [Google Scholar]
- Welch CR, Wu Q, Simon JE. Recent Advances in Anthocyanin Analysis and Characterization. Current analytical chemistry. 2008;4(2):75–101. doi: 10.2174/157341108784587795. [DOI] [PMC free article] [PubMed] [Google Scholar]
- Zhang Y, Vareed SK, Nair MG. Human tumor cell growth inhibition by nontoxic anthocyanidins, the pigments in fruits and vegetables. Life sciences. 2005;76(13):1465–1472. doi: 10.1016/j.lfs.2004.08.025. [DOI] [PubMed] [Google Scholar]


