Abstract
Purpose
To evaluate the intra- and inter-rater reliability of the quantification of blood and CSF flow rates by phase contrast MRI.
Materials and Methods
Blood and CSF flows in the upper cervical region were imaged with velocity-encoded cine-phase contrast using 3T scanners from different manufacturers at two centers. Data of 6 subjects scanned in center A and of 5 subjects in center B were analyzed by six readers at two levels of training. Each data set was analyzed three times in a randomized order for a total of 33 data sets. Intra-class correlation coefficients (ICC) were calculated for the primary measurements of areas and flow rates through the main cervical arteries, veins and the CSF space, and for secondary parameters derived from the individual flow rates.
Results
ICC ranged from 0.80 to 0.96 for the lumen area and from 0.97 to 0.99 for the volumetric flow rate. The ICC for the derived secondary measures ranged from 0.85 to 0.99. Differences due to operator level of training were not statistically significant.
Conclusion
High intra- and inter-rater reliability of volumetric flow rate measurements is currently achievable across manufacturers and users’ skill levels with a pulsatility based automated lumen segmentation.
Keywords: MR phase-contrast imaging, flow quantitation, pulsatility-based segmentation, intra-rater reliability, inter-rater reliability
INTRODUCTION
The quantification of imaging parameters such as flow rates is becoming increasingly important in clinical radiology. In strive for objective image analysis, standardized measurements of morphological parameters, such as diameters, areas and volumes as well as physiological parameters such as flow rates are steadily gaining importance (1–5). In order to serve as a valuable diagnostic tool, the evaluation of quantitative parameters needs to be reliable, reproducible and largely independent of the operator’s skill level.
Phase contrast MR imaging (PC-MRI) allows the quantification of flow with a high spatial and temporal resolution. This methodology is widely available to evaluate flow in both large and small vessels in different body regions (6–12). PC-MRI is becoming more utilized in the central nervous system (CNS) for measurements of blood and CSF flow rates for derivation of relevant physiological and clinical parameters such as CSF formation rates (13), intracranial compliance in idiopathic normal pressure hydrocephalus (15), Chiari malformations (16, 17), and MR estimates of intracranial pressure in hydrocephalus (14).
Flow quantification with PC-MRI requires a reliable delineation of the lumen boundaries. Manual delineation is a potential source of increased variability. Several methods for automated flow quantification have been developed. However, most of these methods rely on spatial information within a single image, and therefore performance is influenced by image quality and motion artifacts (11, 12). A more robust method, the Pulsatility Based Segmentation Method (PUBS), which utilizes both, spatial and temporal information from the entire time series, has been shown to improve reproducibility and accuracy compared to manual delineation (18). Significant improvements in measurement accuracy had been demonstrated when comparing PUBS to a manual segmentation of pulsatile flows in phantoms of 8-mm and 5-mm luminal diameters sizes which are comparable to those of the ICA and VA vessels measured in the current study. Moreover, there was a fourfold reduction in inter-observer measurement variability obtained with the PUBS method (18). However, this method has not yet been evaluated regarding its intra- and inter-rater reliability across centers, across different MRI scanner manufacturers, and regarding its dependence on the operators´ skill level.
Therefore, this work aims to evaluate the robustness of the PUBS method by investigating the intra- and inter-rater reliability of the quantification of lumen areas and volumetric flow rates of blood and CSF flow to and from the cranial vault in a multi-reader approach at two centers. The primary parameters include lumen cross sectional area and volumetric flow rates in arteries, veins, and CSF lumens. Arterial flow was assessed in the carotid arteries and vertebral arteries; venous flow was quantified in the jugular veins. Craniospinal CSF flow was evaluated in the upper cervical spine. In addition, the intra- and inter-rater reliability of secondary parameters derived from these measurements was assessed as well. These include the peak-to-peak pressure gradient (PTPPG), maximal intracranial volume change (ICVC) during the cardiac cycle and the intracranial compliance index from which an MR-estimate of intracranial pressure (MR-ICP) is obtained (15, 19).
METHODS AND MATERIALS
Selection and Characteristics of Data Sets
Six consecutive scans of subjects examined in center A and 5 consecutive studies of subjects examined in center B were included in the study. The MRI data used in this study were collected as part of an evaluation of an experimental method to noninvasively estimate intracranial compliance and pressure by MRI (MR-ICP). In this context institutional review board (IRB) approval from the respective institutions and written informed consent were obtained from all study participants. Prior to the study, all subject identifying information was removed. The age of the investigated subjects was between 10 and 43 years old (mean 29 years, SD ± 13.33, 4 female) in center A and between 24 and 56 years old (mean 36.75 years, SD ± 11.78, 3 female) in center B.
Data Acquisition
MRI data were collected in two centers with a 3 Tesla MR scanner from a different manufacturer (center A: Magnetom Verio, Siemens Healthcare, Erlangen, Germany; center B: GE HDx, GE Healthcare, Milwaukee, WI). Two retrospectively gated, velocity-encoded cine-phase contrast scans were performed. Imaging parameters were as similar as possible within the possibility provided by the manufacturers. First, a high velocity encoding (VENC = 70 cm/second) was used to quantify the high velocity blood flow in the internal carotid arteries (ICA), vertebral arteries (VA), and internal jugular veins (IJV). A low VENC of 7–9 cm/s was used for measurement of CSF flow at the upper C2 level. Other imaging parameters included: FoV = 140 mm, slice thickness = 6 mm, effective TR = 10 ms (9.3 for GE), TE of high VENC sequence = 4.1 ms (4.5 GE) and of low VENC sequence = 7.5 (6.3 for GE), FA = 20 deg.
In order to ascertain positioning as perpendicular as possible to all four arterial vessels, selection of the imaging plane for the blood flow measurement was done using two orthogonal MIP projections of a 2D TOF MRA scan at an upper C2 location as suggested by Tain et al. (20). This 2D TOF MRA of the upper neck arteries served as a vascular localizer (vessel scout images) with orthogonal views of the vasculature being used to optimize the imaging plane position. The imaging plane was carefully placed using the MIP images as a reference in an orientation as perpendicular as possible to the main four arteries.
Flow Quantitation Method
Details of the PUBS method have been previously described (18). Briefly, the PUBS method utilizes the velocity dynamics in each pixel to differentiate between lumen and background pixels based on the entire image series. A reference velocity waveform is selected by placing a cursor within the lumen of interest. The cross correlation (CC) value between the reference waveform and the velocity waveform at each of the neighboring pixels is then calculated. A histogram of the number of pixels with a CC value above the detection threshold as a function of the threshold value is then generated to identify an unbiased optimal threshold. Multiple reference waveforms can be used for segmentation of lumens with a more heterogeneous flow such as in veins (18). Flow quantitation was performed using a software implementation of the PUBS method (MRICP version 1.4.35, Alperin Noninvasive Diagnostics, Miami, FL).
Reader Status and Training
Six readers at two levels of training participated in the study. Three readers (readers #1 and #2 in center A, and reader #3 in center B) had more than 18 months of experience in using the MR-ICP software quantitation tool, which included analyzing over 150 data sets per reader. The other three (reader #4 and #6 in center A and reader #5 in center B) were naive to the MR-ICP software and the quantitation tool. The naive readers were trained by one of the experienced readers in each center by going through ten training cases.
Guidelines
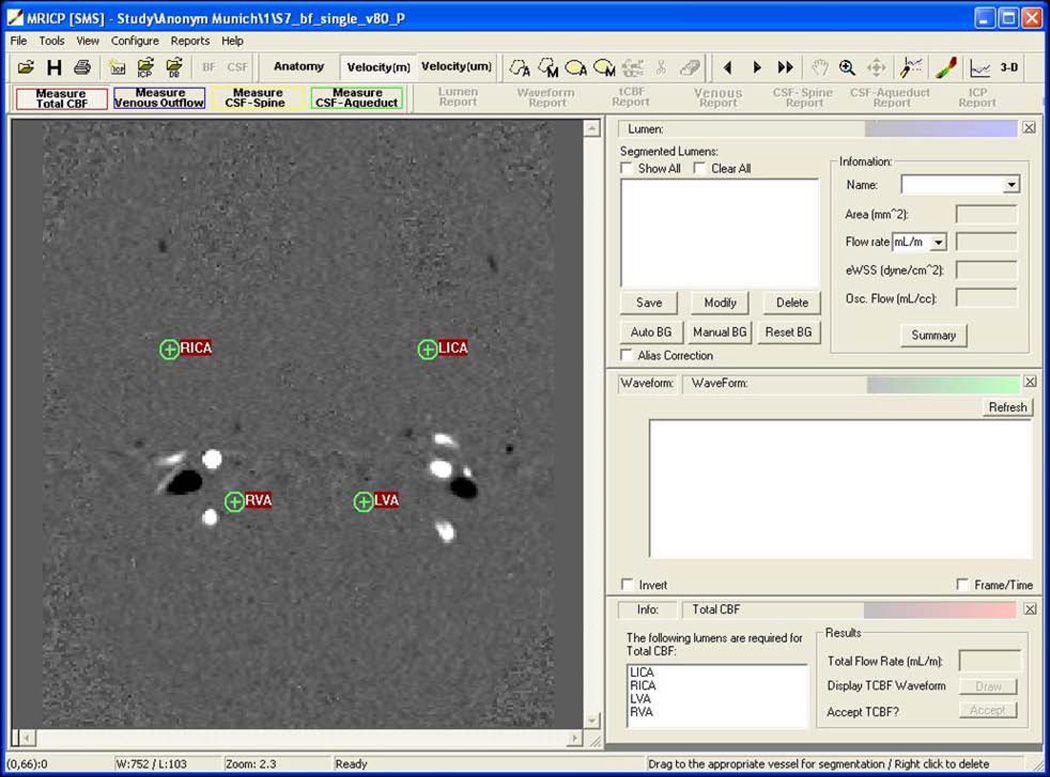
The configuration of the software tool was the same for all users. Readers had to load the data set and then place pre-labeled circles in the center of the corresponding lumen as the initial seed (Figure 1). Readers were encouraged to add additional seeds inside the lumen in order to ascertain that the entire lumen of the vessel was identified. In addition, users were given the ability to override the recommended CC threshold value to either increase or reduce the number of identified lumen pixels. For the derivation of the MRICP value, readers were instructed to include venous outflow through secondary cervical veins (e.g., epidural, vertebral and deep cervical veins) using the low VENC series if the measured volumetric flow through the jugular veins was less than 75% of the total arterial inflow.
Figure 1.
Image of the user interface of the MRICP image analysis tool demonstrating a cine phase contrast image with high-velocity encoding used for quantification of arterial and venous flow. The labeled green circles are to be placed within the central region of the respective lumen by the reader.
Data Analysis
Each data set was anonymized and presented three times in a randomized reading order. Therefore, the total number of analyzed data sets was 33 for each reader. The data sets were subdivided into three equal parts and had to be independently analyzed in three different sessions. Each session was followed by an interval of at least 24 hours. We limited the number of data sets per session in order to avoid the influence of fatigue.
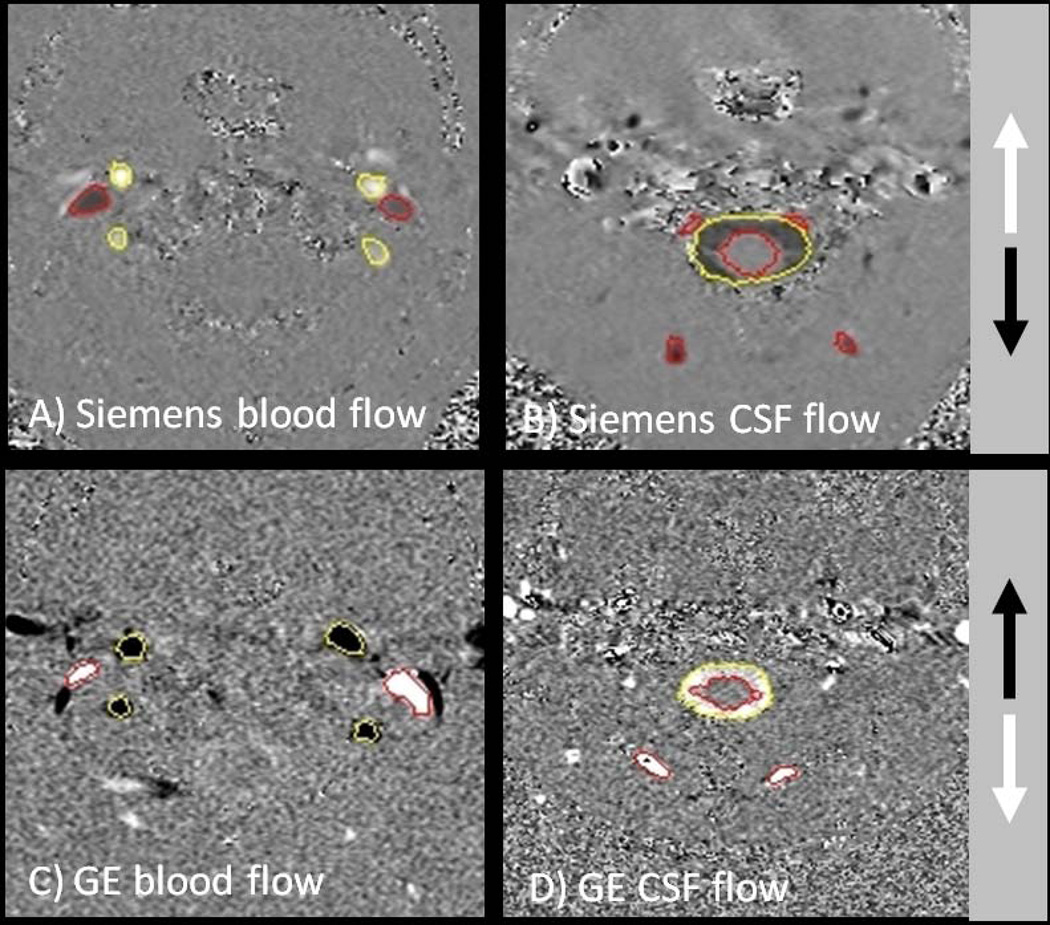
Data from different scanner types were analyzed during different sessions as the analysis software has to be configured differently for each scanner type in order to accommodate differences in DICOM file headers and image appearances between the different scanner types (i.e., the Siemens scanner encodes upward flow in white and downward flow black, while in the GE scanner, the color scheme is reversed and phase images are masked by the magnitude images as shown in Figure 2). The adjustment of the software configuration does not influence the analyses, though, as computation is done utilizing the unmasked phase values.
Figure 2.
Example of cine phase contrast image of blood flow and CSF flow taken on a Siemens and a GE system respectively. Note the difference of the color-scheme, where cranial inflow is encoded in white and cranial outflow is encoded in black on the Siemens system. The direction of the flow encoding is opposite on GE systems.
The parameters provided by the analysis tool include lumen area and mean volumetric flow rate for each of the blood vessels, and area and stroke volume for the CSF lumens. Derived secondary parameters include total cerebral blood flow (TCBF), which is the sum of the volumetric flow rates through the four arteries (TCBF = LICA + RICA + LVA + RVA), and jugular venous outflow (JVO), which is the sum of the mean volumetric flow rate through the right and left internal jugular veins (JVO = RIJV+LIJV). Other secondary measures provided by the software include peak-to-peak cranio-spinal CSF pressure gradient (PTPG), maximal systolic intracranial volume change (ICVC), and the derived ICP value. Analyses were performed with the MRICP software version 1.4.35 (Alperin Noninvasive Diagnostics, Miami, FL).
Statistics
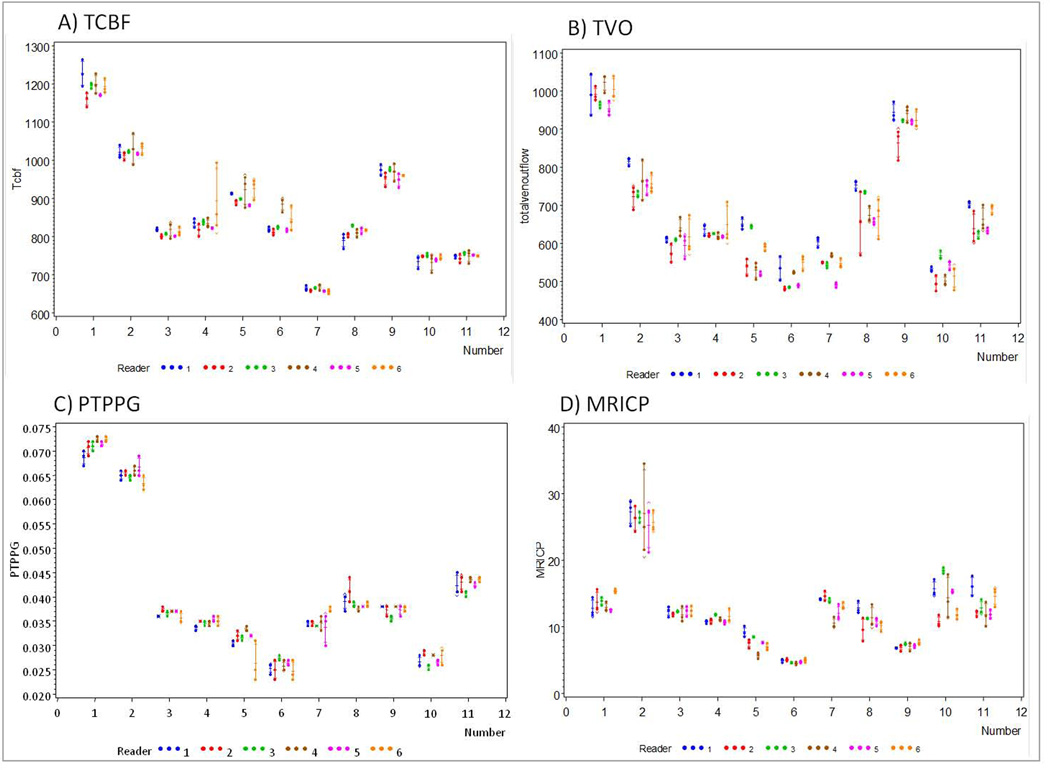
The primary and secondary parameters were plotted for each dataset illustrating data points of individual readers (dots) and additionally showing mean (horizontal dash) and standard deviation of repeated measurements (whiskers). Using the average of multiple readings (three per subject) intra-class correlation coefficients (ICC) were calculated as a measure of inter-rater and intra-rater reliability (two-way random and two-way mixed ANOVA design, respectively) (21). In general, ICC values above 0.8 are considered to represent excellent reliability, while a value for ICC equal to 1.0 indicates perfect agreement (22). To denote the amount of variance that can be attributed to each of the rating effects (reader, subject, repeated measurement and covariates, where applicable) linear mixed effects models were performed in order to assess the variance components of those effects. Likewise, dedicated ICCs for inter-rater agreement were derived from these results including 95% confidence limits, which were obtained by using a bootstrap method. All statistics were generated with SAS Software 9.2 (SAS Institute Inc., Cary, NC, USA).
RESULTS
Primary Measures
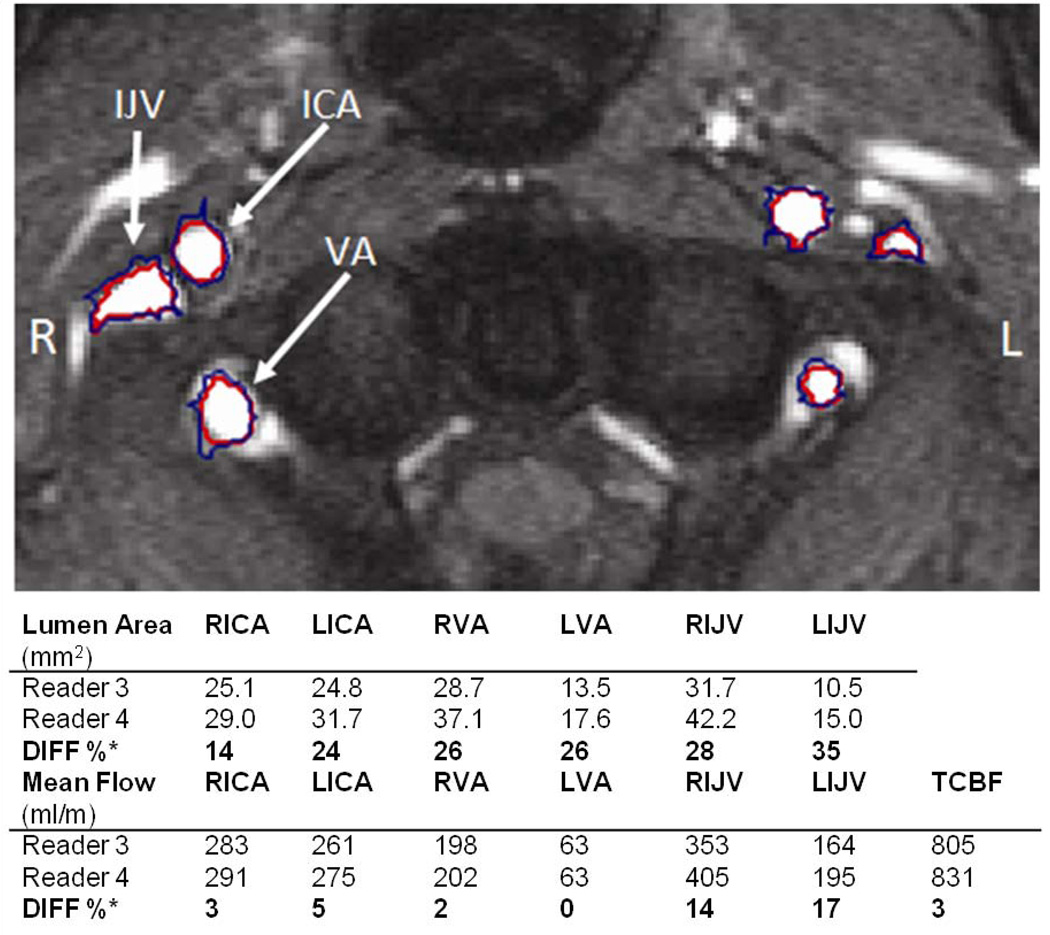
An example of automatically detected lumen boundaries obtained by an experienced and by an inexperienced rater is shown superimposed on the gradient echo magnitude image in Figure 3. The inexperienced rater lowered the CC threshold below the system recommended value, which resulted in inclusion of additional pixels along the lumen boundaries (blue). Regardless of the suboptimal threshold, relative differences in mean volumetric flow rates were around 5% for the arterial flow and around 15% for the venous flow measurements.
Figure 3.
Differences in lumen segmentation by an experienced (reader 3) and an inexperienced (reader 4) user. The inexperienced and the experienced users’ ROIs are shown in blue and red, respectively on a magnitude image of the phase contrast scan. Lumen areas obtained by the inexperienced user are larger by 14 to 35%. However, this was associated with only a 3% difference in the TCBF values obtained by these users. DIFF % = Absolute [Difference / Mean] *100.
Variance component analyses revealed a high inter-rater reliability for the ‘area’ measurements with ICC ranging from 0.801 (RICA) to 0.962 (RIJV). The observed reliability of the ‘volumetric flow rate’ measurements was found to be even higher, with an ICC ranging from 0.971 (LICA) to 0.993 (LVA).
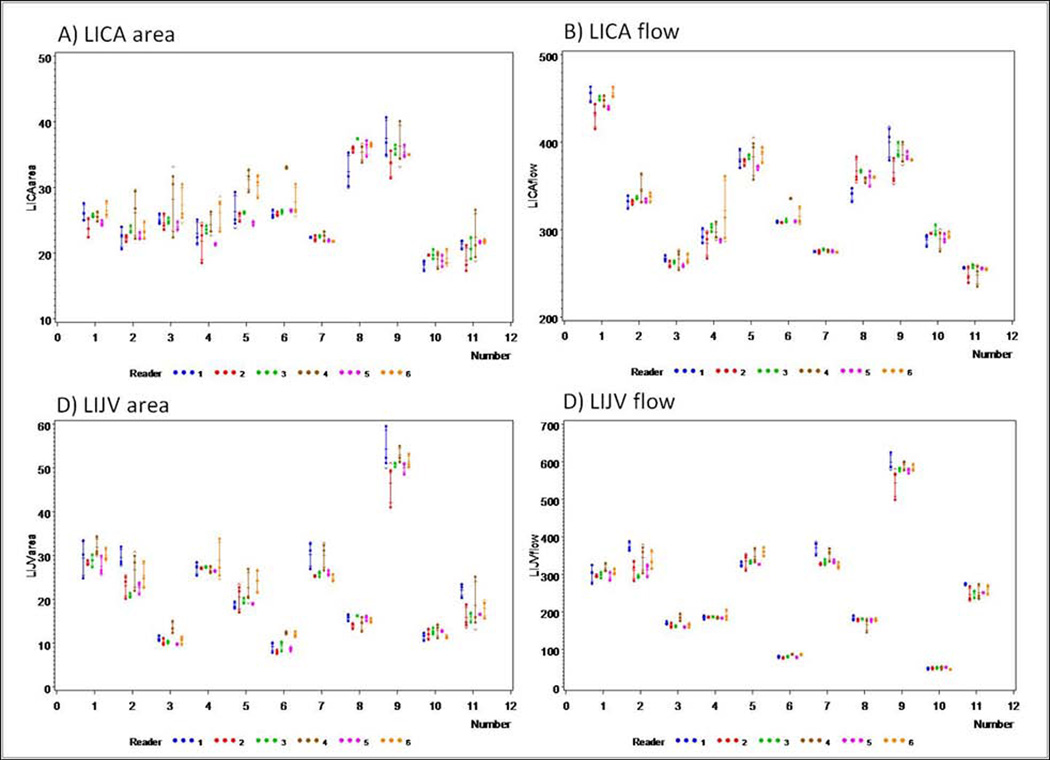
The intra-reader reliability for the ‘volumetric flow rate’ measure ranged from 0.998 to 0.999. The ICC values for the primary measures of area and flow are listed in Table 1 and 2, respectively. Examples of area and flow rate measurements variability for one artery (LICA) and one vein (RIJV) for each subject and reader are shown in Figure 4.
Table 1. Statistical analysis of the evaluation of primary measure “lumen areas”.
Intra-class correlation coefficient (ICC) regarding the inter-rater reliability (ICC 2,6) and the intra-rater reliability (ICC 3,6) according to the Shrout and Fleiss convention. Additionally the Variance of Components Analysis which allows for covariate effects is displayed including the 95% confidence interval for all primary measurements.
| ICC(2,6) | ICC(3,6) | Variance Component Analysis | |||
|---|---|---|---|---|---|
| Parameter | inter-rater reliability |
intra-rater reliability |
Intraclass Correlation |
ICC 95% Confidence Interval |
|
| LICAarea | 0.984 | 0.989 | 0.868 | 0.833 | 0.903 |
| RICAarea | 0.975 | 0.982 | 0.801 | 0.752 | 0.850 |
| LVAarea | 0.994 | 0.996 | 0.942 | 0.925 | 0.959 |
| RVAarea | 0.989 | 0.992 | 0.886 | 0.851 | 0.921 |
| LIJVarea | 0.995 | 0.997 | 0.956 | 0.943 | 0.968 |
| RIJVarea | 0.996 | 0.998 | 0.962 | 0.953 | 0.971 |
| CSFarea | 0.985 | 0.987 | 0.881 | 0.839 | 0.923 |
Table 2. Statistical analysis of the evaluation of primary measure “volumetric flow rates”.
Intra-class correlation coefficient (ICC) regarding the inter-rater reliability (ICC 2,6) and the intra-rater reliability (ICC 3,6) according to the Shrout and Fleiss convention. Additionally the Variance of Components Analysis which allows for covariate effects is displayed including the 95% confidence interval for all primary measurements.
| Parameter | ICC(2,6) | ICC(3,6) | Variance Component Analysis | ||
|---|---|---|---|---|---|
| inter-rater reliability |
intra-rater reliability |
Intraclass Correlation |
ICC 95% Confidence Interval |
||
| LICAflow | 0.997 | 0.998 | 0.971 | 0.958 | 0.984 |
| RICAflow | 0.999 | 0.999 | 0.985 | 0.980 | 0.991 |
| LVAflow | 0.999 | 0.999 | 0.993 | 0.989 | 0.997 |
| RVAflow | 0.999 | 0.999 | 0.991 | 0.988 | 0.994 |
| LIJVflow | 0.999 | 0.999 | 0.987 | 0.983 | 0.992 |
| RIJVflow | 0.999 | 0.999 | 0.989 | 0.987 | 0.992 |
| CSFsv | 0.998 | 0.998 | 0.978 | 0.957 | 1.000 |
Figure 4.
The figure shows the results of the quantified parameters (A) LICA area; (B) LICA volumetric flow rate; (C) LIJV area; (D) LIJV volumetric flow rate. Measurements are grouped by the subjects 1–12 (center A: subjects 1–6; center B: subjects 7–12) illustrating data points of individual readers (dots) and additionally showing mean (horizontal dash) and standard deviation of repeated measurements (whiskers).
Secondary Measures
An excellent inter-rater reliability was found for the secondary parameters as well demonstrated by the intra-class correlation coefficients ranging from 0.845 (ICVC) to 0.989 (PTPPG). In addition, intra-rater reliability were high as well ranging from 0.979 (ICVC) to 0.999 (PTPPG). ICC values and 95% confidence intervals for each of the secondary parameters are listed Table 3. The variability of selected secondary measures for each subject and from each of the raters is shown in Figure 5.
Table 3. Statistical analysis of the evaluation of secondary measures.
Intra-class correlation coefficient (ICC) regarding the inter-rater reliability (ICC 2,6) and the intrarater reliability (ICC 3,6) according to the Shrout and Fleiss convention. Additionally the Variance of Components Analysis which allows for covariate effects is displayed including the 95% confidence interval for all primary measurements.
| ICC(2,6) | ICC(3,6) | Variance Component Analysis | |||
|---|---|---|---|---|---|
| Parameter | inter-rater reliability |
intra-rater reliability |
Intraclass Correlation |
ICC 95% Confidence Interval |
|
| TCBF | 0.998 | 0.998 | 0.979 | 0.967 | 0.990 |
| JVF | 0.992 | 0.995 | 0.942 | 0.926 | 0.959 |
| ICVC | 0.978 | 0.979 | 0.845 | 0.811 | 0.879 |
| PG | 0.999 | 0.999 | 0.989 | 0.984 | 0.993 |
| ICCI | 0.991 | 0.993 | 0.939 | 0.921 | 0.958 |
| ICP | 0.991 | 0.992 | 0.920 | 0.895 | 0.944 |
Figure 5.
The figure demonstrates the results of the calculated secondary parameters (A) TCBF; (B) JVF; (C) PTPPG; (D) MRICP. Measurements are grouped by the subjects 1–12 (Center A: subjects 1–6; Center B: subjects 7–12) illustrating data points of individual readers (dots) and additionally showing mean (horizontal dash) and standard deviation of repeated measurements (whiskers).
Effect of the Rater’s Level of Experience
Statistical analyses with multivariate models did not reveal a significant influence of the level of experience of the rater on the intra- and inter-rater reliability (p-value ranged between 0.14 and 0.79). However, most of the visually observed outliers regarding the range of the intra-reader reliability could retrospectively be assigned to the inexperienced readers, e.g. TCBF in subject 5 analyzed by reader 6 (Figure 5A) or MRICP in subject 2 analyzed by reader 4 (Figure 5D).
DISCUSSION
Overall, the ICC values of the primary volumetric flow rates were 0.997 or higher - well above 0.8, which is considered to reflect excellent reliability (22). As expected, the ICC values of the secondary parameters were slightly lower, but still very high (0.978 or higher). When compared to other reliability studies in radiology, these ICC values are high (1, 2, 11). This overall high inter-rater reliability is likely attributed in large parts to the robustness of the PUBS method employed for the quantitation of the volumetric flow rate measurements.
Unlike methods, which only utilize spatial information in a single image, the PUBS method utilizes the entire cine image series for determination of the lumen boundary. The utilization of the temporal information from a series of images increases the information content and contrast to noise ratio available for the segmentation process. This in turn results in a more robust measurement method.
A recent study by Wahlin et al. assessed repeatability of blood flow and CSF flow measurements by performing five repetitions of phase contrast MR imaging in the same subject. Reported ICC values in repeated measurements were equal or lower than 0.85 (23). The lower ICC values might be attributed in part to the manual segmentation used in that study.
Reliable flow quantitation requires both an optimized image acquisition protocol and a robust post acquisition processing tool.
Previous studies have focused on the influence of various imaging factors such as the effect of ECG triggering and subject reposition on the reproducibility of phase contrast measurements (7). To our knowledge, the current study is the first quantitative assessment of the robustness of the flow quantitation technique itself with respect to inter and intra rater reliability.
Measurements of lumen areas demonstrated a higher variability than measurements of the corresponding volumetric flow rate (e.g. LICA area vs. LICA volumetric flow rate). Differences in lumen area of blood vessels obtained by rates that used different CC thresholds is due to inclusions of additional pixels near the boundaries of the vessels as shown in Figure 3. This is expected because pixels at the border of a vessel do not have the same impact on the flow measurements as the pixels in the center. The peripheral pixels are generally characterized by a relatively lower flow compared to the central pixels. Therefore, the peripheral pixels are contributing less to the volumetric flow rate leading to a smaller variability compared to the measure ‘area’.
While differences in performance due to level of experience were not statistically significant, larger variability can be seen in measurements obtained by the inexperienced raters. Most of the visually observed outliers of the evaluated measures could be retrospectively assigned to one of the inexperienced readers (#4 – #6). Experience gained in this study points to the importance of providing the inexperienced rater with a uniform training and a more specific guideline regarding the choice for the number of seeds to be used for the different types of lumens. Additional improvement can be obtained by alerting the rater when a CC threshold outside the recommended range is used. These changes may further improve the reliability of the measurements for inexperienced raters. High measurement reliability, regardless of level of experience, will advance the utilization of quantitative imaging in both academic and nonacademic imaging centers.
The small sample size is a limitation of the study that needs to be taken into account when interpreting the results. The sample size is rather small in regard to the number of centers (n=2), the number of subjects (6 and 5, respectively for the two centers) and the number of readers (n=6). Therefore, the statistical analyses were performed using a more exploratory research methodology with descriptive and casuistic statistical methods. The sample size was taken into account in all statistical analyses and visualized for example by presenting confidence limits and by depicting casuistic illustrations. Although the sample size is rather small, the level of agreement between the raters is nevertheless high. The obtained results demonstrate a negligible influence of raters’ experience level and research site; however, since the sample size was comparatively small, further studies will be needed to confirm the results and to specifically investigate the non-inferiority of one scanner type with a study design tailored to this specific question.
In conclusion, the observed high intra- and inter-rater reliability as demonstrated by high ICC values shows that volumetric flow rates of blood and CSF can be quantified reliably across centers and users’ skill levels. The second important observation indicates that secondary parameters, which are derived from these measures, can also be assessed reliably. The demonstrated reliability of the phase contrast based flow measurements underscores the robustness of the method.
Acknowledgments
Financial support
We gratefully acknowledge the support of the Deutscher Akademischer Austauschdienst (IK), the Else Kröner-Fresenius-Stiftung (IK), and the National Institutes of Health (1R41NS046185-01A1 to NA). This study was part of the doctoral thesis of Andreas Pomschar.
Footnotes
Financial disclosure
NA is stockholder of Alperin Noninvasive Diagnostics, Inc.
REFERENCES
- 1.Ertl-Wagner BB, Blume JD, Peck D, et al. Reliability of tumor volume estimation from MR images in patients with malignant glioma. Results from the American College of Radiology Imaging Network (ACRIN) 6662 Trial. Eur Radiol. 2009 Mar;19(3):599–609. doi: 10.1007/s00330-008-1191-7. [DOI] [PMC free article] [PubMed] [Google Scholar]
- 2.Hricak H, Gatsonis C, Coakley FV, et al. Early invasive cervical cancer: CT and MR imaging in preoperative evaluation - ACRIN/GOG comparative study of diagnostic performance and interobserver variability. Radiology. 2007 Nov;245(2):491–498. doi: 10.1148/radiol.2452061983. [DOI] [PubMed] [Google Scholar]
- 3.Cheng VY, Nakazato R, Dey D, et al. Reproducibility of coronary artery plaque volume and composition quantification by 64-detector row coronary computed tomographic angiography: an intraobserver, interobserver, and interscan variability study. J Cardiovasc Comput Tomogr. 2009 Sep-Oct;3(5):312–320. doi: 10.1016/j.jcct.2009.07.001. [DOI] [PubMed] [Google Scholar]
- 4.Hoffmann H, Frieler K, Hamm B, Dewey M. Intra- and interobserver variability in detection and assessment of calcified and noncalcified coronary artery plaques using 64-slice computed tomography: variability in coronary plaque measurement using MSCT. Int J Cardiovasc Imaging. 2008 Oct;24(7):735–742. doi: 10.1007/s10554-008-9299-z. [DOI] [PubMed] [Google Scholar]
- 5.Hadjiiski L, Mukherji SK, Ibrahim M, et al. Head and neck cancers on CT: preliminary study of treatment response assessment based on computerized volume analysis. AJR Am J Roentgenol. 2010 Apr;194(4):1083–1089. doi: 10.2214/AJR.09.2817. [DOI] [PMC free article] [PubMed] [Google Scholar]
- 6.Lee VS, Spritzer CE, Carroll BA, et al. Flow quantification using fast cine phase-contrast MR imaging, conventional cine phase-contrast MR imaging, and Doppler sonography: in vitro and in vivo validation. AJR Am J Roentgenol. 1997 Oct;169(4):1125–1131. doi: 10.2214/ajr.169.4.9308476. [DOI] [PubMed] [Google Scholar]
- 7.Spilt A, Box FM, van der Geest RJ, et al. Reproducibility of total cerebral blood flow measurements using phase contrast magnetic resonance imaging. J Magn Reson Imaging. 2002 Jul;16(1):1–5. doi: 10.1002/jmri.10133. [DOI] [PubMed] [Google Scholar]
- 8.Bakker CJ, Hartkamp MJ, Mali WP. Measuring blood flow by nontriggered 2D phase-contrast MR angiography. Magn Reson Imaging. 1996;14(6):609–614. doi: 10.1016/0730-725x(96)00092-6. [DOI] [PubMed] [Google Scholar]
- 9.Bakker CJ, Kouwenhoven M, Hartkamp MJ, Hoogeveen RM, Mali WP. Accuracy and precision of time-averaged flow as measured by nontriggered 2D phase-contrast MR angiography, a phantom evaluation. Magn Reson Imaging. 1995;13(7):959–965. doi: 10.1016/0730-725x(95)02005-e. [DOI] [PubMed] [Google Scholar]
- 10.Tarnawski M, Padayachee S, West DJ, et al. The measurement of time-averaged flow by magnetic resonance imaging using continuous acquisition in the carotid arteries and its comparison with Doppler ultrasound. Clin Phys Physiol Meas. 1990 Feb;11(1):27–36. doi: 10.1088/0143-0815/11/1/002. [DOI] [PubMed] [Google Scholar]
- 11.van der Geest RJ, Niezen RA, van der Wall EE, de Roos A, Reiber JH. Automated measurement of volume flow in the ascending aorta using MR velocity maps: evaluation of inter- and intraobserver variability in healthy volunteers. J Comput Assist Tomogr. 1998 Nov-Dec;22(6):904–911. doi: 10.1097/00004728-199811000-00013. [DOI] [PubMed] [Google Scholar]
- 12.van der Geest RJ, Reiber JH. Quantification in cardiac MRI. J Magn Reson Imaging. 1999 Nov;10(5):602–608. doi: 10.1002/(sici)1522-2586(199911)10:5<602::aid-jmri3>3.0.co;2-c. [DOI] [PubMed] [Google Scholar]
- 13.Huang TY, Chung HW, Chen MY, et al. Supratentorial cerebrospinal fluid production rate in healthy adults: quantification with two-dimensional cine phase-contrast MR imaging with high temporal and spatial resolution. Radiology. 2004 Nov;233(2):603–608. doi: 10.1148/radiol.2332030884. [DOI] [PubMed] [Google Scholar]
- 14.Glick RP, Niebruegge J, Lee SH, Egibor O, Lichtor T, Alperin N. Early experience from the application of a noninvasive magnetic resonance imaging-based measurement of intracranial pressure in hydrocephalus. Neurosurgery. 2006 Nov;59(5):1052–1060. doi: 10.1227/01.NEU.0000245586.23710.EF. discussion 60-61. [DOI] [PubMed] [Google Scholar]
- 15.Miyati T, Mase M, Kasai H, et al. Noninvasive MRI assessment of intracranial compliance in idiopathic normal pressure hydrocephalus. J Magn Reson Imaging. 2007 Aug;26(2):274–278. doi: 10.1002/jmri.20999. [DOI] [PubMed] [Google Scholar]
- 16.Sivaramakrishnan A, Alperin N, Surapaneni S, Lichtor T. Evaluating the effect of decompression surgery on cerebrospinal fluid flow and intracranial compliance in patients with chiari malformation with magnetic resonance imaging flow studies. Neurosurgery. 2004 Dec;55(6):1344–1350. doi: 10.1227/01.neu.0000143612.60114.2d. discussion 50-51. [DOI] [PubMed] [Google Scholar]
- 17.Alperin N, Sivaramakrishnan A, Lichtor T. Magnetic resonance imaging-based measurements of cerebrospinal fluid and blood flow as indicators of intracranial compliance in patients with Chiari malformation. J Neurosurg. 2005 Jul;103(1):46–52. doi: 10.3171/jns.2005.103.1.0046. [DOI] [PubMed] [Google Scholar]
- 18.Alperin N, Lee SH. PUBS: pulsatility-based segmentation of lumens conducting non-steady flow. Magn Reson Med. 2003 May;49(5):934–944. doi: 10.1002/mrm.10455. [DOI] [PubMed] [Google Scholar]
- 19.Alperin NJ, Lee SH, Loth F, Raksin PB, Lichtor T. MR-Intracranial pressure (ICP): a method to measure intracranial elastance and pressure noninvasively by means of MR imaging: baboon and human study. Radiology. 2000 Dec;217(3):877–885. doi: 10.1148/radiology.217.3.r00dc42877. [DOI] [PubMed] [Google Scholar]
- 20.Tain RW, Ertl-Wagner B, Alperin N. Influence of the compliance of the neck arteries and veins on the measurement of intracranial volume change by phase-contrast MRI. J Magn Reson Imaging. 2009 Oct;30(4):878–883. doi: 10.1002/jmri.21925. [DOI] [PMC free article] [PubMed] [Google Scholar]
- 21.Shrout PE, Fleiss JL. Intraclass correlations: uses in assessing rater reliability. Psychol Bull. 1979 Mar;86(2):420–428. doi: 10.1037//0033-2909.86.2.420. [DOI] [PubMed] [Google Scholar]
- 22.Eliasziw M, Young SL, Woodbury MG, Fryday-Field K. Statistical methodology for the concurrent assessment of interrater and intrarater reliability: using goniometric measurements as an example. Phys Ther. 1994 Aug;74(8):777–788. doi: 10.1093/ptj/74.8.777. [DOI] [PubMed] [Google Scholar]
- 23.Wåhlin A, Ambarki K, Hauksson J, Birgander R, Malm J, Eklund A. Phase contrast MRI quantification of pulsatile volumes of brain arteries, veins, and cerebrospinal fluids compartments: repeatability and physiological interactions. J Magn Reson Imaging. 2012 May;35(5):1055–1062. doi: 10.1002/jmri.23527. Epub 2011 Dec 14. [DOI] [PubMed] [Google Scholar]


