

Abstract
MiR-100 and miR-125b are lost in many cancers and have potential function as tumor suppressors. Using both primary prostatic epithelial cultures and laser-capture-microdissected prostate epithelium from 45 patients enrolled in a vitamin D3 randomized trial, we identified miR-100 and -125b as targets of 1,25-dihydroxyvitamin D3 (1,25D). In patients, miR-100 and -125b levels were significantly lower in tumor tissue than in benign prostate. Similarly, miR-100 and -125b were lower in primary PCa cells than in cells derived from benign prostate. Prostatic concentrations of 1,25D positively correlated with these miRNA levels in both PCa and benign epithelium, demonstrating that PCa patients may still benefit from vitamin D3. In cell assays, upregulation of these miRNAs by 1,25D was vitamin D receptor-dependent. Transfection of pre-miR-100 and pre-miR-125b in the presence or absence of 1,25D decreased invasiveness of cancer cell, RWPE-2. Pre-miR-100 and pre-miR-125b decreased proliferation in primary cells and cancer cells respectively. Pre-miR-125b transfection suppressed migration and clonal growth of PCa cells while knockdown of miR-125b in normal cells increased migration indicates a tumor suppressor function. 1,25D suppressed expression of previously bona fide mRNA targets of these miRNAs, E2F3 and Plk1, in a miRNA-dependent manner. Together, these findings demonstrate that vitamin D3 supplementation augments tumor suppressive miRNAs in patient prostate tissue, providing evidence that miRNAs could be key physiologic mediators of vitamin D3 activity in prevention and early treatment of PCa.
INTRODUCTION
In the past decade new research has revealed health benefits of vitamin D that extend beyond its role in calcium homeostasis. Preclinical, epidemiological and clinical studies show that maintaining vitamin D status has potential benefits for several conditions including cancer, diabetes, multiple sclerosis, infection, depression, pain, and cardiovascular diseases (1). Recent reports show widespread deficiency of vitamin D in adults (2). In prostate cancer (PCa), the same factors that associate with deficient vitamin D levels (age, African American ethnicity, and residence at northern latitudes) also associate with increased PCa risk (3); suggesting vitamin D status alters PCa risk. The slow growing nature of PCa provides a long window of opportunity for chemopreventive agents, such as vitamin D (4). Please note that we use “vitamin D” in general discussion, whereas the specific form of vitamin D3/metabolites will be used when describing specific results or experiments.
Several decades of studies support a chemopreventive role for vitamin D in PCa. A recent report showed that men supplemented with 4,000 IU/day vitamin D3 for one year had a decrease in positive cores at repeat biopsy compared to a control population (5). In PCa cell culture and in vivo studies, 1,25-dihydroxyvitamin D3 (1,25D) regulates proliferation (6), apoptosis (7), inflammation (8) and differentiation (8) through binding to the vitamin D receptor (VDR), a transcription factor (9, 10). In PCa tissues, high tumor VDR protein was correlated with low PSA, Gleason, and less advanced tumor stage (11). The Giovannucci group recently reported that men in the highest quartile of serum 25-hydroxyvitamin D3 (25D) had a 57% decrease in risk of lethal PCa (12) which is consistent with other studies showing that high serum 25D levels were associated with decreased PCa incidence and mortality (3, 13). However, epidemiological studies do not consistently find association between vitamin D status and PCa risk (14–17). 25D is the major circulating metabolite of vitamin D and precursor to the active 1,25D. The prostate expresses the VDR protein (18) and CYP27B1, the enzyme which converts 25D into 1,25D (19), demonstrating that local production of 1,25D occurs in the prostate. Therefore, local prostatic levels of 1,25D may be an important factor in determination of vitamin D status and PCa risk.
Given the genomic activity of vitamin D, via VDR binding to DNA and regulating gene transcription, it is likely that both coding genes and non-coding RNAs are regulated by vitamin D. MicroRNAs (miRNAs) are small (~22 nucleotide) non-coding RNAs that canonically function via binding to the 3' untranslated region of target mRNA resulting in mRNA degradation and/or translational repression (20, 21). Aberrant expression of miRNAs is observed in human cancer tissues/cells and may promote carcinogenesis and progression (22–26). MiRNA signatures unique to PCa have been identified (22–25) and various oncomiR and tumor suppressive miRNAs characterized. One recent study examined miRNAs regulated by 1,25D with testosterone in LNCaP cells (27). To date no studies have investigated miRNAs regulated by vitamin D or vitamin D metabolites in human primary prostatic epithelial cells or in prostate cancer patients.
In the current study, we identified and characterized miRNAs that are regulated by vitamin D. MiRNA expression was profiled in normal human prostatic epithelial cells that were treated with a non-growth inhibitory dose of 1,25D. Candidate miRNAs were validated in laser-capture microdissected epithelium from patient prostate tissue from a clinical trial in which the men were given various doses of vitamin D3 prior to radical prostatectomy. Targets of validated miRNAs and their effects on cell phenotype were further characterized in vitro. This translational study found that the chemopreventive activity of vitamin D in the prostate involves up-regulation of tumor suppressor miRNAs.
MATERIALS AND METHODS
Cell cultures
As described previously (28), primary prostatic epithelial cells (PrE) were established from radical prostatectomy tissue at the University of Illinois at Chicago Medical Center. Fresh tissue from the peripheral zone was selected by a pathologist according to an IRB-approved protocol. Briefly, the tissue was digested in collagenase, and plated on collagen-coated dishes in PrEGM media (Lonza, Walkersville, MD) for epithelial cell outgrowth. Epithelial cells are abbreviated PrE cells (from benign prostate peripheral zone) or PrE-Ca (from an area of >80% cancer). The PrE cells were authenticated after primary culture via gene expression known basal epithelial cells markers, cytokeratin 5 and p63 and lack of AR. All cells were used at secondary passage and ~70 % confluency (cell density). LNCaP, DU145, and PC3 cell lines (obtained directly from American Type Culture Collection, Manassas VA, USA) at various times since 2006 and frozen into multiple aliquots) are grown in RPMI Media (Life Technologies, Grand Island, NY) /10% fetal bovine serum. RWPE-1 (normal)/RWPE-2 (cancer) cells (cell stocks were obtained from Dr. Mukta Webber (29), via Dr. Michael Waalkes) were grown in KSFM Media (Life Technologies). 1,25D was dosed at 50 nM unless otherwise noted.
Clinical Samples
Paraffin blocks of prostatectomy specimens from 45 patients in the clinical trial were used. In this trial 66 patients (age 42–67) were randomized into three dose groups of vitamin D3 (cholecalciferol); 400, 10,000 or 40,000 IU/day given orally in the time interval between randomization and prostatectomy (3–8 weeks). The trial was registered with www.clinicaltrials.gov (NCT00741364). The specimens were obtained from Dr. T. van der Kwast (University Health Network, Toronto, Canada) who, blinded by treatment group, demarcated benign and PCa areas for laser-capture microdissection. Benign: glands in the peripheral zone without signs of atrophy or inflammation and without high grade PIN. PCa: highest density of Gleason grade 3 glands.
Laser Capture Microdissection (LCM)
Two 8 micron FFPE sections of each patient prostatectomy specimen were mounted on RNase-free PEN slides (Leica, Buffalo Grove, IL). As previously described by our group (30), specimens were deparaffinized, fixed, and stained with 0.5% toluidine blue. Using the Leica LMD-6000 (Leica) 100–150 acini of benign and PCa epithelium were collected into Eppendorf caps containing digestion buffer (Life Technologies).
RNA isolation
For cell cultures, total RNA was isolated with Trizol (Life Technologies). For patient tissue samples, RNA was extracted with the RecoverAll kit using a modified protocol as previously described (30). RNA quality and quantity were evaluated by measuring absorbance at 260 and 280 nm using a NanoDrop ND-1000 spectrophotometer (NanoDrop Technologies, Wilmington, DE).
qRT-PCR of prostate cells and clinical samples
Cells
For miRNA analysis, stem-loop cDNAs were generated on 10 ng of RNA using a pool of 5X RT primers and the TaqMan® MicroRNA RT Kit (Applied Biosystems, Foster City, CA) or on 20 ng of RNA using LNA™ PCR primers sets and the miRCURY LNA™ Universal RT kit (Exiqon, Woburn, MA). For mRNA analysis, cDNA was generated from 500 ng of RNA with the High Capacity Kit (Applied Biosystems). qRT-PCR was run with either SYBR green or TaqMan Gene Expression master mix (miRNA) (Applied Biosystems) using the StepOne Plus or HT7900 machines (Applied Biosystems). Ct values were normalized to housekeeping genes TBP and/or B2M for mRNA and RNU44 and/or RNU48 for miRNA.
Tissue
For miRNA analysis 45 ng of RNA was used with Megaplex Pool A RT Primers and the TaqMan miRNA RT kit. For mRNAs, RNA (50ng) was reverse-transcribed using the Vilo cDNA Kit (Invitrogen, Carlsbad, CA). cDNAs were pre-amplified according to the manufacturer's protocol using TaqMan PreAmp master mix and specific TaqMan-designed assays (Table S1). For miRNAs, the Megaplex Pool A Pre-Amp primers were used in the preamplification reaction. Fold-changes were calculated using 2−ΔΔCT method and normalized to the expression of RNU44 and RNU48 or mRNA housekeeping genes (B2M, HPRT, Actin, GAPDH, and/or CK18).
Vitamin D metabolite measurement in serum and prostate tissue
Serum and tissue 25D levels were measured by liquid chromatography-tandem mass spectrometry as described previously (31). Serum and tissue 1,25D levels were determined by enzyme immunoassay (EIA) (Immunodiagnostic Systems, Scottsdale, AZ). In tissues, vitamin D metabolite concentrations were measured by an initial pre-extracted procedure as previously described (31). Tissue vitamin D metabolites were reported as the mean of two samples (transitional and peripheral zone) of fresh frozen tissue. Full statistical analysis of serum and tissue levels of vitamin D metabolites are reported elsewhere (32).
miRNA profiling by TaqMan Low Density Array (TLDA)
PrE cells (70% confluency) were treated with 1,25D or ethanol for 24H and RNA was extracted. Megaplex pool of RT primers (Applied Biosystems) specific to either TLDA plate A/B and 350 ng RNA was used for the cDNA reaction and PCR was run according to the manufacturer's protocol. Results were analyzed with RQ Manager, Data Assist Software (Applied Biosystems), and manual 2−ΔΔCT method. Cts> 33 were omitted and RNU44 and RNU48 were analyzed as endogenous controls.
Pre-miR/Anti-miR/siRNA transfection
PrE or LNCaP cells were transfected using NeoFx reverse transfection kit (Ambion, Austin, TX) with a hsa-pre-miR, hsa-anti-miR to miR-100 or miR-125b (Applied Biosystems) or siRNA-VDR or negative siRNA (Santa Cruz Biotechnology, Santa Cruz, CA) at a final concentration of 5–50 nM.
Cell proliferation Assay
PrE cells were transfected with a hsa-pre-miR or with hsa-anti-miR at a final concentration 10 nM and plated in triplicate in a 24-well plate at a density of 2.5× 10⁴ cells per well. 24H after transfection, cells were treated in the presence or absence of 1,25D and allowed to grow for another for 48H. Cell number was counted with the Cellometer Auto T4 (Nexcelom Bioscience, Lawrence, MA).
Migration (scratch) assay
PrE cells (3.5 × 10⁵) were scratched 24H after transfection with 50 nM hsa-pre-miR. Pictures were taken at times 0–24H using the EVOS Digital Microscope (Advanced Microscopy Group, Bothell, WA). Migration was analyzed by percent open of the area of the scratch with Image J software.
Clonogenic assay
LNCaP cells were transfected in triplicate with 50 nM hsa-pre-miR at a density of 500 cells/60mm dish. After 10 days, the colonies were stained with 0.5% crystal violet and counted.
Invasion assay
RWPE-2 cells were transfected with hsa-pre-miRs (50nM). 24H following transfection, cells were counted and plated on matrigel-coated 8-μM-diameter pore inserts (BD Biosciences, San Jose, CA) in media containing ethanol or 1,25D (50 nM). 10% Fetal bovine serum was added to the lower chamber as a chemoattractant. After 48H, non-invaded cells were removed and invasive cells on the underside of the insert were fixed and stained with 0.5% crystal violet. Four fields per insert were photographed and counted at 20X.
Immunoblot
Proteins were isolated in Cell Lysis buffer (Cell Signaling, Danvers, MA) followed by centrifugation. Protein (10μg) was loaded onto a 10% Bis-Tris NuPAGE gel (Life Technologies) and transferred to PVDF membrane. The membranes were probed with anti-VDR 1:500 (Santa Cruz Biotechnology), anti-β-tubulin 1:1000, anti-actin 1:1000, anti-PLK1 1:500 (Cell Signaling), or anti-E2F3 1:1000 (AbCam, Cambridge, MA). Bands were visualized using LumiGLO reagent (Cell Signaling).
Statistical analysis
Unsupervised hierarchical clustering was done with DataAssist 3.0 (Applied Biosystems). For in vitro experiments the difference between two groups was analyzed with student's t-test. In patient samples the correlation between miRNA and vitamin D metabolites was determined by Spearman correlation. A paired samples t-test was used to analyze differences in paired benign and PCa tissues. ANOVA analyzed the difference between vitamin D3 treatment groups. Differences were considered significant at p<0.01 and p<0.05.
RESULTS
1,25D alters miRNA expression profiles in primary human epithelial cells
MiRNA expression was analyzed in PrE cells after 24H of 50 nM 1,25D or vehicle (0.01% ethanol) treatment. To control for cell density-induced changes in miRNAs (33), PrE cells were treated at 70% confluency with a non-growth inhibitory dose of 1,25D (Figure S1). Expression of 667 miRNAs was profiled by miRNA TLDA in five different patient-derived primary PrE cells. Of the miRNAs profiled, approximately 30% of miRNAs on Array A and 15% on Array B were detected (CT <33) in PrE cells (Table S2). Up- or down-regulated miRNAs were identified by a >1.5-fold increase or <0.5 decreased and a significance of p<0.05 across three patients. Paired t-test identified miR-100, miR-125b and 29 other miRNAs that were increased by 1,25D and only one down-regulated miRNA, miR-196b (Table S3).
MiRNAs were selected for validation by magnitude of change and relevance to cancer/PCa from published studies (22–24, 26). MiR-100, miR-125b, miR-200c, miR-197, miR-196b, miR-106b, miR-141, miR-103, miR-146a, miR-301a, miR-331-3p, and let-7b were analyzed by individual PCR in three of the original PrE cells and three additional PrE cells. Unsupervised hierarchical clustering of the three patients showed that intra-patient miRNA expression for these miRNAs was more similar than 1,25D-induced expression changes (Figure 1A). However, all 12 miRNAs were significantly regulated by 1,25D in the three original PrE cell lines in the TLDA array (Table S3). Of the 12 miRNAs analyzed, individual qRT-PCR validation confirmed that miR-100 and miR-125b were the most consistently and significantly up-regulated by 1,25D (1.5–2.5 fold) across the six total PrE cells (Figure 1B). Further validation of miR-100 and miR-125b in other prostate cells lines RWPE-1, RWPE-2 (Figure 1B), and the commercially available PrEC cells (Figure S2) demonstrated similar 1,25D-mediated changes in the miRNAs. In contract, no significant regulation was observed in LNCaP (Figure 1B), DU145 and PC3 cells (Figure S2).
Figure 1.
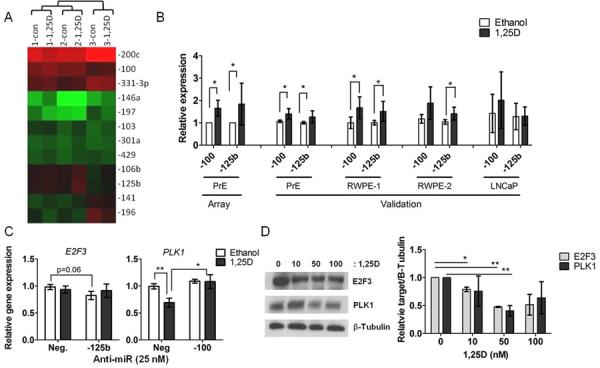
miRNAs regulated by 1,25D in prostate cells. A, Unsupervised hierarchical clustering of the top 12 miRNAs altered by 1,25D in three PrE cells. Mean levels of miR-100 and miR-125b expression, B, by TLDA array analysis in three PrE cells and by individual qRT-PCR in six PrE cells and in RWPE-1, RWPE-2, and LNCaP cells (n=3/cell line) treated with 50 nM 1,25D for 24H. Expression normalized to RNU44/RNU48. C, E2F3 and PLK1 mRNA expression by qRT-PCR in PrE cells 24H after transfection with anti-miRs (25nM) and 24 H treatment with ethanol or 1,25D (n=5). D, E2F3 and PLK1 protein measurement by immunoblot in PrE cells treated for 24H with 10–100 nM 1,25D (n=3). All data are shown as mean ± SEM. * p< 0.05; ** p< 0.01.
Suppression of miR-100 and miR-125b targets by 1,25D
MiR-100 and miR-125b were further characterized, as they have known tumor suppressor activity (34, 35) and are located on the same chromosomal region 11q13 (36). We examined functional activity of miR-100 and miR-125b by measuring previously bona fide mRNA targets of the miRNAs; Plk1 for miR-100 and E2F3 for miR-125b (37, 38). MiR-125b was inversely correlated with its target E2F3 (r= −0.52, p= 0.03) and miR-100 to its target PLK1 (r= −0.5, p=0.04) in 1,25D-treated PrE cells from nine patients, supporting regulation of these genes by the miRs by 1,25D (Figure S3). Transfection with anti-miR-100 or miR-125b in PrE cells showed that miR-100 abrogated regulation of PLK1 by 1,25D, demonstrating that the miRNAs are required for its target regulation by 1,25D (Figure 1C). 1,25D also dose dependently decreased E2F3 and PLK1 protein levels in PrE cells (Figure 1D).
MiR-100, miR-125b, E2F3 and PLK1 are differentially expressed in PCa cells
We examined miR-100 and miR-125b expression in a matched pair of PrE and PrE-Ca cells that were derived from the same patient and in the prostate cell line RWPE. The PrE-Ca cells [AMACR positive (Figure 2A)], had lower miR-125b and higher E2F3 in basal conditions compared to the normal PrE cells (Figure 2B). We did not observe a reduction in basal levels of miR-100 however its target Plk1 was increased in PrE-Ca cells compared to normal cells (Figure 2C). 1,25D treatment increased miR-100 and miR-125b and decreased their targets in both the normal PrE cells and PrE-Ca cells compared to their control further suggesting that 1,25D augments these miRNAs in normal and PCa cells (Figure 2B,C). 1,25D also inversely regulated the miRNAs and their targets in the RWPE cells, but there was no significant differences in the response between the RWPE 1(normal) and RWPE-2 (cancer) cells (Figure S4). Overall these data suggest that miR-100 and miR-125b levels are lower in PCa and their suppression inversely correlates with PLK1 and E2F3 in PrE cells.
Figure 2.
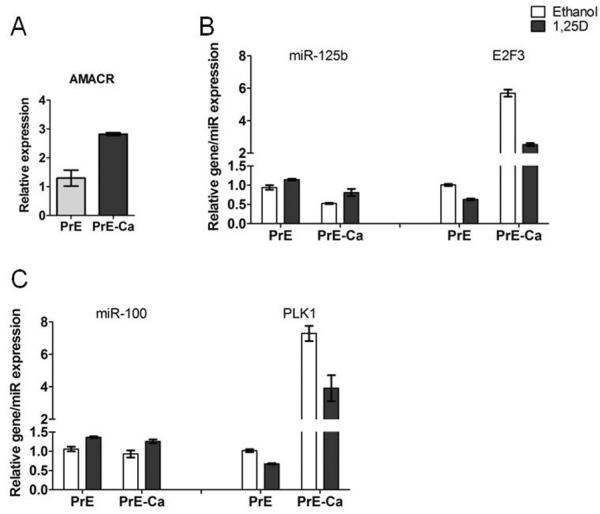
Differential expression of miR-100, miR-125b and their targets in 1,25D-treated PrE cells. qRT-PCR shows the expression of AMACR, A, miR-125b and E2F3, B, miR-100 and PLK1, C, in 1,25D-treated paired PrE and PrE-Ca cells derived from one patient. Error bars=SD of experimental replicates and experiments were repeated twice.
MiR-100 and -125b suppress cancer-associated phenotypes
In vitro phenotypes consistent with tumor suppressive functions of miR-100 and miR-125b (34, 39) were investigated by analysis of invasion, cell growth, migration, and clonogenicity, following modulation of miR-100 and miR-125b levels in RWPE-2, PrE and LNCaP cells. In RWPE-2 cells pre-mir-125b significantly reduced invasion through matrigel and 1,25D further reduced invasiveness of the pre-mir-100 and pre-mir-125b transfected cells (Figure 3A). Cell proliferation was quantified in PrE, RWPE-2 and LNCaP cells 72H after transfection with pre-miRs or anti-miRs. Pre-mir-100 significantly reduced growth of PrE cells compared to control while pre-miR-125b decreased growth in LNCaP and RWPE-2 cancer cells (Figure 3B). Anti-miR-100 transfection in PrE cells in the presence or absence of 1,25D resulted in a small but significant 7% increase in growth (Table S4). Pre-miR-100 and pre-miR-125b in RWPE-2 cells showed a 8% and 24% decrease in growth respectively and miR-125b decreased growth of LNCaP 16% (ethanol) and 18 % (1,25D-treated) (Table S4). In addition, in LNCaP cells, pre-miR-125b decreased colony formation compared to the control (Figure 3C) supporting tumor suppressive activity of miR-125b as clonogenicity correlates with tumorgenicity in animals (40). Cell migration by scratch assay showed that pre-miR-125b decreased migration (more open) of RWPE-2 (Figure 3D) and PrE cells (Figure S5). Anti-miR transfection of the miRNAs in the presence or absence of 1,25D demonstrated an increase in closure (less open) in 1,25D-treated of PrE cells at 24 H. Modulating miRNA levels in LNCaPs did not demonstrate any changes in migration (Figure 3D). These data indicate that miR-100 and miR-125b have cell-specific anti-migratory, anti-proliferative, and/or anti-colonogenic properties in normal and cancerous prostate cells, which is consistent with tumor suppressor actions.
Figure 3.
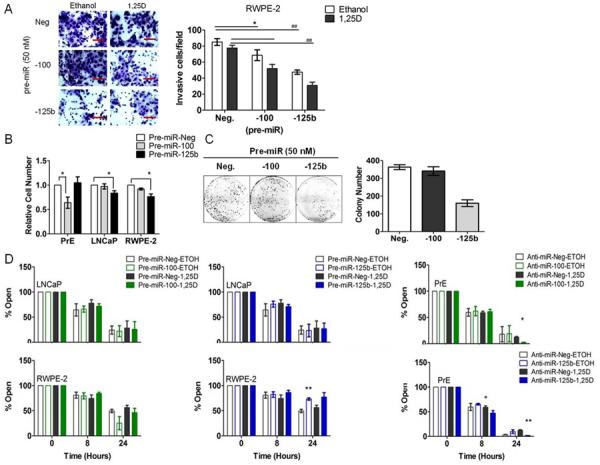
Functional effects of miR-100 and miR-125b in RWPE-2, PrE and LNCaP cells. A, RWPE-2 cells were transfected with 50 nM pre-miR (negative, −100, and −125b) and transwell invasion assay was preformed for 48H in the presence or absence of 1,25D. Invasive cells/field is shown. Magnification for identification of invasion is 20×. B, Cell proliferation in PrE (n=4), LNCaP (n=4) and RWPE-2 cells (n=3) 72H following transfection with pre-miR-negative, −100, or −125b. Error bars = SEM * p< 0.05. C, colony formation assay of LNCaP cells transfected with pre-miRNAs (50 nM). Mean of experimental triplicates, error bars = SD. D, migration of LNCaP, RWPE-2 and PrE cells 0–24H after scratch. PrE cells were transfected with anti-miRs and LNCaP and RWPE-2 cells with pre-miRs 24H prior to scratch (n=3/cell line). Error bars = SEM, * p< 0.05; ** p< 0.01 vs. corresponding (ethanol or 1,25D) negative.
Regulation of miR-100 and miR-125b and their targets by 1,25D is VDR-dependent
VDR expression was analyzed in PrE, LNCaP and RWPE cells. Primary PrE and RWPE cells had comparable basal levels of VDR expression (Figure S6). Knockdown of VDR in PrE cells by siRNA reduced VDR protein levels ~50% which was sufficient to blunt VDR activity as demonstrated by reduced VDR-responsive CYP24A1 expression (Figure 4A, B). The reduction in VDR abrogated up-regulation of miR-100 and miR-125b by 1,25D. VDR knockdown with siRNA also confirmed that regulation of E2F3 and PLK1 expression were VDR-dependent (Figure 4C). These results demonstrate that up-regulation of miR-100 and miR-125 and down-regulation of their targets E2F3 and PLK1 by 1,25D occurs in a VDR-dependent manner.
Figure 4.
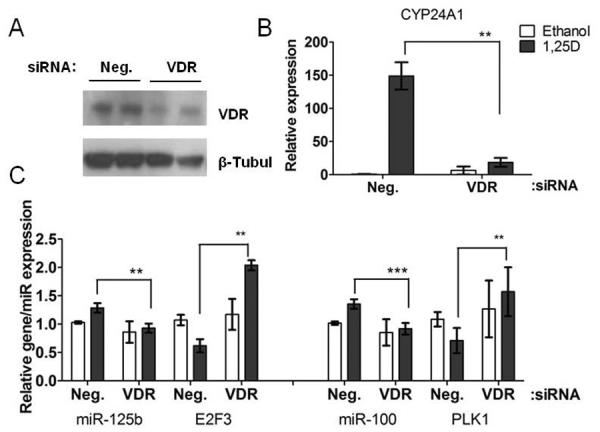
Up-regulation of miR-100 and miR-125b and their targets by 1,25D is VDR-dependent in PrE cells. A, VDR protein levels examined by immunoblot 48H after transfection with 20 nM negative or VDR siRNA and 24H treatment with 1,25D in PrE cells. B, CYP24A1 (n=3), C, miR-125b (n=4)/E2F3 (n=2) and PLK1 (n=4)/miR-100 (n=2), expression by qRT-PCR. All data are shown as mean ± SEM of experimental duplicates. ** p< 0.01; *** p< 0.001.
MiR-100, miR-125b, E2F3 and PLK1 are differentially expressed in tissue
The in vitro findings were validated in prostate tissue from a Phase II clinical trial of vitamin D3 in PCa patients. This trial was run at the University Health Network and Sunnybrook Hospital (Toronto, Ontario, Canada). Patients (N=66) were randomized to three treatment groups; 1=400 IU/day, 2=10,000 IU/day, 3=40,000 IU/day of oral vitamin D3 (cholecalciferol) for 3–8 weeks prior to surgery (PI: Reinhold Vieth). Tumor and benign prostate epithelium from 15 patients per treatment group was collected by LCM (Figure 5A) and the expression of 12 miRNAs (miR-100, miR-125b, miR-103, miR-331-3p, miR-146a, miR-155, miR-197, miR-106b, miR-141, miR-301a, let-7a, and let-7b) was quantified by qRT-PCR. Areas of PCa were AMACR positive (Figure 5B) confirming that tumor was sampled. Both miR-100 and miR-125b were decreased in tumor compared to benign epithelium, p< 0.001 (Figure 5B). In addition, the other 9 miRNAs that we analyzed in patient tissue (miR-103, miR-331-3p, miR-146a, miR-155, miR-197, miR-106b, miR-141, miR-301a, let-7a and let-7b) were significantly lower in PCa tissue (Table S5). These results are consistent with previous findings that miR-100 and miR-125b are down-regulated in PCa (26). E2F3 and PLK1 expression were measured in a subset of the vitamin D3-treated clinical trial samples. E2F3 was slightly increased in PCa versus benign epithelium (p= 0.09) and PLK1 was unchanged (Figure 5C). Overall these data suggest that miR-100 and miR-125b levels are lower in PCa and suppression of miR-125b may upregulate E2F3.
Figure 5.

MiR-100 and miR-125b expression in prostate epithelium from men treated with vitamin D3. A, experimental flow chart for analysis. B, miR-100, miR-125b and AMACR expression by qRT-PCR in benign and PCa epithelium (N=42 patients). Error bars = SEM, ## p<0.001 or * p<0.05. C, E2F3 and PLK1 expression by qRT-PCR in benign and PCa (benign N=14, PCa N=16). D, miR-100 and miR-125b expression by qRT-PCR in benign and cancer epithelium across vitamin D3 treatment groups (400, 10,000, 40,000 IU/d). E, Spearman correlation between prostatic 1,25D concentration and miR-125b or miR-100 level in benign and PCa epithelium.
MiR-100 and miR-125b are upregulated by dietary vitamin D3 in clinical trial specimens
Wagner and colleagues found that serum and tissue from the high dose of vitamin D3, significantly increased 25D and 1,25D over baseline (32). The mean serum levels (±95% CI) of vitamin D metabolites for the 400, 10,000, and 40,000 IU/d, respectively were as follows: 1,25D (115±26.4, 136±20, 171±18.5 pmol/L); 25D (71±8.08, 122±14, 288±41.8 nmol/L). Mean tissue levels (±95% CI) of vitamin D metabolites for the 400, 10,000, and 40,000 IU/d respectively were as follows: 1,25D (29±6.8, 30±5.0, 40±8.5 pmol/kg); 25D (90±7.6, 117±12.2, 178±34.2 nmol/kg) (32). Analysis by group showed a trending increase in miRNA levels with vitamin D dose (Figure 5D). However, when analyzed irrespective of treatment groups, prostatic 1,25D concentrations (available post intervention only) positively correlated with miR-100 and miR-125b in both benign and PCa epithelium (Figure 5E, Table 1). miR-100 and miR-125b levels correlated with serum levels of 1,25D or 25D, but the results varied between benign and PCa tissue (Table 1). Six of the other 10 miRNAs analyzed (miR-106b, miR-141, miR-103, miR-331-3p, let-7a and let-7b) also positively correlated with prostatic 1,25D in either benign or PCa epithelium (Table S6). When correlating miRNA expression with the change in serum 1,2D and 25D levels from baseline, we also found positive correlations in benign or PCa epithelium. These results fully substantiate the in vitro data and demonstrate that miR-100 and miR-125b and other miRNAs are regulated by vitamin D3 in the prostate.
Table 1.
Correlations between miRNAs and vitamin D metabolites
| miRNA | Tissue | Serum | ||||||
|---|---|---|---|---|---|---|---|---|
| 1,25D | 25D | 1,25D | 25D | (VF-V1) 1,25D | (VF-V1) 25D | |||
| miR-100 | Benign | N | 34 | 36 | 36 | 42 | 36 | 43 |
| r † | 0.376 * | −0.081 | 0.400 * | 0.164 | 0.184 | 0.164 | ||
| p ‡ | 0.01 | 0.32 | 0.008 | 0.15 | 0.141 | 0.146 | ||
| PCa | N | 34 | 35 | 35 | 41 | 35 | 42 | |
| r | 0.364 * | 0.002 | 0.188 | 0.350 * | 0.125 | 0.287 * | ||
| p | 0.01 | 0.5 | 0.14 | 0.01 | 0.237 | 0.033 | ||
| miR-125b | Benign | N | 35 | 36 | 36 | 42 | 36 | 43 |
| r | 0.330 * | 0.025 | 0.334 * | 0.22 | 0.118 | 0.178 | ||
| p | 0.02 | 0.44 | 0.02 | 0.08 | 0.246 | 0.127 | ||
| PCa | N | 35 | 36 | 36 | 42 | 36 | 43 | |
| r | 0.325 * | 0.025 | 0.168 | 0.265 * | 0.153 | 0.201 | ||
| p | 0.03 | 0.44 | 0.16 | 0.04 | 0.187 | 0.098 | ||
spearman r
p value two-tailed, Gaussian approximation
p<0.05
In addition, the correlation between miRNA and target levels were measured in a subset of tissue (N=15) from the clinical trial, where we saw a trend toward PLK1 and E2F3 being correlated to their targets in normal and/or PCa [miR-125b (normal; r= −0.36, p= 0.09) (cancer; r= −0.30, p= 0.15); miR-100 (normal; r= −0.08, p= 0.40) (cancer; r= −0.35, p= 0.09)].
DISCUSSION
In this translational study we report miRNA regulation as a novel mechanism of vitamin D3 in the prostate. 1,25D in vitro and oral administration of vitamin D3 in patients upregulated miR-100 and miR-125b, known tumor suppressor miRNAs and two of the oldest known animal miRNAs (41).
The miRNAs in our study do not overlap with the few published reports that have examined regulation of miRNAs by vitamin D. In human myeloid leukemia, 1,25D increased miR-32 (42) and miR-181 (43) levels and altered differentiation and cell cycle respectively. Other studies examined the dual effects of 1,25D and stress (44) or testosterone (27) on miRNAs and identified miR-182, miR-22, 29ab, −134, 17, 20a as 1,25D-regulated miRNAs (27). MiR-22 expression was induced by 1,25D in colon cancer cells (45). 1,25D can have powerful growth inhibitory effects in vitro that are dependent upon dose and cell type. Growth inhibition in vitro may confound miRNAs studies because cell-cell contact at higher cell density causes a robust upregulation of miRNA expression globally (33). Cell density was carefully controlled in our study and we utilized non-growth inhibitory dose of 1,25D in PrE cells.
By using both in vitro and clinical approaches we were able to identify, validate and characterize miR-100 and miR-125b as targets of 1,25D in both cells and patient prostate tissue. Levels of miR-100, miR-125b and nine other miRNAs were suppressed in PCa tissue compared to benign tissue, which support previous studies that found widespread downregulation of miRNAs in PCa (26). The fact that dietary vitamin D3 correlated with the miRNAs in both benign and PCa tissue, and 1,25D upregulated the miRNAs in PrE-Ca cells, in the presence of a significant suppression of miRNA expression, implicates an overall benefit of vitamin D in benign and PCa tissue. We observed that serum 25D correlated with the miRNAs only in the PCa areas (Table S6), suggesting that cancerous tissue may respond to vitamin D3 supplementation faster than the benign areas.
MiR-100 and miR-125b have been shown to have both tumor suppressive and oncogenic properties depending on the cell type (22, 24, 34–36, 46, 47). In PCa, miR-100 levels are lower in tumor compared to normal tissue (34) and in the early stages of hepatocarcinoma suggesting involvement in carcinogenesis (47). miR-125b is hypermethylated in breast cancer (35), has decreased expression in hepatocellular cancer and suppresses malignant phenotypes in vitro and in xenografts (48). However, overexpression of miR-125b decreased anti-apoptotic proteins in PCa xenografts (49), high levels of miR-100 increased the risk of PCa reoccurrence (50) and miR-100 was oncogenic in acute myeloblastic leukemia (46). The seemingly discrepant roles for these miRNAs in cancer may be a result of specific model systems or overexpression methodologies. Our findings were consistent with tumor suppressor activities of miR-100 and 125b as that both miRNAs were significantly lower in PCa compared to benign epithelium and in vitro overexpression of the miRNAs decreased cancer-associated phenotypes.
There are several characterized targets for miR-100 and miR-125b, two of which we examined. Previously, others have validated the interaction between miR-100 and Plk1 and miR-125b and E2F3 with luciferase assays (37, 38). Consistent with these reports, we observed a negative correlation between miR-100 and Plk1 and between miR-125b and E2F3 in vitro. We speculate that due to the small N, the association between the miRNAs and their targets was weaker in patient samples. Plk1 and E2F3 are cell cycle proteins that are overexpressed in a variety of cancers including PCa (22, 37, 38, 47). Previous studies of E2F3 and PLK1 protein expression in PCa patient tissue arrays demonstrated a clear correlation between high nuclear expression of the E2F3 protein and poor overall survival (51) and a positive correlation between PLK1 and Gleason grade (52). In PCa, E2F3 positivity correlated with the Enhancer of Zeste Homolog gene 2 (EZH2), a well studied PCa marker and oncogene (53) indicating that E2F3-EZH2 contribute to PCa aggressiveness (51). In our study EZH2 expression, measured in a small subset of patients (N=20), was increased in PCa compared to benign tissue (p=0.05) (Figure S7), but was not correlated with 1,25D or 25D (data not shown).
Let-7a is located on chromosome 11q13 (36) adjacent to miR-100 and miR-125b-1. A recent systematic review identified let-7, miR-100 and miR-125 as three of the four most frequently selected miRNA classifiers of cancer patient outcome across 46 publications (54). In our study, let-7a was not regulated by 1,25D in our array therefore not included in the original validation. Because of its chromosomal location, we later quantified let-7a in a subset of tissues and found that let-7a was downregulated in PCa versus benign epithelium and also positively correlated with prostatic 1,25D in both benign (p=0.047) and PCa epithelium (p=0.033) (Figure S8). The let-7 family is well studied as tumor suppressive and let-7a suppressed PCa cell proliferation and tumor growth in vivo (55).
In the clinical trial samples, there was heterogeneity in prostatic 1,25D levels within each treatment group, as a result there were no significant differences in miRNA levels when analyzed by treatment group. The variation in prostatic 1,25D may be a result of inter-patient variability in calcium levels and/or vitamin D metabolism. Importantly, when we analyzed prostatic 1,25D concentration there was a strong correlation between prostatic 1,25D and miRNAs, which fully validated our in vitro findings.
There is a controversial epidemiological relationship between vitamin D status and PCa risk that has been based upon serum levels of 25D or 1,25D. While serum 25D measures overall vitamin D status, the results of the clinical trial suggest that although serum levels do correlate to tissue levels, there are patient-to-patient differences in prostate tissue levels of vitamin D within intervention groups (32). Similar to our miRNA findings, Wagner et al showed that Ki67 staining in the prostate was dependent on the prostatic 1,25D levels rather than the dose of the vitamin D3 intervention (32). Wagner et al also showed that PSA decreased in the 10,000IU/day and 40,000IU/day groups compared to the 400IU/day groups. Future studies of this nature are important in identifying if prostatic levels of vitamin D are correlative to PCa outcome and survival. In our data, miR-100 and miR-125b correlate better with prostatic 1,25D than to serum 1,25D or 25D or with the change in serum 1,2D and 25D levels from baseline and there was no correlation to tissue 25D. The positive correlation between the miRNAs and tissue 1,25D supports the hypothesis that local tissue levels of 1,25D are important in PCa pathogenesis, as prostate cells express CYP27B1, (19) locally producing 1,25D. Therefore, not only is there an effect of local prostatic 1,25D, but also measurement of prostatic 1,25D may be superior to serum in epidemiological studies on PCa prognosis.
We show that vitamin D regulates known tumor suppressive miRNAs, miR-100 and miR-125b in both PCa and benign prostate tissue cells and tissue. The tumor suppressive activities of these miRNAs support a chemopreventive role for vitamin D. Our data also indicate that vitamin D3 and 1,25D may upregulate miRNAs globally to counteract the downregulation of miRNAs observed in cancer. In addition, the fact that a seemingly short duration of treatment with vitamin D3 in PCa patients resulted in differences in the expression of these miRNAs suggests that further long-term studies with vitamin D3 could be useful in examining global regulation of miRNAs in prostate. It is crucial that future research determine the clinical importance of the regulation of miRNAs to determine if global changes alter cancer progression and/or outcome in PCa patients.
Supplementary Material
Acknowledgements
This research was supported by the NIH grant K22 CA133105 (Nonn), American Institute for Cancer Research Postdoctoral Scholar Grant (Giangreco), the Canadian Cancer Society (Vieth), and by a studentship from Canadian Institutes for Health Research (Wagner). We thank the prostate cancer patients who donated their tissue for primary cell cultures and who participated in the clinical trial, Dr. Leslie Deane for recruitment of UIC Urology patients for cell culture, Lindsay Gallagher for sectioning of the clinical trial specimens, Shweta Dambal for helping with RNA extraction and reverse transcription, Drs. Marcelo Bonini and Michael Waalkes for RWPE cells, Dr. Margaret Wright and Ryan Deaton for statistical assistance and Dr. Alan Diamond for proofreading of the manuscript.
Funding: NIH-K22 CA133105 (Nonn), AICR Postdoctoral Grant (Giangreco), Canadian Cancer Society (Vieth), Canadian Institutes for Health Research Studentship (Wagner).
Footnotes
The authors have no conflict of interest.
REFERENCES
- 1.Thacher TD, Clarke BL. Vitamin D insufficiency. Mayo Clin Proc. 2011;86:50–60. doi: 10.4065/mcp.2010.0567. [DOI] [PMC free article] [PubMed] [Google Scholar]
- 2.Ginde AA, Liu MC, Camargo CA., Jr Demographic differences and trends of vitamin D insufficiency in the US population, 1988–2004. Arch Intern Med. 2009;169:626–32. doi: 10.1001/archinternmed.2008.604. [DOI] [PMC free article] [PubMed] [Google Scholar]
- 3.Schwartz GG. Vitamin D and the epidemiology of prostate cancer. Semin Dial. 2005;18:276–89. doi: 10.1111/j.1525-139X.2005.18403.x. [DOI] [PubMed] [Google Scholar]
- 4.Crawford ED. Understanding the epidemiology, natural history, and key pathways involved in prostate cancer. Urology. 2009;73:S4–10. doi: 10.1016/j.urology.2009.03.001. [DOI] [PubMed] [Google Scholar]
- 5.Marshall DT, Savage SJ, Garrett-Mayer E, Keane TE, Hollis BW, Horst RL, et al. Vitamin D3 Supplementation at 4000 International Units Per Day for One Year Results in a Decrease of Positive Cores at Repeat Biopsy in Subjects with Low-Risk Prostate Cancer under Active Surveillance. J Clin Endocrinol Metab. doi: 10.1210/jc.2012-1451. [DOI] [PMC free article] [PubMed] [Google Scholar]
- 6.Getzenberg RH, Light BW, Lapco PE, Konety BR, Nangia AK, Acierno JS, et al. Vitamin D inhibition of prostate adenocarcinoma growth and metastasis in the Dunning rat prostate model system. Urology. 1997;50:999–1006. doi: 10.1016/S0090-4295(97)00408-1. [DOI] [PubMed] [Google Scholar]
- 7.Simboli-Campbell M, Narvaez CJ, Tenniswood M, Welsh J. 1,25-Dihydroxyvitamin D3 induces morphological and biochemical markers of apoptosis in MCF-7 breast cancer cells. J Steroid Biochem Mol Biol. 1996;58:367–76. doi: 10.1016/0960-0760(96)00055-6. [DOI] [PubMed] [Google Scholar]
- 8.Moreno J, Krishnan AV, Feldman D. Molecular mechanisms mediating the anti-proliferative effects of Vitamin D in prostate cancer. J Steroid Biochem Mol Biol. 2005;97:31–6. doi: 10.1016/j.jsbmb.2005.06.012. [DOI] [PubMed] [Google Scholar]
- 9.Guyton KZ, Kensler TW, Posner GH. Vitamin D and vitamin D analogs as cancer chemopreventive agents. Nutr Rev. 2003;61:227–38. doi: 10.1301/nr.2003.jul.227-238. [DOI] [PubMed] [Google Scholar]
- 10.Zanatta L, Zamoner A, Zanatta AP, Bouraima-Lelong H, Delalande C, Bois C, et al. Nongenomic and genomic effects of 1alpha,25(OH)(2) vitamin D(3) in rat testis. Life Sci. 2011 doi: 10.1016/j.lfs.2011.04.008. [DOI] [PubMed] [Google Scholar]
- 11.Hendrickson WK, Flavin R, Kasperzyk JL, Fiorentino M, Fang F, Lis R, et al. Vitamin D receptor protein expression in tumor tissue and prostate cancer progression. J Clin Oncol. 2011;29:2378–85. doi: 10.1200/JCO.2010.30.9880. [DOI] [PMC free article] [PubMed] [Google Scholar]
- 12.Shui IM, Mucci LA, Kraft P, Tamimi RM, Lindstrom S, Penney KL, et al. Vitamin D-Related Genetic Variation, Plasma Vitamin D, and Risk of Lethal Prostate Cancer: A Prospective Nested Case-Control Study. J Natl Cancer Inst. 2012 doi: 10.1093/jnci/djs189. [DOI] [PMC free article] [PubMed] [Google Scholar]
- 13.Garland CF, Garland FC. Do sunlight and vitamin D reduce the likelihood of colon cancer? Int J Epidemiol. 2006;35:217–20. doi: 10.1093/ije/dyi229. [DOI] [PubMed] [Google Scholar]
- 14.Beer TM, Javle MM, Ryan CW, Garzotto M, Lam GN, Wong A, et al. Phase I study of weekly DN-101, a new formulation of calcitriol, in patients with cancer. Cancer Chemother Pharmacol. 2007;59:581–7. doi: 10.1007/s00280-006-0299-1. [DOI] [PubMed] [Google Scholar]
- 15.Gandini S, Boniol M, Haukka J, Byrnes G, Cox B, Sneyd MJ, et al. Meta-analysis of observational studies of serum 25-hydroxyvitamin D levels and colorectal, breast and prostate cancer and colorectal adenoma. Int J Cancer. 2011;128:1414–24. doi: 10.1002/ijc.25439. [DOI] [PubMed] [Google Scholar]
- 16.Li H, Stampfer MJ, Hollis JB, Mucci LA, Gaziano JM, Hunter D, et al. A prospective study of plasma vitamin D metabolites, vitamin D receptor polymorphisms, and prostate cancer. PLoS Med. 2007;4:e103. doi: 10.1371/journal.pmed.0040103. [DOI] [PMC free article] [PubMed] [Google Scholar]
- 17.Ahonen MH, Tenkanen L, Teppo L, Hakama M, Tuohimaa P. Prostate cancer risk and prediagnostic serum 25-hydroxyvitamin D levels (Finland) Cancer Causes Control. 2000;11:847–52. doi: 10.1023/a:1008923802001. [DOI] [PubMed] [Google Scholar]
- 18.Krill D, DeFlavia P, Dhir R, Luo J, Becich MJ, Lehman E, et al. Expression patterns of vitamin D receptor in human prostate. J Cell Biochem. 2001;82:566–72. doi: 10.1002/jcb.1185. [DOI] [PubMed] [Google Scholar]
- 19.Barreto AM, Schwartz GG, Woodruff R, Cramer SD. 25-Hydroxyvitamin D3, the prohormone of 1,25-dihydroxyvitamin D3, inhibits the proliferation of primary prostatic epithelial cells. Cancer Epidemiol Biomarkers Prev. 2000;9:265–70. [PubMed] [Google Scholar]
- 20.Lee RC, Feinbaum RL, Ambros V. The C. elegans heterochronic gene lin-4 encodes small RNAs with antisense complementarity to lin-14. Cell. 1993;75:843–54. doi: 10.1016/0092-8674(93)90529-y. [DOI] [PubMed] [Google Scholar]
- 21.Mirnezami AH, Pickard K, Zhang L, Primrose JN, Packham G. MicroRNAs: key players in carcinogenesis and novel therapeutic targets. Eur J Surg Oncol. 2009;35:339–47. doi: 10.1016/j.ejso.2008.06.006. [DOI] [PubMed] [Google Scholar]
- 22.Ozen M, Creighton CJ, Ozdemir M, Ittmann M. Widespread deregulation of microRNA expression in human prostate cancer. Oncogene. 2008;27:1788–93. doi: 10.1038/sj.onc.1210809. [DOI] [PubMed] [Google Scholar]
- 23.Porkka KP, Pfeiffer MJ, Waltering KK, Vessella RL, Tammela TL, Visakorpi T. MicroRNA expression profiling in prostate cancer. Cancer Res. 2007;67:6130–5. doi: 10.1158/0008-5472.CAN-07-0533. [DOI] [PubMed] [Google Scholar]
- 24.Schaefer A, Jung M, Mollenkopf HJ, Wagner I, Stephan C, Jentzmik F, et al. Diagnostic and prognostic implications of microRNA profiling in prostate carcinoma. Int J Cancer. 2010;126:1166–76. doi: 10.1002/ijc.24827. [DOI] [PubMed] [Google Scholar]
- 25.Volinia S, Calin GA, Liu CG, Ambs S, Cimmino A, Petrocca F, et al. A microRNA expression signature of human solid tumors defines cancer gene targets. Proc Natl Acad Sci U S A. 2006;103:2257–61. doi: 10.1073/pnas.0510565103. [DOI] [PMC free article] [PubMed] [Google Scholar]
- 26.Lu J, Getz G, Miska EA, Alvarez-Saavedra E, Lamb J, Peck D, et al. MicroRNA expression profiles classify human cancers. Nature. 2005;435:834–8. doi: 10.1038/nature03702. [DOI] [PubMed] [Google Scholar]
- 27.Wang WL, Chatterjee N, Chittur SV, Welsh J, Tenniswood MP. Effects of 1alpha,25 dihydroxyvitamin D3 and testosterone on miRNA and mRNA expression in LNCaP cells. Mol Cancer. 2011;10:58. doi: 10.1186/1476-4598-10-58. [DOI] [PMC free article] [PubMed] [Google Scholar]
- 28.Nonn L, Peng L, Feldman D, Peehl DM. Inhibition of p38 by vitamin D reduces interleukin-6 production in normal prostate cells via mitogen-activated protein kinase phosphatase 5: implications for prostate cancer prevention by vitamin D. Cancer Res. 2006;66:4516–24. doi: 10.1158/0008-5472.CAN-05-3796. [DOI] [PubMed] [Google Scholar]
- 29.Bello D, Webber MM, Kleinman HK, Wartinger DD, Rhim JS. Androgen responsive adult human prostatic epithelial cell lines immortalized by human papillomavirus 18. Carcinogenesis. 1997;18:1215–23. doi: 10.1093/carcin/18.6.1215. [DOI] [PubMed] [Google Scholar]
- 30.Nonn L, Vaishnav A, Gallagher L, Gann PH. mRNA and micro-RNA expression analysis in laser-capture microdissected prostate biopsies: valuable tool for risk assessment and prevention trials. Exp Mol Pathol. 2010;88:45–51. doi: 10.1016/j.yexmp.2009.10.005. [DOI] [PMC free article] [PubMed] [Google Scholar]
- 31.Wagner D, Dias AG, Schnabl K, Van der Kwast T, Vieth R. Determination of 1,25-dihydroxyvitamin D concentrations in human colon tissues and matched serum samples. Anticancer Res. 2012;32:259–63. [PubMed] [Google Scholar]
- 32.Wagner D, Trudel D, Van der Kwast T, Nonn L, Giangreco A, Li D, et al. Randomized Clinical Trial of Vitamin D3 Doses on Prostatic Vitamin D Metabolite Levels and Ki67 Labeling in Prostate Cancer Patients. The Journal of Clinical Endocrinology & Metabolism. 2013 doi: 10.1210/jc.2012-4019. [DOI] [PMC free article] [PubMed] [Google Scholar]
- 33.Hwang HW, Wentzel EA, Mendell JT. Cell-cell contact globally activates microRNA biogenesis. Proc Natl Acad Sci U S A. 2009;106:7016–21. doi: 10.1073/pnas.0811523106. [DOI] [PMC free article] [PubMed] [Google Scholar]
- 34.Sun D, Lee YS, Malhotra A, Kim HK, Matecic M, Evans C, et al. miR-99 family of MicroRNAs suppresses the expression of prostate-specific antigen and prostate cancer cell proliferation. Cancer Res. 2011;71:1313–24. doi: 10.1158/0008-5472.CAN-10-1031. [DOI] [PMC free article] [PubMed] [Google Scholar]
- 35.Zhang Y, Yan LX, Wu QN, Du ZM, Chen J, Liao DZ, et al. miR-125b Is Methylated and Functions as a Tumor Suppressor by Regulating the ETS1 Proto-oncogene in Human Invasive Breast Cancer. Cancer Res. 2011;71:3552–62. doi: 10.1158/0008-5472.CAN-10-2435. [DOI] [PubMed] [Google Scholar]
- 36.Henson BJ, Bhattacharjee S, O'Dee DM, Feingold E, Gollin SM. Decreased expression of miR-125b and miR-100 in oral cancer cells contributes to malignancy. Genes Chromosomes Cancer. 2009;48:569–82. doi: 10.1002/gcc.20666. [DOI] [PMC free article] [PubMed] [Google Scholar]
- 37.Feng B, Wang R, Chen LB. MiR-100 resensitizes docetaxel-resistant human lung adenocarcinoma cells (SPC-A1) to docetaxel by targeting Plk1. Cancer Lett. 2011 doi: 10.1016/j.canlet.2011.11.024. [DOI] [PubMed] [Google Scholar]
- 38.Huang L, Luo J, Cai Q, Pan Q, Zeng H, Guo Z, et al. MicroRNA-125b suppresses the development of bladder cancer by targeting E2F3. Int J Cancer. 2011;128:1758–69. doi: 10.1002/ijc.25509. [DOI] [PubMed] [Google Scholar]
- 39.Zhang J, Chalmers MJ, Stayrook KR, Burris LL, Wang Y, Busby SA, et al. DNA binding alters coactivator interaction surfaces of the intact VDR-RXR complex. Nat Struct Mol Biol. 2011;18:556–63. doi: 10.1038/nsmb.2046. [DOI] [PMC free article] [PubMed] [Google Scholar]
- 40.Freedman VH, Shin SI. Cellular tumorigenicity in nude mice: correlation with cell growth in semi-solid medium. Cell. 1974;3:355–9. doi: 10.1016/0092-8674(74)90050-6. [DOI] [PubMed] [Google Scholar]
- 41.Christodoulou F, Raible F, Tomer R, Simakov O, Trachana K, Klaus S, et al. Ancient animal microRNAs and the evolution of tissue identity. Nature. 2010;463:1084–8. doi: 10.1038/nature08744. [DOI] [PMC free article] [PubMed] [Google Scholar]
- 42.Gocek E, Wang X, Liu X, Liu CG, Studzinski GP. MicroRNA-32 upregulation by 1,25-dihydroxyvitamin D3 in human myeloid leukemia cells leads to Bim targeting and inhibition of AraC-induced apoptosis. Cancer Res. 2011;71:6230–9. doi: 10.1158/0008-5472.CAN-11-1717. [DOI] [PMC free article] [PubMed] [Google Scholar]
- 43.Wang X, Gocek E, Liu CG, Studzinski GP. MicroRNAs181 regulate the expression of p27Kip1 in human myeloid leukemia cells induced to differentiate by 1,25-dihydroxyvitamin D3. Cell Cycle. 2009;8:736–41. doi: 10.4161/cc.8.5.7870. [DOI] [PMC free article] [PubMed] [Google Scholar]
- 44.Peng X, Vaishnav A, Murillo G, Alimirah F, Torres KE, Mehta RG. Protection against cellular stress by 25-hydroxyvitamin D3 in breast epithelial cells. J Cell Biochem. 2010;110:1324–33. doi: 10.1002/jcb.22646. [DOI] [PubMed] [Google Scholar]
- 45.Alvarez-Diaz S, Valle N, Ferrer-Mayorga G, Lombardia L, Herrera M, Domiguez O, et al. MicroRNA-22 is induced by vitamin D and contributes to its antiproliferative, antimigratory and gene regulatory effects in colon cancer cells. Hum Mol Genet. 2012 doi: 10.1093/hmg/dds031. [DOI] [PubMed] [Google Scholar]
- 46.Zheng YS, Zhang H, Zhang XJ, Feng DD, Luo XQ, Zeng CW, et al. MiR-100 regulates cell differentiation and survival by targeting RBSP3, a phosphatase-like tumor suppressor in acute myeloid leukemia. Oncogene. 2011 doi: 10.1038/onc.2011.208. [DOI] [PMC free article] [PubMed] [Google Scholar]
- 47.Petrelli A, Perra A, Schernhuber K, Cargnelutti M, Salvi A, Migliore C, et al. Sequential analysis of multistage hepatocarcinogenesis reveals that miR-100 and PLK1 dysregulation is an early event maintained along tumor progression. Oncogene. 2012 doi: 10.1038/onc.2011.631. [DOI] [PubMed] [Google Scholar]
- 48.Alpini G, Glaser SS, Zhang JP, Francis H, Han Y, Gong J, et al. Regulation of placenta growth factor by microRNA-125b in hepatocellular cancer. J Hepatol. 2011 doi: 10.1016/j.jhep.2011.04.015. [DOI] [PMC free article] [PubMed] [Google Scholar]
- 49.Shi XB, Xue L, Ma AH, Tepper CG, Kung HJ, White RW. miR-125b promotes growth of prostate cancer xenograft tumor through targeting pro-apoptotic genes. Prostate. 2011;71:538–49. doi: 10.1002/pros.21270. [DOI] [PMC free article] [PubMed] [Google Scholar]
- 50.Leite KR, Sousa-Canavez JM, Reis ST, Tomiyama AH, Camara-Lopes LH, Sanudo A, et al. Change in expression of miR-let7c, miR-100, and miR-218 from high grade localized prostate cancer to metastasis. Urol Oncol. 2011;29:265–9. doi: 10.1016/j.urolonc.2009.02.002. [DOI] [PubMed] [Google Scholar]
- 51.Foster CS, Falconer A, Dodson AR, Norman AR, Dennis N, Fletcher A, et al. Transcription factor E2F3 overexpressed in prostate cancer independently predicts clinical outcome. Oncogene. 2004;23:5871–9. doi: 10.1038/sj.onc.1207800. [DOI] [PubMed] [Google Scholar]
- 52.Weichert W, Schmidt M, Gekeler V, Denkert C, Stephan C, Jung K, et al. Polo-like kinase 1 is overexpressed in prostate cancer and linked to higher tumor grades. Prostate. 2004;60:240–5. doi: 10.1002/pros.20050. [DOI] [PubMed] [Google Scholar]
- 53.Bracken AP, Pasini D, Capra M, Prosperini E, Colli E, Helin K. EZH2 is downstream of the pRB-E2F pathway, essential for proliferation and amplified in cancer. EMBO J. 2003;22:5323–35. doi: 10.1093/emboj/cdg542. [DOI] [PMC free article] [PubMed] [Google Scholar]
- 54.Nair VS, Maeda LS, Ioannidis JP. Clinical Outcome Prediction by MicroRNAs in Human Cancer: A Systematic Review. J Natl Cancer Inst. 104:528–40. doi: 10.1093/jnci/djs027. [DOI] [PMC free article] [PubMed] [Google Scholar]
- 55.Dong Q, Meng P, Wang T, Qin W, Wang F, Yuan J, et al. MicroRNA let-7a inhibits proliferation of human prostate cancer cells in vitro and in vivo by targeting E2F2 and CCND2. PLoS One. 2010;5:e10147. doi: 10.1371/journal.pone.0010147. [DOI] [PMC free article] [PubMed] [Google Scholar]
Associated Data
This section collects any data citations, data availability statements, or supplementary materials included in this article.