

Abstract
Active and passive smoking have been associated with an array of adverse effects on health. The development of valid and accurate scales of measurement for exposures associated with health risks constitutes an active area of research. Tobacco smoke exposure still lacks an ideal method of measurement. A valid estimation of the risks associated with tobacco exposure depends on accurate measurement. However, some groups of people are more reluctant than others to disclose their smoking status and exposure to tobacco. This is particularly true for pregnant women and parents of young children, whose smoking is often regarded as socially unacceptable. For others, recall of tobacco exposure may also prove difficult. Because relying on self-report and the various biases it introduces may lead to inaccurate measures of nicotine exposure, more objective solutions have been suggested. Biomarkers constitute the most commonly used objective method of ascertaining nicotine exposure. Of those available, cotinine has gained supremacy as the biomarker of choice. Traditionally, cotinine has been measured in blood, saliva, and urine. Cotinine collection and analysis from these sources has posed some difficulties, which have motivated the search for a more consistent and reliable source of this biomarker. Hair analysis is a novel, noninvasive technique used to detect the presence of drugs and metabolites in the hair shaft. Because cotinine accumulates in hair during hair growth, it is a unique measure of long-term, cumulative exposure to tobacco smoke. Although hair analysis of cotinine holds great promise, a detailed evaluation of its potential as a biomarker of nicotine exposure, is needed. No studies have been published that address this issue. Because the levels of cotinine in the body are dependent on nicotine metabolism, which in turn is affected by factors such as age and pregnancy, the characterization of hair cotinine should be population specific. This review aims at defining the sensitivity, specificity, and clinical utilization of different methods used to estimate exposure to cigarette smoking and environmental tobacco smoke.
Keywords: developmental toxicology, tobacco smoke, cotinine, nicotine, hair, pregnancy, children
INTRODUCTION
Active and passive smoking have been associated with an array of adverse effects on health. The development of valid and accurate scales of measurement for exposures associated with health risks constitutes an active area of research. Tobacco smoke exposure still lacks an ideal method of measurement.
A valid estimation of the risks associated with tobacco exposure depends on accurate measurement. However, some groups of people are more reluctant than others to disclose their smoking status and exposure to tobacco. This is particularly true for pregnant women and parents of young children, whose smoking is often regarded as socially unacceptable. For others, recall of tobacco exposure may also prove difficult. Because relying on self-report and the various biases it introduces may lead to inaccurate measures of nicotine exposure, more objective solutions have been suggested.
Biomarkers constitute the most commonly used objective method of ascertaining nicotine exposure. Of those available, cotinine has gained supremacy as the biomarker of choice. Traditionally, cotinine has been measured in blood, saliva, and urine. Cotinine collection and analysis from these sources has posed some difficulties, which have motivated the search for a more consistent and reliable source of this biomarker.
Hair analysis is a novel, noninvasive technique used to detect the presence of drugs and metabolites in the hair shaft. Because cotinine accumulates in hair during hair growth, it is a unique measure of long-term, cumulative exposure to tobacco smoke. Although hair analysis of cotinine holds great promise, a detailed evaluation of its potential as a biomarker of nicotine exposure, is needed. No studies have been published that address this issue. Because the levels of cotinine in the body are dependent on nicotine metabolism, which in turn is affected by factors such as age and pregnancy, the characterization of hair cotinine should be population specific.
This review aims at defining the sensitivity, specificity, and clinical utilization of different methods used to estimate exposure to cigarette smoking and environmental tobacco smoke (ETS).
HEALTH EFFECTS OF SMOKING AND ETS EXPOSURE
Exposure to tobacco smoke continues to be an area of public health concern. In the pediatric population, including neonates, children, pregnant women, and women of reproductive age, exposure to tobacco smoke poses specific health risks, which are reviewed in the following sections.
Definitions and Components of ETS
Tobacco smoke contains approximately 4000 toxic chemicals including oxidative gases, heavy metals, cyanide, and at least 50 carcinogens1 (Table 1). Mainstream smoke is tobacco smoke generated during puff-drawing in the burning cone of a cigarette, and it is inhaled directly by the smoker before being released into the surrounding environment.2 Sidestream smoke is the combination of smoke emitted into the air during burning of a tobacco product between puffs, smoke escaping into the air during puffs, and smoke components that diffuse through cigarette paper. ETS is defined as tobacco smoke produced by an active smoker both from the exhalation of smoked tobacco (exhaled mainstream smoke) and by the burning end of the cigarette (sidestream smoke), which is inhaled by nonsmokers.3,2
TABLE 1.
Chemical Components of Sidestream and Mainstream Tobacco Smoke*
| Type of Compound
| |||
|---|---|---|---|
| Known Human Carcinogen | Probable Human Carcinogen | Toxic Compounds | |
| Benzene | Formaldehyde | 1,3-Butadiene | Carbon monoxide |
| 2-Naphthylamine | Hydrazine | Aniline | Acrolein |
| 4-Aminobiphenyl | N-nitrosodimethylamine | Benzopyrene | Ammonia |
| Nickel | N-nitrosodiethylamine | N-nitrosodiethanolamine | Nitrogen oxides |
| Polonium-210 | N-Nitrosopyrrolidine | Cadmium | — |
Adapted from Jaakkola and Jaakkola.2
Health Effects of Tobacco Smoking and ETS Exposure in Pregnancy and Reproductive Outcomes
As the adverse health effects of ETS have been reviewed extensively, we offer here a relatively short overview necessary for the context of the present study.
Despite well-documented adverse effects, tobacco remains one of the 2 most popular legal drugs used by pregnant women, second only to alcohol. Approximately 11% of pregnant Canadian women are active smokers.4 As this estimate is based on self-reported information, it may underestimate the true prevalence. The approximate proportion of nonsmoking pregnant women exposed to ETS from their spouse is 12%.4
The estimated cost of adverse pregnancy outcomes associated with tobacco smoking and ETS exposure is $1.4–$2 billion annually in the United States.5 Although some women quit smoking on becoming pregnant, many continue to smoke throughout pregnancy, and both quitters and smokers may continue to be exposed to ETS.
In women of reproductive age, smoking has been associated with delayed conception and possibly with infertility. Pregnancy rates are lower among smokers compared with nonsmokers.6–10 A meta-analysis of 12 studies found that the pooled odds ratio of infertility in smokers versus nonsmokers was 1.42 (1.27–1.5) for 9 cohort studies (n = 20,059) and 2.27 (1.28–4.02) in 4 case–control studies (n = 10,048).10 Although that meta-analysis found a significant association between smoking and infertility, the size of the effect was small and the sample size large, warranting further elucidation of this potential association. Despite the limitations inherent in observational studies, the evidence is compelling due to the consistency across studies of different designs and size. Controlling for confounding remains a barrier to the interpretation of these studies. The association with reduced fecundity is not yet clear. A prospective study of 260 couples did not show an adverse effect on fecundity of smoking 1–10 cigarettes per day [OR = 1.4 (0.9–2.2)].6 The Environmental Protection Agency report lists the association between tobacco smoking and reduced fecundity as inconclusive.1
The relative risk for spontaneous abortion, defined as fetal loss before 20 weeks of gestation, is increased by about one third in women who smoke during pregnancy.11 In a review of 5 studies, the pooled relative risk for pregnant smokers compared with nonsmokers was 1.34 (1.19–1.50).12 Nonexperimental epidemiological evidence associating maternal smoking with major adverse pregnancy outcomes in prospective and case–control studies shows a high level of consistency. A more recent case–control study supports these observations: the presence of urinary cotinine was associated with an increased odds ratio of spontaneous abortion [OR = 1.8 (1.3–2.6), n = 845].13 Although many studies have found a modest positive association between maternal cigarette smoking and risk of spontaneous abortion, dose–response curves are not consistent, and some studies have not found any association at all. There may be alternate factors that could explain these relationships, which have not been measured. It is possible that women who do not smoke also have other positive habits that may explain their superior pregnancy outcomes. To provide a more accurate evaluation of smoke-related harm, future studies should measure possible confounders such as nutrition, physical activity, and genetics.
Placental complications have been reported in greater proportion among smokers than among nonsmokers. In a large Swedish study using the population-based Swedish Birth Registry, the adjusted odds ratio for abruptio placentae among women who smoked 10 or more cigarettes daily was 2.2 (2.0–2.5) (n = 630,584).14 A review of studies on abruptio placentae and smoking reported relative risks ranging from 1.4 to 2.4 and consistency across studies.15 In a meta-analysis of the association between risk factors and placenta previa, the authors calculated a pooled odds ratio of 1.6 (1.4–1.8) for maternal smoking and risk of placenta previa based on 9 included studies and a large sample size.16 In the same report, the risk of placenta previa attributable to maternal smoking was 26%. Another review reported relative risks of placenta previa ranging from 1.5 to 3.0, with consistency across different studies.15
Smoking increases the risk for ectopic pregnancy both independently and by increasing the risk for pelvic inflammatory disease, a major etiological factor for ectopic pregnancy.15 Cnattingius15 reviewed the association between smoking and pregnancy complications. The review reports relative risks for infertility, ectopic pregnancy, spontaneous abortion, placental abruption, placenta previa, and preeclampsia. Dose–response, consistency across studies, and an evaluation of the impact of smoking cessation on disease risk are also reported. The relative risks for infertility range from 1.2 to 3.6; a dose–response relationship is uncertain, but most studies found similar trends. Smoking cessation was found to decrease risk. For ectopic pregnancy, relative risks range from 1.5 to 2.5, and different studies show consistency; however, dose–response and the impact of smoking cessation are unclear.
Effects of ETS Exposure in Infants
The risks to the neonate and infant associated with maternal smoking include preterm birth, intrauterine growth retardation (IUGR), low birth weight, perinatal and neonatal mortality, sudden infant death syndrome (SIDS), and possibly congenital malformations.
Preterm birth (less than 37 weeks) is a major cause of neonatal mortality and morbidity in developed countries. The relative risk of preterm birth among smokers compared with nonsmokers ranges from 1.2 to 1.6.17 In a population-based study of 311,977 Swedish births, the odds ratio for preterm birth (less than 32 weeks) associated with smoking more than 10 cigarettes daily was 1.6 (1.4–1.8). For deliveries between 33 and 36 weeks of gestation, the odds ratio was 1.4 (1.3–1.4).18 Many large studies support the association between preterm delivery and smoking.19–21
Findings of an association between smoking and small-for-gestational-age births are consistent in the literature. The relative risks for small-for-gestational-age range from 1.5 to 2.9.15 The risk increases with the amount smoked, suggesting a dose–response relationship.
Infants born to women who smoke during pregnancy typically weigh about 250 g less than babies of nonsmokers.17 Smoking-related reduction in birth weight is mediated by fetal growth restriction.22 The relative risk of low birth weight, defined as less than 2500 g, in infants born to smokers in numerous prospective and cross-sectional studies is doubled compared with infants born to nonsmokers.11
Perinatal mortality includes deaths occurring at 28 weeks or later, early neonatal deaths occurring within 1 week of life, and stillbirths, occurring at 20 gestational weeks or later.1,15,23 Smoking is associated with a higher risk of perinatal death.1,23 This association has been explained by 2 mechanisms. First, smoking has been causally linked to restricted fetal growth, which in turn increases the risk of death.15 Second, smokers are more likely to deliver small preterm infants, which is another risk factor for perinatal mortality. From the Swedish population–based registry, the odds ratio of perinatal death comparing smokers (>10 cigarettes per day) with nonsmokers was 1.3 (1.2–1.4).14 An estimated 3%–8% of all perinatal deaths can be attributed to maternal smoking.24
A Norwegian case–control study found an adjusted odds ratio of 3.11 (1.20–8.07) for sudden intrauterine unexplained death among 126 cases and 582 controls.25 The risk of sudden intrauterine unexplained death was 1 in 1000, and it increased with high cigarette use (≥ 10 cigarettes per day). A 40% increased risk of stillbirth was reported among smokers, explained by smoking-related risk of fetal growth retardation in a Swedish study.26 In this study, the odds ratio for the association between maternal smoking and stillbirth was 1.4 (1.2–1.4) among 597,267 births. The rate of stillbirth among smokers was 4.1 per 1000 births and 3.0 per 1000 births for nonsmokers. Women who stopped smoking in early pregnancy had a lower risk of stillbirth.27 The relative risk for early neonatal and neonatal mortality associated with maternal smoking (death during first 4 weeks of life) ranges in the literature from 1.2 to 1.4.17 Despite modest effect sizes, this represents a substantial public health problem due to a prevalence of neonatal mortality of 3.9 deaths per 1000 live births.28
Fetal growth retardation is a particularly difficult outcome to study due to its dependence on gestational age. Epidemiologic studies support a modest increase in risk of IUGR in association with ETS exposure.29 However, the evidence is not consistent, and confounders are not always measured. Recently, 3 studies have reported data on IUGR and ETS exposure, with inconsistent relative risks ranging between 0.95 and 1.33.30,31 The strength in these studies consists in accurate measurement of confounders such as gestational age, maternal age, height and weight, parity, and socioeconomic status.
SIDS is defined as unexpected infant death of unknown cause occurring between the ages of 4 weeks and 1 year, representing the third leading cause of infant death in Canada,28 where 8.2% of reported infant deaths and 26% of reported postneonatal deaths were attributed to SIDS in 1996.32 The association between smoking and SIDS has been demonstrated in a number of studies, and a dose–response relationship has been established.15,33 Caution must be exercised in interpreting these findings, as residual confounding remains a problem. Malloy et al34 found that the risk of SIDS was reduced from 2.9 to 1.9 after adjustments for confounders. The relative risks consistently range between 2.0 and 3.0. Some studies suggest that the smoking-related risk of SIDS is mediated by the causal association between smoking and reduced fetal growth.29 In a systematic review, Anderson and Cook found a summary estimate of adjusted odds ratios of prenatal smoking and SIDS of 2.11 (1.83–2.38).35
The evidence supporting an increased smoking-related risk of congenital malformations is inconclusive.17 Most studies have found no association between maternal smoking and overall risk of malformations.36–38 However, a meta-analysis of the association between maternal smoking and oral cleft found a pooled odds ratio of 1.29 (1.18–1.42) for cleft lip and 1.32 (1.10–1.62) for cleft palate.39 Because major congenital malformations are found in 2%–3% of births every year28 and constitute the leading cause of infant death, even a small increase in risk associated with smoking may have a large public health effect.
The economic burden associated with tobacco-related pediatric illness has been estimated for conditions such as low birth weight and SIDS. Approximately $1.2 billion is spent annually on direct medical costs for low birth weight and up to $3.7 billion in loss of life costs.40 The attributable risk fraction for SIDS has been estimated at 36%, an equivalent of approximately 2000 smoking-related cases of SIDS per year in the United States, with loss of life costs of $2.7 billion.40
Health Effects of ETS Exposure in Children
The annual excess in deaths of children aged 5 years or younger due to exposure to ETS is believed to exceed those due to all injuries combined.24 ETS exposure is one of the most common and hazardous environmental exposures in children. The long-term effects of ETS exposure in children range from respiratory conditions to neurotoxic consequences. Exposure to cigarette smoke in childhood has been associated with an increased risk of asthma, otitis media, upper respiratory tract infections, decreased pulmonary function, changes in neuro-development, behavior problems, and decreased school performance.41–45
A meta-analysis found significant pooled estimates of the risk associated with parental smoking for a number of respiratory conditions (Table 2).46
TABLE 2.
Association Between Childhood Exposure to ETS and Respiratory Conditions and Middle Year Disease*
| OR (95% CI) | |
|---|---|
| Respiratory outcome | |
| Lower respiratory illness (ages 0–2) | 1.57 (1.42–1.74) |
| Wheeze | 1.24 (1.17–1.31) |
| Cough | 1.40 (1.27–1.53) |
| Phlegm | 1.35 (1.13–1.62) |
| Breathlessness | 1.31 (1.08–1.59) |
| Asthma (case–control studies) | 1.37 (1.15–1.64) |
| Middle ear disease | |
| Recurrent otitis media | 1.48 (1.08–2.04) |
| Middle ear effusion | 1.38 (1.23–1.55) |
CI, confidence interval.
Adapted from Office of Environmental Health Hazard Assessment.47
The National Cancer Institute report concluded that strong evidence exists to support a relationship between ETS exposure and otitis media, especially among children younger than 2 years.47
Decreased lung function has been associated with ETS exposure. Another meta-analysis of 21 studies found a reduction in forced expiratory volume in 1 second of 1.4%, in midexpiratory flow rate of 5%, and in end expiratory flow rate of 4.3%.48
Recent reviews on the impact of ETS exposure on behavior and neurologic development report adverse neuro-cognitive effects among children. A review of 17 studies suggested subtle changes in the neurodevelopment of children exposed to maternal smoking.49 Brook et al50 found maternal smoking to be associated with negativity among 2-year-old children, whereas Williams et al51 reported externalizing behavior problems in a longitudinal study of children from birth to 5 years of age. A clear dose–response relationship existed, with higher levels of maternal smoking being associated with higher rates of externalizing behaviors (relative risks were 1.19, 1.46, and 2.11 for smoking 1–9, 10–19 and 20 or more cigarettes per day, respectively). Several behavior problems were associated with maternal smoking in longitudinal studies.52,53
Children’s performance in school and on intelligence tests decreases with exposure to ETS. In some studies, children born to smokers have lower intelligence quotient scores than unexposed children, after controlling for confounders.52,54,55 Attention-deficit hyperactivity disorder, oppositional defiant disorder, and conduct disorder also seem to be more common among children exposed to ETS.43,54,55
Maternal smoking during pregnancy was associated with a 24% increased risk of brain tumors in a cohort of Swedish children born between 1983 and 1997.56 The adjusted hazard ratio was 1.24 (1.01–1.53) for 480 cases during 10,630,579 person-years of follow-up.
The economic burden associated with childhood exposure to tobacco smoke has been estimated for respiratory syncytial virus bronchiolitis to be approximately $130 million in hospitalization costs and $1.5 billion in loss of life costs.40 The cost for otitis media attributed to ETS exposure has been estimated in the past at $290 million annually. For asthma, an estimated $180 million in direct medical expenditures and $19 million in loss of life have been attributed to exposure to smoking. Cigarette-related fires in children account for $24 million in medical costs and $330 million in loss of life.40
QUANTIFYING TOBACCO SMOKING AND ETS EXPOSURE
Tobacco smoking and ETS exposure during pregnancy, infancy, and childhood may be substantial risk factors for a diverse range of adverse conditions. Accurate quantification of the risk to health posed by tobacco exposure must rely on valid exposure measurements.
An indicator of tobacco exposure should be measurable, and it should represent the magnitude, duration, and frequency of exposure.2 A good indicator should vary with the strength of the source and be easily and accurately measured at an affordable cost. It must be unique to tobacco smoke and be detectable in air or biological specimens at low concentrations. Selection of a measurement instrument is influenced by factors such as required accuracy of the estimate, the need for rapid results, accurate disclosure by the target population, and availability of resources.2
In selecting an adequate measurement method, several issues warrant consideration, including validity, reliability, and measurement error.
Validity refers to a set of characteristics, which can be grouped in 3 broad categories: measurement validity, internal study validity, and external validity.57 Measurement validity is the degree to which the tool measures what it purports to measure. Internal study validity refers to the degree to which inferences drawn from a study sample reflect the study subjects and are true. External validity is the extent to which study findings can be generalized to other populations. Validation of ETS exposure methods such as direct airborne levels, nicotine, and cotinine concentrations, is difficult due to the lack of a criterion or standard.2 In this case, validation is carried out by comparing results obtained by 1 method with those obtained with another imperfect method.
Reliability describes the extent to which the measurement yields the same results on repeated trials. It is evaluated by examining the repeatability of the results over time or over conditions of measurement. Reliability incorporates the random variation observed on repeated trials. Internal consistency, test–retest, intra-rater, and inter-rater are all types of reliability, which should be measured. Repeatability of measurement results can be assessed by inter-rater or intra-rater reliability. The former refers to the consistency of measurements between different raters. In the case of exposure measurement using biological or air pollutants, all measurements should be repeated at least twice and an average score should be reported.57 Intra-rater reliability refers to the consistency in results of the same rater performed at different times.
Measurement error or misclassification occurs when the measurement obtained misclassifies an individual into an incorrect exposure category. It can be nondifferential or differential. Nondifferential error occurs independent of health outcome status. This type of misclassification leads to an imprecise estimate of exposure and generally to an underestimation of a true effect of exposure on health.2 Most studies addressing the association between passive smoking and health outcomes have found only modest risks. One of the reasons for the weak associations could be nondifferential misclassification. In a more undesirable situation, misclassification is differential and can depend on health status or outcome. This type of misclassification can bias the results in any direction. A special case of differential misclassification common in ETS exposure measurements is recall bias. It results from the likelihood that diseased subjects are more prone to remember exposure compared with their nondiseased counterparts.
The chain of events leading to the exposure of an individual to ETS and the factors that determine the resulting biologically effective dose are illustrated in Figure 1.
FIGURE 1.
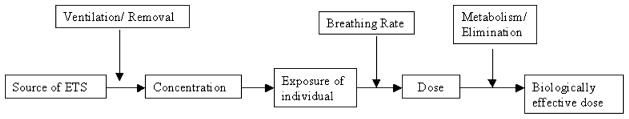
The chain of events leading to exposure of an individual to ETS that can be traced in the body.
The diagram indicates that the biologically effective dose, or its proxy measured in the body, depends on a number of factors. External elements that can affect dose include the strength and type of ETS source, duration of ETS exposure, concentration of ET, and removal of ETS through ventilation mechanisms; internal characteristics of the exposed individual include breathing rate, uptake, metabolism, and elimination of ETS compounds measurable in the body.
Exposure to ETS can be measured by 3 means: (1) measuring tobacco smoke components in the air to which subjects are exposed (environmental measurements), (2) self-reported indicators of exposure through questionnaires or interviews, and (3) measuring concentrations of components of smoke in the body of exposed individuals (biomarkers). Table 3 illustrates the various methods of measurement that may be used to assess smoking and ETS exposure, classified by type of data they allow collecting: subjective, objective, and present or past exposure to ETS.
TABLE 3.
Methods Used to Quantify Tobacco Smoking and Exposure to ETS
| Method | Data Type | Time | Example |
|---|---|---|---|
| Environmental measurements | Objective | Past and Present exposure | Personal nicotine monitor, suspended particulates in air |
| Self-report | Subjective | Past and present exposure | Questionnaire, personal interview |
| Biomarkers | Objective | Past and present exposure | Nicotine and cotinine in saliva, urine, and plasma |
Environmental measurements include nicotine, particulates, and some gases. These may be obtained by air sampling monitors or personal samplers.58 This method is suboptimal because monitors can only be used for short periods, which may not be reflective of the window of exposure. In addition, environmental measurements may not reflect the dose of ETS that reaches the body, are confounded by sources of these compounds other than ETS, and are time consuming. The other 2 methods have been more commonly used in epidemiologic studies, and their exploration forms the basis of the next 2 sections.
Self-Reports of Active Smoking and ETS Exposure
Correlation Between Self-Reports and Biomarkers of Tobacco Exposure in the General Population
Assessment of tobacco smoking and exposure to ETS through self-report is achieved either through written (self-administered questionnaire) or verbal communication (personal interview).
Questionnaires are the most commonly used vehicle for assessing use and exposure to tobacco smoke. They are convenient for many reasons: information on exposure can be collected retrospectively, which is of value when data on air pollutant concentrations or biomarkers are not available; they can provide information on long-term exposure; and they are inexpensive to administer to large numbers of subjects and are thus particularly suited for large studies. They have been successfully used in many smoking cessation studies.55–57 A meta-analysis of studies that validated self-reported smoking behavior with biochemical measurements concluded that self-reports of smoking status are generally accurate in most studies.59 However, the authors excluded studies performed in pregnant women, whose self-reports may be less accurate due to increased awareness of the social undesirability of smoking. Authors concluded that validation with biomarkers should be considered in the student population and in intervention studies.60–63 Other factors identified to improve the accuracy of self-report included interviewer-administered questionnaire, observational studies, reports by adults, and biochemical validation with cotinine.
Despite these advantages, self-reports based on questionnaire information present various concerns related to their validity as tools for data collection. Lack of validation standards, lack of standardized questionnaires, and mis-classification of exposure are among the most serious drawbacks. Misclassification is one of the most common errors occurring in questionnaire collected information. It may arise from the failure of the subject to accurately recall exposure, lack of knowledge, intentional false reporting, biased recall, or memory failure.2,64 Bias may be more common whenever social desirability is greater.59 Furthermore, the quantity of inhaled and absorbed smoking products varies with the manner of smoking, which may be difficult to express and quantify in a questionnaire.65
Since the 1994 meta-analysis, which excluded pregnant women, a number of studies have investigated the degree of accuracy of self-reported smoking status and ETS exposure in different populations. Emmons et al66 studied 186 nonsmokers to examine the correlation between salivary cotinine concentrations and questionnaire estimates of exposure to ETS across various locations (home, work, and other locations) and found moderate correlations of up to 0.36 between self-reports and biomarker data. An Italian study correlated self-report with serum cotinine and found a rate of misclassification of non-smokers of 3% (based on a cutoff cotinine value >14 ng/mL to distinguish smokers from nonsmokers) and of 8% among ex-smokers.67
Misclassification rates for current smokers who report no smoking were calculated by Wells et al68 based on 10 large studies that measured cotinine in body fluids and self-reported smoking status in a total of 14,554 subjects. The misclassification rates for female smokers misclassified as never smokers were 1%, 6%, 3%, and 15% for majority regular smokers, majority occasional smokers, U.S. minority regular smokers, and U.S. minority occasional smokers, respectively. In a population-based study of the U.S. population aged 17 years or older, 1.4% of self-reported nonsmokers had a serum cotinine level above 15 ng/mL, the selected cutoff value for identifying smokers.69 Similar misclassification rates were found in another U.S. population–based study where 2.7% of self-reported nonsmokers had serum cotinine above 15 ng/mL.70 Chen et al64 evaluated the agreement between self-reported ETS exposure and serum cotinine in a randomly selected sample of the Scottish population (n = 5387). None of the values for kappa were greater than 0.24 for any ETS questionnaire. Murray et al71 found a rate of misclassification among those participants who were self-reported nonsmokers of 10% and 17% in the usual-care and smoking intervention group, respectively, based on a salivary cotinine cutoff of 20 ng/mL. In a Finnish population–based study of 5846 randomly selected subjects enrolled in smoking cessation programs, the misclassification rate of those reporting no smoking in the previous month was 5.2% for women and 6.3% for men, based on a serum cotinine concentration of above 10 ng/mL.72 In an attempt to identify better measures of self-reported smoking behavior, Etter and Perneger73 found modest correlations between number of cigarettes smoked per day and salivary cotinine in a population-based sample of 386 smokers in Switzerland [beta = 11.3 (7.4–15.3)].
Rates of misclassification of self-reported nonsmokers seem to be greater in clinic-based studies compared with population-based studies. Among 91 UK patients with oral cancer, 9.6% of self-reported nonsmokers had a salivary cotinine level above 14 ng/mL.74 Even higher rates were reported in a population of patients with colorectal adenoma from Arizona, in which 20% of self-reported nonsmokers were misclassified based on a serum cotinine cutoff of 20 ng/mL.75 In patients attending a bronchoscopy clinic in the United Kingdom, the rate of misclassification for nonsmokers was 18.4%.76 It is likely that in clinic-based studies, social desirability and quitting expectations on the part of the health-care team influence the integrity of the self-report, especially in the case of lighter and occasional smokers, who may deny any smoking to appear compliant.59
Table 4 summarizes the relationship between self-reported smoking status or ETS exposure and biomarkers of tobacco exposure. Misclassification rates are substantially higher in those studies addressing the correlation between self-report and biomarker of ETS in the pregnant population.
TABLE 4.
Summary of Published Studies Correlating Self-Report With a Biological Marker of ETS
| Study | Biomarker | Cutoff | Misclassification Rate or Sensitivity, Specificity |
|---|---|---|---|
| General population | |||
| Perez-Stable et al77: review of 11 studies | Cotinine in body fluids | — | Misclassification = 0.9%–9.8% Sensitivity ranged from 6%–100% (mean 87.5%). Specificity ranged from |
| Patrick et al59: review of 26 studies | Cotinine, nicotine, CO | — | 33% to 100% (mean 89.2%). |
| Emmons et al66: intervention trial | Salivary cotinine | 10 ng/mL | Correlations between cotinine and questionnaire estimates of ETS exposure ranged from r = 0.22 to r = 0.36 |
| Wells et al68: review of 10 studies | Cotinine in body fluids | 10% of mean cotinine for smokers | Misclassification = 0.8%–15.3% |
| Caraballo et al69: population-based survey, United States | Serum cotinine | 15 ng/mL | Misclassification of self-reported nonsmokers = 1.4% |
| Vartiainen et al72: population-based survey, Finland | Serum cotinine | 10 ng/mL | Misclassification of no smoking in past month = 5.2%–6.3% |
| Murray et al71 | Salivary cotinine | 20 ng/mL | Misclassification = 10%–17% |
| Chen64: population-based survey, Scotland | Serum cotinine | — | Agreement between self-report and cotinine in nonsmokers: kappa <0.24 |
| Olivieri67: population-based survey, Italy | Serum cotinine | 14 ng/mL | Misclassification of self-reported nonsmokers = 3%. Misclassification of self-reported ex-smokers = 7.6%. |
| Etter and and Perneger73: population-based survey, Switzerland | Salivary cotinine | — | Correlation between number of cigarettes per day and cotinine. R2 = 0.36. |
| Nondahl et al70 | Serum cotinine | 15 ng/mL | Misclassification of self-reported nonsmokers = 2.7% |
| Pregnant women population | |||
| Webb et al78 | Urine cotinine | 80 ng/mL | Misclassification = 73% |
| Britton et al79 | Urine cotinine | 200 ng/mL | Misclassification = 16.6% |
| Owen and McNeill80 | Salivary cotinine | 14 ng/mL | Misclassification = 4% |
| Boyd et al 199881: pregnant women in a smoking cessation trial, United States | Salivary cotinine | 30 ng/mL | Misclassification = 26.2% |
| Derauf et al82 | Meconium cotinine | 25 ng/g | 3.3% of “unexposed” infants had detectable levels of cotinine |
Self-Reports of Active Smoking and ETS Exposure in Pregnant Women
Most studies presented above are population-based studies that do not specifically address children or pregnant women’s reports. Epidemiologic studies of smoking exposure and adverse pregnancy outcomes typically rely on maternal self-report. Likewise, identification of the risk posed by ETS exposure to infants and children also relies almost exclusively on parental self-report.79 The motivation on the part of mothers or caregivers to conceal or understate exposure to cigarette consumption may be quite strong.78,83 This phenomenon is especially true in light of the increasingly negative connotations attached to prenatal smoking and ETS exposure in children of smokers. The degree to which misclassification occurs in this setting has been studied, and a review of that literature is presented below with a summary in Table 4.
O’Connor et al84 noted a poor agreement between self-reported exposure to ETS and urine cotinine (kappa = 0.08) in pregnant women. In 1998, Boyd et al81 assessed the magnitude of misclassification in a large number of pregnant women, reporting rates of 26% for self-reported nonsmokers based on a cutoff salivary cotinine concentration of 30 ng/mL. However, a cutoff of 30 ng/mL is an extraordinarily high level, particularly for pregnant women, which might have missed many cases. Subsequent studies have confirmed high rates of underreporting in the pregnant population. A recent study on women participating in a prenatal clinic in Philadelphia78 found that 73% of those who classified themselves as nonsmokers had urinary cotinine values above 80 ng/mL, the cutoff used to distinguish smokers from nonsmokers. Half of women had cotinine values in excess of 100 ng/mL. Markovic et al85 also found that self-reported tobacco use in a population of pregnant women underestimated real exposure as measured by urinary cotinine. In a study of 90 pregnant women, the misclassification rate among self-reported non-smokers at the first prenatal visit was 16.6%, based on a conservative cutoff for urine cotinine of 200 ng/mL.79 The authors concluded that the high discordance rates indicate the initial prenatal interview failed to identify a significant proportion of smokers. However, this cutoff level may be too high to allow examination of concordance. Using a cutoff of 14 ng/mL salivary cotinine, Owen and McNeill80 calculated a misclassification rate of 4% among pregnant women who were self-reported nonsmokers. Underreporting was found in 4%–12% of pregnant women who demonstrated values inconsistent with their self-report.86 Wang et al87 observed a significant relationship between maternal urinary cotinine and infant size at birth. This relationship was not found with maternal self-reported smoking status. This indicates that misclassification of fetal exposure is more likely in the absence of urinary cotinine assays. Exposure misclassification may obscure significant associations between antenatal smoking and birth outcomes.
Correlation Between Parental Self-Report of Child’s ETS Exposure and Infant/Child Biomarker
Questionnaire-derived parental measures of ETS exposure have been shown to correlate poorly with biomarkers in the infant or child. In a population of newborns, meconium cotinine was measured to identify the percentage of infants exposed to nicotine. Of infants whose mothers reported no tobacco exposure, 3.3% had cotinine levels in excess of the cutoff of 25 ng/g.82
In 24 children registered as unexposed to ETS by parental reports, Nafstad et al88 found detectable levels of urine cotinine and hair nicotine, supporting previous findings that questionnaire data correlate poorly with biomarkers and generally underreport exposure to ETS. A study of 115 children correlating parental reports of child’s exposure with children’s urinary cotinine found that 14% of children whose parents reported no smoking had detectable urine cotinine.89 In another study, urinary cotinine was measured in children and compared with parental self-report of child’s exposure to ETS. Of 24 negative parental self-reports, 3 children had cotinine values exceeding 30 ng/mg of creatinine, the cutoff used to discriminate exposed from unexposed children, resulting in a rate of misclassification of 12.5%.90 Examination of maternal report and child urinary cotinine in a low-socio-economic status (SES) population (n = 196) found that 10%–32% of children who were classified as unexposed had detectable urinary cotinine of above 5 ng/mg of creatinine.91 It has been suggested that under-reporting of ETS exposure by parents depends on the instrument used and the population under study.91 Low agreement between parental report of child’s exposure and urinary cotinine was found in many studies.91,92 An objective assessment of exposure to ETS is essential, as ETS prevalence is likely underestimated by questionnaire data.91 Additionally, most parental questionnaires cannot discriminate accurately between unexposed children and mildly exposed. A more accurate assessment of exposure to active and passive smoking is necessary, particularly for pediatric populations and pregnant women.
Biomarkers
To address the difficulty of measuring and quantifying ETS exposure based on questionnaire data alone, objective and reliable methods have been developed. Biomarkers are the most widely used. A biomarker is an exogenous substance or its metabolite that can be measured in the human body and influences or predicts the incidence of an outcome (exposure or disease).2,57 Biological markers may be indicators of the presence of an exposure, in which case they are actually measures of dose or uptake (biomarkers of exposure).93 In contrast, biomarkers of effect are measures of the extent of a specific response to an exposure.1 Ideally, a biomarker of exposure to ETS should be specific to tobacco combustion and have a long half-life in the body. It should be (1) related to a prior exposure regimen, (2) the agent associated with health effects or be strongly associated with such an agent, (3) detectable in trace amounts with high precision, (4) dose dependent, (5) measurable by noninvasive methods, and (6) inexpensive to assay.2 Figure 2 illustrates the spectrum of biomarkers of exposure to a substance that has measurable deleterious effects on health.
FIGURE 2.
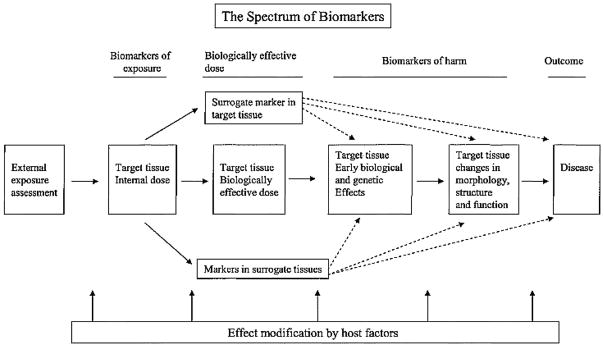
The spectrum of biomarkers.94
The diagram describes the types of assays that can be considered in the evaluation of a harmful exposure. The first is a measure of the external exposure (such as yield of a substance in the air). The others are biomarkers of internal exposure, biomarkers of the biologically effective dose, and biomarkers of potential harm.95
For inhaled substances, the degree of exposure is a function of the time spent in the exposed environment, size of the space, and its ventilation characteristics. Individual intake is influenced by a series of factors such as gender, age, weight, etc. Differences in uptake, distribution, and metabolism further affect the concentration in the body fluid or tissue in which the biomarker is measured.1
Biomarkers of tobacco or ETS exposure include any assay from any body fluid or tissue that measures a constituent metabolite of tobacco smoke.94 These are all biomarkers of exposure, not of effect. Several potential biomarkers that measure ETS exposure have been proposed and include carboxyhemoglobin, thiocyanate, carbon monoxide (CO), DNA adducts, protein adducts, nicotine, and cotinine.96
Thiocyanate concentrations in body fluids and carboxyhemoglobin are not sufficiently specific or sensitive for ETS exposure discrimination.97 In a study carried out by Jarvis et al,98 thiocyanate provided the poorest discrimination between smokers and nonsmokers, whereas the most sensitive and specific tests were performed by cotinine measured in all body fluids. Exhaled CO is a useful biomarker of exposure because it does not undergo metabolic activation. High correlations have been reported between CO and self-reported smoking and urinary cotinine, ranging from 0.76 to 0.79 for cotinine and from 0.65 to 0.70 for self-reports.99 However, there are several disadvantages of CO as a marker of nicotine exposure. These include the presence of environmental sources of CO other than tobacco, a short half-life of 4–5 hours, which makes it a biomarker of recent exposure and increases the chance of false negatives, a decrease in sensitivity with irregular smoking patterns, resulting in the inability of the marker to distinguish light and occasional smokers from nonsmokers.100 Due to the problems inherent in the other biomarkers, nicotine and its metabolite, cotinine, have emerged as the most widely used biomarkers of tobacco exposure and ETS. A description of these 2 biomarkers follows.
Nicotine
Nicotine is both the primary addictive component of tobacco smoke and a potential toxin.96 It is a major constituent of cigarettes, and it is highly specific to tobacco smoke.98 It has a half-life of approximately 2–3 hours in the blood, and it is excreted in urine.1,101 It is estimated that 1 cigarette delivers about 1 mg of nicotine.102 Nicotine in the body is affected by factors such as inhalation patterns and interindividual differences in nicotine metabolism.102,103 About 5%–10% of inhaled nicotine is excreted unchanged in urine, whereas the rest is metabolized in the liver. The major pathway of nicotine metabolism is C-oxidation to cotinine.101,104 About 80% of nicotine is transformed to cotinine in this way.101 Nicotine as a biomarker for ETS has limited utility. The assay is expensive and must be very sensitive due to the small amount of nicotine present in body fluids.100 Its short half-life renders nicotine an inadequate marker of long-term exposure and can be used to measure recent exposure only.101 Considerable intersubject variability exists due to differences in nicotine uptake, metabolism, and elimination.2 Nicotine has been measured in plasma, saliva, and urine, and choice of the matrix depends on the characteristics of the study.
Cotinine
Cotinine is the major proximate metabolite of nicotine,101 and it has become the biomarker of choice for both ETS and tobacco smoking exposure.100 Plasma cotinine level correlates better than self-report to various measures of biologic effects of smoking.77 The absorbed dose of nicotine is best approximated by cotinine in the blood.101 Because cotinine values in all biological fluids are highly correlated, blood cotinine can be accurately estimated by measuring cotinine in saliva or urine.101
Compared with the half-life of nicotine (2–3 hours), cotinine has a longer half-life of 15–19 hours in different body fluids (plasma, urine, and saliva).101 Due to its longer half-life, cotinine levels accumulate throughout the day. In addition, cotinine is eliminated over a longer period of time than nicotine.101 This results in relatively constant levels of cotinine throughout the day compared with nicotine, which tend to oscillate. Due to this stability of cotinine in the blood over time and its ability to quantify long-term exposure, it has emerged as the preferred biomarker of ETS exposure.
Individual variation in the relation of cotinine levels in body fluids and nicotine intake exists. This is due to differences in metabolism of nicotine to cotinine and differences in the clearance of cotinine itself.101 The degree of variability in the conversion of nicotine to cotinine is not great, and, even with this source of imprecision, cotinine levels accurately reflect exposure to nicotine from ETS. Cotinine measurement is superior to nicotine also because urinary pH has less influence on cotinine excretion.105 In summary, cotinine is regarded as the biomarker of choice for exposure to ETS in both active and passive smokers.101 Its characteristics include a high specificity for tobacco smoke, long half-life in body fluids, it is found at detectable levels with sensitive analytical techniques in all matrices, and due to its longer elimination half-life, it is sustained for longer time in blood compared with nicotine.101
Cotinine concentration in body fluids of pregnant women has been shown to differ from the normal adult population.1,106,107 Rebagliato et al107 found marked differences between antenatal and postnatal cotinine concentrations in smokers after controlling for tobacco consumption. They calculated a salivary cotinine per cigarette ratio during pregnancy of 3.53 ng/mL, compared with a postnatal rate of 9.87 ng/mL per cigarette. Authors suggest an altered metabolism and distribution of nicotine and cotinine during pregnancy, with higher clearance rates of cotinine compared with nonpregnant women.1
The half-life of cotinine is typically longer in neonates and children.1 The US Environmental Protection Agency (EPA) report lists half-lives of up to 60 hours in infants younger than 18 months and 40 hours in children older than 18 months.93 Mannino et al108 found that in children exposed to ETS, the highest cotinine levels were found among the youngest groups. Other studies have found cotinine levels to be higher in the youngest.109–111 The evidence is, however, inconsistent, and recently, half-lives of 28 hours have also been reported in the infant population, values close to those of adults (generally quoted as 20 hours).112 These authors suggest that higher cotinine values in previous studies may have been caused by higher exposures rather than slower metabolism. Dempsy found a neonatal half-life of cotinine of 16.3 hours in blood and 22.8 hours in urine, consistent with values in adults.113 More research is needed to clarify this distinction in cotinine half-life by age.
Cotinine in Body Fluids
Different biological fluids have been used to measure cotinine. They are commonly blood (serum/plasma), urine, and saliva. Cotinine assays using these matrices can accurately distinguish between smokers and nonsmokers.1 Levels of cotinine in nonsmokers exposed to ETS are also sufficiently high to allow detection.1 The Office of Environmental Health Hazard Assessment47 reports at least an order of magnitude difference in cotinine concentrations between active smokers and nonsmokers. In that study, unexposed nonsmokers had a plasma cotinine concentration of 0.31 ng/mL, whereas exposed nonsmokers averaged 1.99 ng/mL.47 LaKind et al114 found similar levels in exposed nonsmokers of 1.78 ng/mL in saliva, whereas unexposed cases had average levels of 0.18 ng/mL. Large studies also indicate similar concentrations for unexposed nonsmokers in serum (0.7 ng/mL) and 2.5 ng/mL in heavily exposed nonsmokers.115 These findings were confirmed in a nation-wide survey.116
Cotinine measured in saliva has been preferred by many researchers because it is noninvasive, it can discriminate between active and passive smoking, and it correlates well with urinary cotinine.100,117 Salivary cotinine correlations to plasma cotinine are generally high: r = 0.99118 and r2 = 0.997.119 This work supports the view that salivary and serum cotinine are approximately equal. In urine, it is believed that the kidney concentrates cotinine, giving rise to urinary cotinine levels that are 5 or 6 times those of urine and saliva.47
Reference intervals of cotinine in the most common matrices (blood, saliva, and urine) have been approximated for the 3 categories of ETS exposure: active smokers, passive smokers, and unexposed nonsmokers.1 Table 5 presents reference values published for plasma, urine, and saliva cotinine, by exposure level.1
TABLE 5.
Published Values of Cotinine in Plasma, Urine, and Saliva* by Exposure Level
| Matrix | Unexposed Nonsmokers | Passive Smokers | Active Smokers |
|---|---|---|---|
| Plasma (ng/mL) | 0.09–0.7 | 2–10 | >10 |
| Urine (ng/mL) | <10 | 10–100 | >200 |
| Saliva (ng/mL) | 0–5, 0.182 | 5–10 | >10 |
The values presented in Table 5 are the summary values found in published studies. It is necessary to note that adequate validation and investigation of these cutoffs have not been undertaken. LaKind114 suggested a urinary cutoff of 250 ng/mL to discriminate smokers from nonsmokers, with agreement between self-report and cotinine of 86% for nonsmokers and 97% for smokers. However, this level is considered very high. This was done for serum cotinine where a cutoff of 15 ng/mL resulted in the best sensitivity (94.8%) and specificity (95.6%) to discriminate smokers from nonsmokers.
Although measurement of nicotine and cotinine measurements in body fluids is easy, the detection at low levels of cotinine relevant to secondhand smoke may be challenging, and there are many limitations that impede their widespread use. They have a short half-life in body fluids and are thus able to reflect only recent exposure to ETS, up to 3 days preceding sample collection. This is an important consideration in cessation programs where subjects could abstain from smoking during the few days preceding testing, thus generating false-negative results. Differences in uptake, metabolism, and elimination of nicotine and cotinine result in high intersubject variability, making it difficult to standardize these measurements.
Urine cotinine depends on renal function, flow rate, and urinary pH.47 Although reporting urinary cotinine adjusted for creatinine may correct, in part, for differences in dilution effects, creatinine excretion is also variable. In addition, low creatinine in children relative to adults results in cotinine to creatinine ratios that are indicative of active smoking.1 Urinary and blood measurements are more invasive than saliva, particularly venipuncture, and may be hard to apply in the pediatric setting, or to large numbers of study subjects. Additionally, all 3 matrices require adequate sample storage. In the absence of appropriate handling methods, samples may be compromised and data may be lost.
The measurement of cotinine in blood, urine, and saliva has several limitations, particular to the sampling technique. These have justified the search for a more reliable method of cotinine quantification.
Hair Analysis
Hair analysis is a noninvasive technique used to detect the presence of drugs and metabolites in the hair shaft. Hair samples are stable indefinitely and can be collected easily, providing a wide window of detection.121 The major advantage of hair analysis is its ability to quantify long-term exposure to tobacco.3 In addition, hair analysis can quantify in utero exposure to the fetus from maternal smoking or maternal exposure to ETS.122 The absence of drug metabolism in hair makes it an appropriate matrix for historical accounts of exposure.3 Uniform hair growth facilitates segmental analysis reflecting a specified exposure period. Reduced interindividual variability in hair drugs makes it easier to standardize measurements. Hair collection is a noninvasive sampling technique, which does not necessitate special handling and storage like required with body fluid samples.3
Hair Physiology and Drug Incorporation
Hair is composed of protein (65%–95%), lipids (1%–9%), trace elements, polysaccharides, and water.123 The hair shaft is divided into 3 layers: the cuticle, cortex, and medulla124 (Fig. 3).
FIGURE 3.
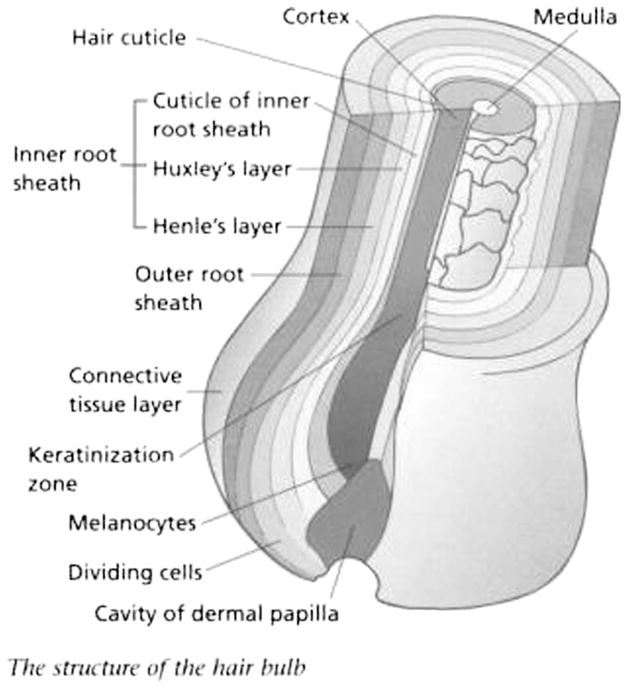
Simplified hair structure.125
The cuticle is the outermost layer, followed by the cortex and the medulla, the innermost region. The cortex is the most abundant region accounting for more than 85% of the mass of the hair shaft. It is composed of 2 types of structural proteins: fibrous and matrix proteins, which are responsible for the physiochemical properties of hair.126
Hair contains melanocytes producing a pigment called melanin. There are 2 types of melanin: eumelanin and pheomelanin. These pigments are responsible for determining hair colour.127 Melanin is produced mainly in the cortex, with very little present in the cuticle or medulla.128 Hair generally grows about 1 cm/mo3,129 so that each centimeter of scalp hair represents about 1 month of past exposure. The back of the scalp is the area with the most uniform growth patterns, and it is the recommended site for hair collection.
The mechanisms of drug incorporation into hair have been the subject of considerable debate.3 Most agree that xenobiotics reach the hair through systemic circulation through the hair bulb blood supply.130–132 During the hair growth stage, xenobiotics present in the blood, lymph, or extracellular fluid can passively diffuse into the hair matrix. As hair continues to grow and keratinize, drugs enter the hair shaft, where they remain indefinitely. The hair shaft provides a stable environment, which protects incorporated drugs from degradation. The drug concentration in hair reflects an individual’s cumulative exposure over time. Dose–response relationships have been documented in both animal and human studies. Some investigators have even found that concentrations in hair reflect the area under the plasma concentration versus time curve.133–135 This suggests that hair analysis is highly reflective of systemic exposure and that drugs incorporated into hair are mainly derived through blood circulation.
Other mechanisms of drug incorporation into hair have also been suggested. Drugs secreted from sweat, sebum, or mucous glands are thought to be incorporated into hair.136 In addition, drugs present in a vapor phase may be absorbed from the environment or may deposit on the external surface of the hair shaft. Smoked drugs such as cocaine, cannabis, and nicotine may be subject to passive accumulation.82 However, passive accumulation is likely a secondary mechanism of incorporation to the main systemic circulation route.3 To avoid contamination from nicotine externally bound to the hair shaft, hair samples are washed by cleansing solutions before analysis. Deposition from sweat or sebum does not seem to be a major pathway of incorporation into hair on the basis of microautoradiography studies. Further investigation is needed to improve our understanding of drug incorporation into hair. More research is also needed to determine the exact percentage of systemic versus passive drug incorporation into hair.
Cotinine in Hair
In contrast to nicotine, cotinine in the hair is found at much lower concentrations3 and reflects only systemic exposure,104 as opposed to nicotine, which is deposited in the hair shaft both systemically during hair synthesis and by uptake from atmospheric exposure.1 Reported values of hair cotinine range from 0.01 to 0.3 ng/mg for unexposed individuals, from 0.01 to 0.94 ng/mg for individuals exposed to ETS, and from 0.09 to 6.3 ng/mg for active smokers (Table 6).130–132,134,137–142
TABLE 6.
Summary of the Published Literature on Hair Cotinine as an Analyte of ETS Exposure
| Study | Year | Country | Subjects | Hair Cotinine Levels | Analytical Method | Limit of Detection |
|---|---|---|---|---|---|---|
| Kintz et al134 | 1992 | France | 31 nonsmokers 56 smokers |
0.01–0.13 0.09–4.99 |
GC-MS | 0.01 |
| Kintz et al134 | 1992 | France | 22 unexposed Passive Smokers |
0.01–0.13 0.01–0.13 0.09–4.99 |
GC-MS | 0.01 |
| Eliopoulos et al130 | 1996 | Canada | 36 smokers | 1.72 | RIA | 0.25 |
| Pichini et al131 (infants 3–36 mo) | 1997 | Italy | 10 unexposed 7 low passive 7 high passive |
ND ND 0.89 |
HPLC | 0.1 |
| Dimich-Ward et al137 | 1997 | Canada | 8 unexposed 8 low passive 5 high passive 5 smokers |
<0.01 0.013 <0.01 0.02 |
GC-MS | 0.01 |
| Al-Delaimy et al138 | 2000 | New Zealand | 23 unexposed 48 exposed 29 more exposed 12 high exposed |
0.025 0.038 0.156 0.10 |
RIA | 0.05 |
| Fetal exposure | ||||||
| Koren et al139 | 1992 | Canada | 11 nonsmoking mothers, newborns 10 smokers mothers, newborns |
0.3, 0.3 3.7, 2.1 |
RIA | 0.1 |
| Eliopoulos et al140 | 1994 | Canada | 35 unexposed mothers, newborn 23 passive mothers, newborn 36 smokers, newborn |
0.3, 0.26 0.9, 0.6 6.3, 2.8 |
RIA | 0.1 |
| Eliopoulos et al141 | 1996 | Canada | 36 smokers, newborns 22 passive, newborns 35 nonsmokers, newborns |
6.3, 2.81 0.94, 0.62 0.28, 0.26 |
RIA | 0.25 |
| Jacqz-Aigrain et al142 | 2002 | France | 9 nonsmokers, newborns 44 smoked 1–5 cigarettes per day 56 smoked, 6–10 cigarettes per day 38 smoked, 11–15 cigarettes per day 35 smoke, >16 cigarettes per day |
0.64, 0.62 1.76, 0.83 2.27, 1.24 1.95, 1.32 2.79, 1.61 |
RIA |
GC-MS, gas chromatography–mass spectrometry; HPLC, high-performance liquid chromatography; RIA, radioimmunoassay.
The difference in nicotine:cotinine ratios between plasma and hair reflect differences in the kinetics distribution of these compounds into hair.
Hair color may influence nicotine and cotinine uptake. Studies have reported that nicotine is found at lower concentrations in white or fair hair compared with black hair.143,144 Nicotine seems to have a higher affinity for melanin, which is more abundant in dark hair. Animal studies confirm this result. Using nonpigmented rat hair, Gerstenberg et al144 showed 20 times lower nicotine concentration than what was found in pigmented hair. Studies on cotinine are not conclusive with regard to the influence of hair color on cotinine concentrations. Knight et al145 found no differences in cotinine levels between children with dark hair and those with fair hair. However, this could reflect differences in systemic and secondhand exposure, and differences in metabolism parameters not controlled in that study. A recent review on the clinical considerations of using cotinine as a biomarker of nicotine exposure recommends that hair color be a covariate in such analyses to be able to correct for the apparently higher melanin-dependent accumulation. The recommendation is based on adult studies that have found lower hair cotinine in white hair compared with black hair when adjusting for nicotine exposure.3
An additional consideration is hair treatment. Pichini et al146 concluded that in dyed and treated hair, the concentration of nicotine and cotinine is reduced. Jurado et al89 also found a 30% reduction in hair nicotine in subjects who used bleaching or hair dying.
Hair cotinine correlates well with other measures of nicotine exposure. Eliopoulos et al141 found a significant correlation between number of cigarettes smoked reported by a group of reliable smokers and their hair cotinine concentrations (r = 0.57, P = 0.0008). Hair cotinine levels were also correlated with plasma cotinine (r = 0.42, P = 0.02). Hair cotinine has been used to detect in utero ETS exposure.140 The authors found a high correlation between maternal and infant hair cotinine (r = 0.85). They reported mean hair cotinine values of 2.8, 0.9, and 0.3 ng/mg for smoking mothers, passively exposed nonsmokers, and unexposed nonsmokers, respectively. Values for infants of smokers, passively exposed nonsmoker, and nonsmokers were 2.8, 0.6, and 0.26 ng/mg, respectively.
In a recent meta-analysis, Florescu et al147 identified cutoffs to validate cotinine as a marker for exposure to ETS. Data were obtained from 6 databases (4 United States, 1 Canada, and 1 France). Active smoking and exposure to ETS were measured in the hair of women of reproductive age, pregnant women, their children, and neonates. Subjects were classified into active smokers, passively exposed to ETS, and unexposed nonsmokers. A total of 1746 cases were available for analysis. For active smokers, mean hair cotinine concentrations (95% confidence interval) were 2.3–3.1 ng/mg for nonpregnant women and 1.5–1.9 ng/mg for pregnant women. In the group of passive smokers, mean hair cotinine concentrations were 0.5–0.7 for nonpregnant women, 0.04–0.09 ng/mg for pregnant women, 0.9–1.1 for children, and 1.2–1.7 for neonates. Among unexposed nonsmokers, mean hair cotinine was 0.2–0.4 ng/mg in nonpregnant women, 0.06–0.09 ng/mg in pregnant women, and 0.3–0.4 ng/mg in children. Cutoff values for hair cotinine have been suggested to distinguish active smokers from passive or unexposed nonsmokers (0.8 ng/mg for nonpregnant women and 0.2 ng/mg for pregnant women). A cutoff value of 0.2 ng/mg was accurate in discriminating between exposed children and unexposed. These new values should facilitate clinical diagnosis of active and passive exposure to tobacco smoke. Such diagnosis is critical in pregnancy and in a large number of tobacco-induced medical conditions.
To summarize, there are a number of advantages of using cotinine in hair as a biomarker of smoking and ETS exposure. These and the corresponding limitations are presented in Table 7.
TABLE 7.
Advantages and Limitations of Hair Cotinine as a Biomarker for Nicotine Exposure
| Advantages |
| Information on long-term exposure due to presence of cotinine in hair indefinitely |
| Absence of drug metabolism in hair provides a historical account of exposure |
| Uniform hair growth allows segmental analysis reflecting a specified exposure period |
| Standard laboratory techniques are reliable, sensitive, and specific to quantify cotinine in hair |
| Less variability than measurement of cotinine in other matrices allows better discrimination among individuals by exposure status |
| Hair collection is noninvasive and easy in most children well suited in a pediatric setting |
| Careful sample handling and storage not required. Sample is stable for up to 5 years |
| Objective measure of exposure—no recall bias, underreporting, and lack of awareness |
| No time activity patterns data required |
| Cotinine as opposed to nicotine in hair reflects only systemic exposure |
| Highly specific to nicotine intake |
| Allows fetal exposure assessment by measuring newborn’s hair at birth |
| Disadvantages |
| Interindividual variation in uptake and metabolism of nicotine results in some variability in cotinine levels |
| Irregular hair growth in some |
| Hair color and hair treatments affect cotinine concentration |
| More costly than questionnaires |
| Scarce hair (especially in infants) |
| Need to weigh hair |
Laboratory Methods for Assaying Cotinine
Several analytical procedures have been developed to quantify cotinine in hair and other matrices. The 4 broad techniques are colorimetry, chromatography, radioimmunoassay, and enzyme-linked immunosorbent assay. Colorimetry is the least desirable method due to lack of specificity. Table 8 summarizes the advantages and limitations associated with the most common techniques used to quantify cotinine in biological samples. Dhar117 describes the characteristics of chromatographic techniques in more detail.
TABLE 8.
Analytical Methods Used to Quantify Nicotine and Cotinine in Biological Samples
| Assay | Advantages | Disadvantages |
|---|---|---|
| Chromatography: gas chromatography, gas chromatography–mass spectrometry, gas–liquid chromatography, high-performance liquid chromatography | High sensitivity and specificity; simultaneous assay of nicotine and cotinine; quantification limit: 0.1 ng/mL; adequate for ETS detection | Time elapsed between exposure and collection influences results; expensive; extensive sample preparation |
| Radioimmunoassay | High sensitivity and specificity; easy to perform and low sample volume required; adequate for ETS detection | Time consuming (48 h); disposal of scintillation fluid (radioactive); depends on antisera; costly equipment; cross-reactivity with trans-3′-hydroxy cotinine |
| Enzyme-linked immunosorbent assay | Short analysis time (<5 h; no radioactive compounds; adequate for ETS detection | Cross-reactivity with trans-3′-hydroxy cotinine (30%); urine analysis presents interference due to nonspecific antigen–antibody reaction |
Of these techniques, the ultimate standard of reference in analysis of cotinine from various body fluids is gas chromatography–mass spectrometry for smokers and gas–liquid chromatography for passive smokers.147 There is a need for high sensitivity with levels of quantification optimally down to 0.01 ng/mL. Regrettably, many published studies have not used adequately sensitive assays.
Applications of Hair Analysis for Cotinine
Characterization and validation of hair cotinine as a biomarker of nicotine exposure (whether active or passive) have several applications. First, it allows further definition of ETS exposure profiles based on an objective measurement. New studies using hair cotinine will be comparable to previous studies using other matrices by using an equivalence formula similar to the one that allows interchangeable use of urinary, serum, and saliva cotinine. Hair cotinine validated within each research context will be useful as a tool for rapidly screening smoking status and ETS exposure before enrolment of subjects in large epidemiological studies in which accurate ascertainment of this exposure has value in establishing disease risk. Hair cotinine will contribute to the noninvasive validation of smoking status as reported in questionnaires. In smoking cessation programs, hair cotinine may allow the identification of smoking history without the need for frequent visits to test prior exposure. This is possible due to the historical account of smoking exposure inherent in hair measurements. On average, segments of 3 cm will reflect 3 months of exposure. Also, hair analysis will not differentiate between nicotine exposure from cigarettes versus medicinal use of nicotine replacement therapy. Because hair grows during the last trimester of fetal development, hair cotinine analysis can be used to quantify gestational exposure, either from maternal active smoking or from maternal exposure to ETS. Defining the risk of neonatal disease attributable to ETS exposure will depend on such objective fetal exposure measurements.
Validation of Biomarkers of Exposure
Epidemiologic studies rely on biomarkers as indirect indicators of something that is difficult to measure. Biomarkers are surrogate measurements because direct measurement is impossible, inaccessible, technically difficult, disruptive, or unduly expensive. Biomarkers are expected to improve the sensitivity of traditional approaches (ie, questionnaires), but their validation poses a real challenge.
As a biomarker of tobacco smoke exposure, hair cotinine is increasingly used showing great promise due to advantages over conventional body fluid measurements outlined above. Although use of a biomarker may reduce misclassification, it is possible that measurement error in the biomarker may contribute to bias in the measure of exposure and thus of an association.57 It has been established and presented above that smoking and ETS are associated with a wide range of adverse health effects. Thus, those exposed are at increased risk of disease. If hair cotinine is to contribute to the accurate assessment of ETS exposure, it has to be relevant and valid. For this, a rigorous evaluation of its performance as a biomarker is needed.
Assessment of the worth of any biomarker includes a series of considerations94:
Type of measure: marker of risk or marker of exposure
Tissue assayed: surrogate or target tissue
Characteristics of the chemical in the body: pharmacokinetics and pharmacodynamics
Dose–response relationship
Validity
The first 2 issues are not specific to the evaluation of hair cotinine and apply equally to cotinine from other sources. Although use of different matrices can reflect smoking status, a concentration-response has not been established with disease activity or severity. All 4 biomarkers are measured in surrogate tissues. The characteristics of the chemical (cotinine) in the body have been described101 and summarized in section 1.3.2. This discussion emphasizes the last 2 considerations required to evaluate hair cotinine as a biomarker of ETS exposure: dose–response and validity. In order for a test to be widely adopted, an examination of test usefulness and accuracy is required. Questions about the practical value of the information the test provides need to be weighed against the costs. Costs include false negatives, false positives, invasiveness, expense and technical demands. In addition, the test’s accuracy needs to be determined to assess the quality of the information it provides.
Dose–Response and Validity of Biomarkers of Exposure
Dose–response refers to the probability or degree of response that may be expected from varying levels of exposure. With respect to a dose–response curve between ETS exposure and level of cotinine in the hair, some studies have found a correlation between number of cigarettes smoked and hair cotinine. Further data are required to determine this characteristic of hair cotinine as a biomarker of ETS.
Validity is defined as the degree to which the results of a measurement correspond to the true state being measured.57 Other attributes considered in this context are sensitivity and specificity. The first is defined as the proportion of truly exposed persons who are identified as such by the biomarker or the probability that any given exposed case will be identified as exposed by the test. Specificity refers to the proportion of truly unexposed persons who are identified as unexposed by the biomarker. It is a measure of the probability of correctly identifying an unexposed individual. Intrinsic validity refers to the inherent properties of the biomarker, the accuracy with which the biomarker reflects true exposure. Analytical validity refers to the accuracy of the analytical methods used to quantify the biomarker. Context validity refers to the ability of the biomarker to predict adverse health effects.57
Only when validity at the laboratory and population level has been established can a biomarker be adequately used in research. Notably, despite the widespread use of biomarkers in medicine and public health, the systematic development and validation of biomarkers is a new field in environmental health.
The World Health Organization indicates a number of factors that affect the validity and feasibility of biomarkers.57 These factors are grouped according to whether they pertain to analytic procedures or to intrinsic characteristics of the biomarker. The analytical procedures that may impede their widespread use include sampling limitations (time between exposure and hair collection); number of samples required for adequate precision; degree of invasiveness of the sampling procedure; storage of samples after collection; sample contamination; simplicity and speed of analytical procedure; trueness, precision, and sensitivity of the analytical procedure; specificity for the component to be detected (ability to detect interference); and standardization of the procedure. The intrinsic characteristics of a biomarker, which may affect its validity include the specificity in relation to the pollutant, its capacity to distinguish populations with different exposure levels (sensitivity), knowledge of the biomarker’s background in the general population, dose–response curves between exposure and marker concentration, estimation of the inter-and intraindividual variability, knowledge of confounding factors that may affect the marker.57 In the pediatric relevant population and among pregnant and recent mothers the validation of hair cotinine is of special interest due to the inherent characteristics of this biomarker, which render it well suited for this population. In particular, the use of hair cotinine to detect fetal exposure from maternal exposure to ETS is of interest. Among children, collection of hair is an easy and preferred technique of data collection compared with invasive methods such as blood, urine, and saliva.
Acknowledgments
Supported by an Ontario Graduate Scholarship (A.F.), Canadian Institutes for Health Research (A.F., R.F., and G.K.), Ashley Studentship for research in tobacco control (A.F.), The Research Leadership in Better Pharmacotherapy during Pregnancy and Lactation (G.K.), and the Ivey Chair in Molecular Toxicology, Department of Medicine, University of Western Ontario (G.K.).
References
- 1.EPA California. Proposed Identification of Environmental Tobacco Smoke as a Toxic Air Contaminant. Sacramento, CA: 2004. [Google Scholar]
- 2.Jaakkola MS, Jaakkola JJ. Assessment of exposure to environmental tobacco smoke. Eur Respir J. 1997;10:2384–2397. doi: 10.1183/09031936.97.10102384. [DOI] [PubMed] [Google Scholar]
- 3.Al-Delaimy WK. Hair as a biomarker for exposure to tobacco smoke. Tob Control. 2002;11:176–182. doi: 10.1136/tc.11.3.176. [DOI] [PMC free article] [PubMed] [Google Scholar]
- 4.Health Canada. Canadian Tobacco Use Monitoring Survey (CTUMS): Summary of Results for Wave 1 (February to June) of 2002. Ottawa, Canada: Health Canada; 2003. Fact Sheets. [Google Scholar]
- 5.Medical-care expenditures attributable to cigarette smoking during pregnancy—United States, 1995. MMWR Morb Mortal Wkly Rep. 1997;46:1048–1050. [PubMed] [Google Scholar]
- 6.Florack EI, Zielhuis GA, Rolland R. Cigarette smoking, alcohol consumption, and caffeine intake and fecundability. Prev Med. 1994;23:175–180. doi: 10.1006/pmed.1994.1024. [DOI] [PubMed] [Google Scholar]
- 7.Haustein KO. Cigarette smoking, nicotine and pregnancy. Int J Clin Pharmacol Ther. 1999;37:417–427. [PubMed] [Google Scholar]
- 8.Lambers DS, Clark KE. The maternal and fetal physiologic effects of nicotine. Semin Perinatol. 1996;20:115–126. doi: 10.1016/s0146-0005(96)80079-6. [DOI] [PubMed] [Google Scholar]
- 9.Koren G. Fetal toxicology of environmental tobacco smoke. Curr Opin Pediatr. 1995;7:128–131. doi: 10.1097/00008480-199504000-00002. [DOI] [PubMed] [Google Scholar]
- 10.Augood C, Duckitt K, Templeton AA. Smoking and female infertility: a systematic review and meta-analysis. Hum Reprod. 1998;13:1532–1539. doi: 10.1093/humrep/13.6.1532. [DOI] [PubMed] [Google Scholar]
- 11.Walsh RA. Effects of maternal smoking on adverse pregnancy outcomes: examination of the criteria of causation. Hum Biol. 1994;66:1059–1092. [PubMed] [Google Scholar]
- 12.Holman CDJ, Armstrong BK, Arias LN, et al. The Quantification of Drug-Caused Morbidity and Mortality in Australia. Canberra, Australia: Commonwealth Department of Community Services and Health; 1988. [Google Scholar]
- 13.Ness RB, Grisso JA, Hirschinger N, et al. Cocaine and tobacco use and the risk of spontaneous abortion. N Engl J Med. 1999;340:333–339. doi: 10.1056/NEJM199902043400501. [DOI] [PubMed] [Google Scholar]
- 14.Kyrklund-Blomberg NB, Gennser G, Cnattingius S. Placental abruption and perinatal death. Paediatr Perinat Epidemiol. 2001;15:290–297. doi: 10.1046/j.1365-3016.2001.00352.x. [DOI] [PubMed] [Google Scholar]
- 15.Cnattingius S. The epidemiology of smoking during pregnancy: smoking prevalence, maternal characteristics, and pregnancy outcomes. Nicotine Tob Res. 2004;6(Suppl 2):S125–S140. doi: 10.1080/14622200410001669187. [DOI] [PubMed] [Google Scholar]
- 16.Faiz AS, Ananth CV. Etiology and risk factors for placenta previa: an overview and meta-analysis of observational studies. J Matern Fetal Neonatal Med. 2003;13:175–190. doi: 10.1080/jmf.13.3.175.190. [DOI] [PubMed] [Google Scholar]
- 17.DHHS, US. Women and smoking: a report of the surgeon general. Mayo Clin Womens Healthsource. 2001;5:3. [PubMed] [Google Scholar]
- 18.Kyrklund-Blomberg NB, Cnattingius S. Preterm birth and maternal smoking: risks related to gestational age and onset of delivery. Am J Obstet Gynecol. 1998;179:1051–1055. doi: 10.1016/s0002-9378(98)70214-5. [DOI] [PubMed] [Google Scholar]
- 19.Meis PJ, Michielutte R, Peters TJ, et al. Factors associated with preterm birth in Cardiff, Wales. II. Indicated and spontaneous preterm birth. Am J Obstet Gynecol. 1995;173:597–602. doi: 10.1016/0002-9378(95)90288-0. [DOI] [PubMed] [Google Scholar]
- 20.Berkowitz GS, Papiernik E. Epidemiology of preterm birth. Epidemiol Rev. 1993;15:414–443. doi: 10.1093/oxfordjournals.epirev.a036128. [DOI] [PubMed] [Google Scholar]
- 21.Multicenter randomized, controlled trial of a preterm birth prevention program. Collaborative Group on Preterm Birth Prevention. Am J Obstet Gynecol. 1993;169:352–366. doi: 10.1016/0002-9378(93)90087-y. [DOI] [PubMed] [Google Scholar]
- 22.Kramer MS. Intrauterine growth and gestational duration determinants. Pediatrics. 1987;80:502–511. [PubMed] [Google Scholar]
- 23.Population Health Division CF. The 2004 United States Surgeon General’s Report: The Health Consequences of Smoking. N S W Public Health Bull. 2004;15:107. [PubMed] [Google Scholar]
- 24.DiFranza JR, Aligne CA, Weitzman M. Prenatal and postnatal environmental tobacco smoke exposure and children’s health. Pediatrics. 2004;113:1007–1015. [PubMed] [Google Scholar]
- 25.Froen JF, Arnestad M, Frey K, et al. Risk factors for sudden intrauterine unexplained death: epidemiologic characteristics of singleton cases in Oslo, Norway, 1986–1995. Am J Obstet Gynecol. 2001;184:694–702. doi: 10.1067/mob.2001.110697. [DOI] [PubMed] [Google Scholar]
- 26.Raymond EG, Cnattingius S, Kiely JL. Effects of maternal age, parity, and smoking on the risk of stillbirth. Br J Obstet Gynaecol. 1994;101:301–306. doi: 10.1111/j.1471-0528.1994.tb13614.x. [DOI] [PubMed] [Google Scholar]
- 27.Wisborg K, Kesmodel U, Henriksen TB, et al. Exposure to tobacco smoke in utero and the risk of stillbirth and death in the first year of life. Am J Epidemiol. 2001;154:322–327. doi: 10.1093/aje/154.4.322. [DOI] [PubMed] [Google Scholar]
- 28.Health Canada. Canadian Perinatal Health Report, 2003. Ottawa, Canada: Minister of Public Works and Government Services; 2003. [Google Scholar]
- 29.Cooke RW. Smoking, intra-uterine growth retardation and sudden infant death syndrome. Int J Epidemiol. 1998;27:238–241. doi: 10.1093/ije/27.2.238. [DOI] [PubMed] [Google Scholar]
- 30.Horta BL, Victora CG, Menezes AM, et al. Low birthweight, preterm births and intrauterine growth retardation in relation to maternal smoking. Paediatr Perinat Epidemiol. 1997;11:140–151. doi: 10.1046/j.1365-3016.1997.d01-17.x. [DOI] [PubMed] [Google Scholar]
- 31.Dejmek J, Solansk y I, Podrazilova K, et al. The exposure of nonsmoking and smoking mothers to environmental tobacco smoke during different gestational phases and fetal growth. Environ Health Perspect. 2002;110:601–606. doi: 10.1289/ehp.02110601. [DOI] [PMC free article] [PubMed] [Google Scholar]
- 32.Statistics Canada. Canadian Vital Statistics System. Ottawa, Ontario, Canada: 1996. [Google Scholar]
- 33.US EPA. Respiratory Health Effects of Passive Smoking: Lung Cancer and Other Disorders. US EPA Office of Research and Development; Washington, DC: 1992. [Google Scholar]
- 34.Malloy MH, Kleinman JC, Land GH, et al. The association of maternal smoking with age and cause of infant death. Am J Epidemiol. 1988;128:46–55. doi: 10.1093/oxfordjournals.aje.a114957. [DOI] [PubMed] [Google Scholar]
- 35.Anderson HR, Cook DG. Passive smoking and sudden infant death syndrome: reviewof the epidemiological evidence. Thorax. 1997;52:1003–1009. doi: 10.1136/thx.52.11.1003. [DOI] [PMC free article] [PubMed] [Google Scholar]
- 36.Van den Eeden SK, Karagas MR, Daling JR, et al. A case-control study of maternal smoking and congenital malformations. Paediatr Perinat Epidemiol. 1990;4:147–155. doi: 10.1111/j.1365-3016.1990.tb00630.x. [DOI] [PubMed] [Google Scholar]
- 37.Shiono PH, Klebanoff MA, Rhoads GG. Smoking and drinking during pregnancy. Their effects on preterm birth. JAMA. 1986;255:82–84. [PubMed] [Google Scholar]
- 38.Malloy MH, Kleinman JC, Bakewell JM, et al. Maternal smoking during pregnancy: no association with congenital malformations in Missouri 1980–83. Am J Public Health. 1989;79:1243–1246. doi: 10.2105/ajph.79.9.1243. [DOI] [PMC free article] [PubMed] [Google Scholar]
- 39.Wyszynski DF, Duffy DL, Beaty TH. Maternal cigarette smoking and oral clefts: a meta-analysis. Cleft Palate Craniofac J. 1997;34:206–210. doi: 10.1597/1545-1569_1997_034_0206_mcsaoc_2.3.co_2. [DOI] [PubMed] [Google Scholar]
- 40.Aligne CA, Stoddard JJ. Tobacco and children. An economic evaluation of the medical effects of parental smoking. Arch Pediatr Adolesc Med. 1997;151:648–653. doi: 10.1001/archpedi.1997.02170440010002. [DOI] [PubMed] [Google Scholar]
- 41.Jinot J, Bayard S. Respiratory health effects of exposure to environmental tobacco smoke. Rev Environ Health. 1996;11:89–100. doi: 10.1515/reveh.1996.11.3.89. [DOI] [PubMed] [Google Scholar]
- 42.Stathis SL, O’Callaghan DM, Williams GM, et al. Maternal cigarette smoking during pregnancy is an independent predictor for symptoms of middle ear disease at five years’ postdelivery. Pediatrics. 1999;104:e16. doi: 10.1542/peds.104.2.e16. [DOI] [PubMed] [Google Scholar]
- 43.Weitzman M, Byrd RS, Aligne CA, et al. The effects of tobacco exposure on children’s behavioral and cognitive functioning: implications for clinical and public health policy and future research. Neurotoxicol Teratol. 2002;24:397–406. doi: 10.1016/s0892-0362(02)00201-5. [DOI] [PubMed] [Google Scholar]
- 44.Strachan DP, Cook DG. Health effects of passive smoking. 4. Parental smoking, middle ear disease and adenotonsillectomy in children. Thorax. 1998;53:50–56. doi: 10.1136/thx.53.1.50. [DOI] [PMC free article] [PubMed] [Google Scholar]
- 45.Chen Y, Li W, Yu S. Influence of passive smoking on admissions for respiratory illness in early childhood. Br Med J (Clin Res Ed) 1986;293:303–306. doi: 10.1136/bmj.293.6542.303. [DOI] [PMC free article] [PubMed] [Google Scholar]
- 46.Cook DG, Strachan DP. Health effects of passive smoking-10: summary of effects of parental smoking on the respiratory health of children and implications for research. Thorax. 1999;54:357–366. doi: 10.1136/thx.54.4.357. [DOI] [PMC free article] [PubMed] [Google Scholar]
- 47.OEHHA. Health effects of exposure to environmental tobacco smoke. California Environmental Protection Agency. Tob Control. 1997;6:346–353. doi: 10.1136/tc.6.4.346. [DOI] [PMC free article] [PubMed] [Google Scholar]
- 48.Cook DG, Strachan DP, Carey IM. Health effects of passive smoking. 9. Parental smoking and spirometric indices in children. Thorax. 1998;53:884–893. doi: 10.1136/thx.53.10.884. [DOI] [PMC free article] [PubMed] [Google Scholar]
- 49.Eskenazi B, Castorina R. Association of prenatal maternal or postnatal child environmental tobacco smoke exposure and neurodevelopmental and behavioral problems in children. Environ Health Perspect. 1999;107:991–1000. doi: 10.1289/ehp.99107991. [DOI] [PMC free article] [PubMed] [Google Scholar]
- 50.Brook JS, Brook DW, Whiteman M. The influence of maternal smoking during pregnancy on the toddler’s negativity. Arch Pediatr Adolesc Med. 2000;154:381–385. doi: 10.1001/archpedi.154.4.381. [DOI] [PubMed] [Google Scholar]
- 51.Williams GM, O’Callaghan M, Najman JM, et al. Maternal cigarette smoking and child psychiatric morbidity: a longitudinal study. Pediatrics. 1998;102:e11. doi: 10.1542/peds.102.1.e11. [DOI] [PubMed] [Google Scholar]
- 52.Fergusson DM, Horwood LJ, Lynskey MT. Maternal smoking before and after pregnancy: effects on behavioral outcomes in middle childhood. Pediatrics. 1993;92:815–822. [PubMed] [Google Scholar]
- 53.Weitzman M, Gortmaker S, Sobol A. Maternal smoking and behavior problems of children. Pediatrics. 1992;90:342–349. [PubMed] [Google Scholar]
- 54.Olds DL, Henderson CR, Jr, Tatelbaum R. Intellectual impairment in children of women who smoke cigarettes during pregnancy. Pediatrics. 1994;93:221–227. [PubMed] [Google Scholar]
- 55.Fergusson DM, Woodward LJ, Horwood LJ. Maternal smoking during pregnancy and psychiatric adjustment in late adolescence. Arch Gen Psychiatry. 1998;55:721–727. doi: 10.1001/archpsyc.55.8.721. [DOI] [PubMed] [Google Scholar]
- 56.Brooks DR, Mucci LA, Hatch EE, et al. Maternal smoking during pregnancy and risk of brain tumors in the offspring. A prospective study of 1.4 million Swedish births. Cancer Causes Control. 2004;15:997–1005. doi: 10.1007/s10552-004-1123-z. [DOI] [PubMed] [Google Scholar]
- 57.WHO. Biomarkers in Risk Assessment: Validity and Validation. Geneva, Switzerland: 2001. [Google Scholar]
- 58.Woodward A, al-Delaimy W. Measures of exposure to environmental tobacco smoke. Validity, precision, and relevance. Ann N Y Acad Sci. 1999;895:156–172. doi: 10.1111/j.1749-6632.1999.tb08083.x. [DOI] [PubMed] [Google Scholar]
- 59.Patrick DL, Cheadle A, Thompson DC, et al. The validity of selfreported smoking: a review and meta-analysis. Am J Public Health. 1994;84:1086–1093. 28. doi: 10.2105/ajph.84.7.1086. [DOI] [PMC free article] [PubMed] [Google Scholar]
- 60.Becona E, Vazquez FL. Self-reported smoking and measurement of expired air carbon monoxide in a clinical treatment. Psychol Rep. 1998;83:316–318. doi: 10.2466/pr0.1998.83.1.316. [DOI] [PubMed] [Google Scholar]
- 61.Hymowitz N, Cummings KM, Hyland A, et al. Predictors of smoking cessation in a cohort of adult smokers followed for five years. Tob Control. 1997;6(Suppl 2):S57–S62. doi: 10.1136/tc.6.suppl_2.s57. [DOI] [PMC free article] [PubMed] [Google Scholar]
- 62.Westman EC, Behm FM, Simel DL, et al. Smoking behavior on the first day of a quit attempt predicts long-term abstinence. Arch Intern Med. 1997;157:335–340. [PubMed] [Google Scholar]
- 63.McBride CM, Curry SJ, Lando HA, et al. Prevention of relapse in women who quit smoking during pregnancy. Am J Public Health. 1999;89:706–711. doi: 10.2105/ajph.89.5.706. [DOI] [PMC free article] [PubMed] [Google Scholar]
- 64.Chen R, Tavendale R, Tunstall-Pedoe H. Measurement of passive smoking in adults: self-reported questionnaire or serum cotinine? J Cancer Epidemiol Prev. 2002;7:85–95. doi: 10.1080/147666502321082746. [DOI] [PubMed] [Google Scholar]
- 65.Rebagliato M. Validation of self reported smoking. J Epidemiol Community Health. 2002;56:163–164. doi: 10.1136/jech.56.3.163. [DOI] [PMC free article] [PubMed] [Google Scholar]
- 66.Emmons KM, Abrams DB, Marshall R, et al. An evaluation of the relationship between self-report and biochemical measures of environmental tobacco smoke exposure. Prev Med. 1994;23:35–39. doi: 10.1006/pmed.1994.1005. [DOI] [PubMed] [Google Scholar]
- 67.Olivieri M, Poli A, Zuccaro P, et al. Tobacco smoke exposure and serum cotinine in a random sample of adults living in Verona, Italy. Arch Environ Health. 2002;57:355–359. doi: 10.1080/00039890209601421. [DOI] [PubMed] [Google Scholar]
- 68.Wells AJ, English PB, Posner SF, et al. Misclassification rates for current smokers misclassified as nonsmokers. Am J Public Health. 1998;88:1503–1509. doi: 10.2105/ajph.88.10.1503. [DOI] [PMC free article] [PubMed] [Google Scholar]
- 69.Caraballo RS, Giovino GA, Pechacek TF, et al. Factors associated with discrepancies between self-reports on cigarette smoking and measured serum cotinine levels among persons aged 17 years or older: Third National Health and Nutrition Examination Survey, 1988–1994. Am J Epidemiol. 2001;153:807–814. doi: 10.1093/aje/153.8.807. [DOI] [PubMed] [Google Scholar]
- 70.Nondahl DM, Cruickshanks KJ, Schubert CR. A questionnaire for assessing environmental tobacco smoke exposure. Environ Res. 2005;97:76–82. doi: 10.1016/j.envres.2004.02.005. [DOI] [PubMed] [Google Scholar]
- 71.Murray RP, Connett JE, Istvan JA, et al. Relations of cotinine and carbon monoxide to self-reported smoking in a cohort of smokers and exsmokers followed over 5 years. Nicotine Tob Res. 2002;4:287–294. doi: 10.1080/14622200210141266. [DOI] [PubMed] [Google Scholar]
- 72.Vartiainen E, Seppala T, Lillsunde P, et al. Validation of self reported smoking by serum cotinine measurement in a community-based study. J Epidemiol Community Health. 2002;56:167–170. doi: 10.1136/jech.56.3.167. [DOI] [PMC free article] [PubMed] [Google Scholar]
- 73.Etter JF, Perneger TV. Measurement of self reported active exposure to cigarette smoke. J Epidemiol Community Health. 2001;55:674–680. doi: 10.1136/jech.55.9.674. [DOI] [PMC free article] [PubMed] [Google Scholar]
- 74.Sandhu S, Humphris G, Whitley S, et al. Smoking habits in patient’s who have been treated for an oral cancer: validation of self-report using saliva cotinine. Oral Oncol. 2004;40:576–578. doi: 10.1016/j.oraloncology.2003.11.006. [DOI] [PubMed] [Google Scholar]
- 75.Martinez ME, Reid M, Jiang R, et al. Accuracy of self-reported smoking status among participants in a chemoprevention trial. Prev Med. 2004;38:492–497. doi: 10.1016/j.ypmed.2003.12.006. [DOI] [PubMed] [Google Scholar]
- 76.Lewis SJ, Cherry NM, McL Niven R, et al. Cotinine levels and self-reported smoking status in patients attending a bronchoscopy clinic. Biomarkers. 2003;8:218–228. doi: 10.1080/1354750031000120125. [DOI] [PubMed] [Google Scholar]
- 77.Perez-Stable EJ, Benowitz NL, Marin G. Is serum cotinine a better measure of cigarette smoking than self-report? Prev Med. 1995;24:171–179. doi: 10.1006/pmed.1995.1031. [DOI] [PubMed] [Google Scholar]
- 78.Webb DA, Boyd NR, Messina D, et al. The discrepancy between selfreported smoking status and urine cotinine levels among women enrolled in prenatal care at four publicly funded clinical sites. J Public Health Manag Pract. 2003;9:322–325. doi: 10.1097/00124784-200307000-00011. [DOI] [PubMed] [Google Scholar]
- 79.Britton GR, Brinthaupt J, Stehle JM, et al. Comparison of self-reported smoking and urinary cotinine levels in a rural pregnant population. J Obstet Gynecol Neonatal Nurs. 2004;33:306–311. doi: 10.1177/0884217504264866. [DOI] [PubMed] [Google Scholar]
- 80.Owen L, McNeill A. Saliva cotinine as indicator of cigarette smoking in pregnant women. Addiction. 2001;96:1001–1006. doi: 10.1046/j.1360-0443.2001.96710019.x. [DOI] [PubMed] [Google Scholar]
- 81.Boyd NR, Windsor RA, Perkins LL, et al. Quality of measurement of smoking status by self-report and saliva cotinine among pregnant women. Matern Child Health J. 1998;2:77–83. doi: 10.1023/a:1022936705438. [DOI] [PubMed] [Google Scholar]
- 82.Derauf C, Katz AR, Easa D. Agreement between maternal self-reported ethanol intake and tobacco use during pregnancy and meconium assays for fatty acid ethyl esters and cotinine. Am J Epidemiol. 2003;158:705–709. doi: 10.1093/aje/kwg215. [DOI] [PMC free article] [PubMed] [Google Scholar]
- 83.Windsor RA, Boyd NR, Orleans CT. A meta-evaluation of smoking cessation intervention research among pregnant women: improving the science and art. Health Educ Res. 1998;13:419–438. doi: 10.1093/her/13.3.419. [DOI] [PubMed] [Google Scholar]
- 84.O’Connor TZ, Holford TR, Leaderer BP, et al. Measurement of exposure to environmental tobacco smoke in pregnant women. Am J Epidemiol. 1995;142:1315–1321. doi: 10.1093/oxfordjournals.aje.a117599. [DOI] [PubMed] [Google Scholar]
- 85.Markovic N, Ness RB, Cefilli D, et al. Substance use measures among women in early pregnancy. Am J Obstet Gynecol. 2000;183:627–632. doi: 10.1067/mob.2000.106450. [DOI] [PubMed] [Google Scholar]
- 86.Campbell E, Sanson-Fisher R, Walsh R. Smoking status in pregnant women assessment of self-report against carbon monoxide (CO) Addict Behav. 2001;26:1–9. doi: 10.1016/s0306-4603(00)00070-8. [DOI] [PubMed] [Google Scholar]
- 87.Wang X, Tager IB, Van Vunakis H, et al. Maternal smoking during pregnancy, urine cotinine concentrations, and birth outcomes. A prospective cohort study. Int J Epidemiol. 1997;26:978–988. doi: 10.1093/ije/26.5.978. [DOI] [PubMed] [Google Scholar]
- 88.Nafstad P, Botten G, Hagen JA, et al. Comparison of three methods for estimating environmental tobacco smoke exposure among children aged between 12 and 36 months. Int J Epidemiol. 1995;24:88–94. doi: 10.1093/ije/24.1.88. [DOI] [PubMed] [Google Scholar]
- 89.Jurado D, Munoz C, de Luna JD, et al. Environmental tobacco smoke exposure in children: parental perception of smokiness at home and other factors associated with urinary cotinine in preschool children. J Expo Anal Environ Epidemiol. 2004;14:330–336. doi: 10.1038/sj.jea.7500329. [DOI] [PubMed] [Google Scholar]
- 90.Seifert JA, Ross CA, Norris JM. Validation of a five-question survey to assess a child’s exposure to environmental tobacco smoke. Ann Epidemiol. 2002;12:273–277. doi: 10.1016/s1047-2797(01)00264-2. [DOI] [PubMed] [Google Scholar]
- 91.Callais F, Momas I, Roche D, et al. Questionnaire or objective assessment for studying exposure to tobacco smoke among asthmatic and healthy children: The French VESTA Study. Prev Med. 2003;36:108–113. doi: 10.1006/pmed.2002.1132. [DOI] [PubMed] [Google Scholar]
- 92.Clark SJ, Warner JO, Dean TP. Passive smoking amongst asthmatic children. Questionnaire or objective assessment? Clin Exp Allergy. 1994;24:276–280. doi: 10.1111/j.1365-2222.1994.tb00231.x. [DOI] [PubMed] [Google Scholar]
- 93.Bayard S. Respiratory Health Effects of Passive Smoking: Lung Cancer and Other Disorders. US Environmental Protection Agency; 1992. [Google Scholar]
- 94.Shields PG. Tobacco smoking, harm reduction, and biomarkers. J Natl Cancer Inst. 2002;94:1435–1444. doi: 10.1093/jnci/94.19.1435. [DOI] [PubMed] [Google Scholar]
- 95.Stratton K, Shetty P, Wallace R, et al. Clearing the smoke: the science base for tobacco harm reduction—executive summary. Tob Control. 2001;10:189–195. doi: 10.1136/tc.10.2.189. [DOI] [PMC free article] [PubMed] [Google Scholar]
- 96.Hatsukami DK, Hecht SS, Hennrikus DJ, et al. Biomarkers of tobacco exposure or harm: application to clinical and epidemiological studies. 25–26 October 2001, Minneapolis, Minnesota. Nicotine Tob Res. 2003;5:387–396. doi: 10.1080/1462220031000094222. [DOI] [PubMed] [Google Scholar]
- 97.Leaderer BP, Lioy PJ, Spengler JD. Assessing exposures to inhaled complex mixtures. Environ Health Perspect. 1993;101(Suppl 4):167–177. doi: 10.1289/ehp.93101s4167. [DOI] [PMC free article] [PubMed] [Google Scholar]
- 98.Jarvis MJ, Tunstall-Pedoe H, Feyerabend C, et al. Comparison of tests used to distinguish smokers from nonsmokers. Am J Public Health. 1987;77:1435–1438. doi: 10.2105/ajph.77.11.1435. [DOI] [PMC free article] [PubMed] [Google Scholar]
- 99.Secker-Walker RH, Vacek PM, Flynn BS, et al. Exhaled carbon monoxide and urinary cotinine as measures of smoking in pregnancy. Addict Behav. 1997;22:671–684. doi: 10.1016/s0306-4603(97)00013-0. [DOI] [PubMed] [Google Scholar]
- 100.Stevens KR, Munoz LR. Cigarette smoking: evidence to guide measurement. Res Nurs Health. 2004;27:281–292. doi: 10.1002/nur.20024. [DOI] [PubMed] [Google Scholar]
- 101.Benowitz NL. Cotinine as a biomarker of environmental tobacco smoke exposure. Epidemiol Rev. 1996;18:188–204. doi: 10.1093/oxfordjournals.epirev.a017925. [DOI] [PubMed] [Google Scholar]
- 102.Benowitz NL. Nicotine addiction. Prim Care. 1999;26:611–631. doi: 10.1016/s0095-4543(05)70120-2. [DOI] [PubMed] [Google Scholar]
- 103.Benowitz NL, Jacob P., III Metabolism of nicotine to cotinine studied by a dual stable isotope method. Clin Pharmacol Ther. 1994;56:483–493. doi: 10.1038/clpt.1994.169. [DOI] [PubMed] [Google Scholar]
- 104.Bramer SL, Kallungal BA. Clinical considerations in study designs that use cotinine as a biomarker. Biomarkers. 2003;8:187–203. doi: 10.1080/13547500310012545. [DOI] [PubMed] [Google Scholar]
- 105.Benowitz NL. Drug therapy. Pharmacologic aspects of cigarette smoking and nicotine addition. N Engl J Med. 1988;319:1318–1330. doi: 10.1056/NEJM198811173192005. [DOI] [PubMed] [Google Scholar]
- 106.Haddow JE, Knight GJ, Palomaki GE, et al. Second-trimester serum cotinine levels in nonsmokers in relation to birth weight. Am J Obstet Gynecol. 1988;159:481–484. doi: 10.1016/s0002-9378(88)80114-5. [DOI] [PubMed] [Google Scholar]
- 107.Rebagliato M, Bolumar F, du Florey CV, et al. Variations in cotinine levels in smokers during and after pregnancy. Am J Obstet Gynecol. 1998;178:568–571. doi: 10.1016/s0002-9378(98)70440-5. [DOI] [PubMed] [Google Scholar]
- 108.Mannino DM, Caraballo R, Benowitz N, et al. Predictors of cotinine levels in US children: data from the Third National Health and Nutrition Examination Survey. Chest. 2001;120:718–724. doi: 10.1378/chest.120.3.718. [DOI] [PubMed] [Google Scholar]
- 109.Irvine L, Crombie IK, Clark RA, et al. What determines levels of passive smoking in children with asthma? Thorax. 1997;52:766–769. doi: 10.1136/thx.52.9.766. [DOI] [PMC free article] [PubMed] [Google Scholar]
- 110.Preston AM, Ramos LJ, Calderon C, et al. Exposure of Puerto Rican children to environmental tobacco smoke. Prev Med. 1997;26:1–7. doi: 10.1006/pmed.1996.9985. [DOI] [PubMed] [Google Scholar]
- 111.Kohler E, Sollich V, Schuster R, et al. Passive smoke exposure in infants and children with respiratory tract diseases. Hum Exp Toxicol. 1999;18:212–217. doi: 10.1191/096032799678839932. [DOI] [PubMed] [Google Scholar]
- 112.Leong JW, Dore ND, Shelley K, et al. The elimination half-life of urinary cotinine in children of tobacco-smoking mothers. Pulm Pharmacol Ther. 1998;11:287–290. doi: 10.1006/pupt.1998.0153. [DOI] [PubMed] [Google Scholar]
- 113.Dempsey D, Jacob P, III, Benowitz NL. Nicotine metabolism and elimination kinetics in newborns. Clin Pharmacol Ther. 2000;67:458–465. doi: 10.1067/mcp.2000.106129. [DOI] [PubMed] [Google Scholar]
- 114.LaKind JS, Jenkins RA, Naiman DQ, et al. Use of environmental tobacco smoke constituents as markers for exposure. Risk Anal. 1999;19:359–373. doi: 10.1023/a:1007088209811. [DOI] [PubMed] [Google Scholar]
- 115.Lee PN. Relation of urinary cotinine concentrations to cigarette smoking and to exposure to other people’s smoke. Thorax. 1991;46:274. doi: 10.1136/thx.46.4.274. [DOI] [PMC free article] [PubMed] [Google Scholar]
- 116.Ogden MW, Morgan WT, Heavner DL, et al. National incidence of smoking and misclassification among the U.S. married female population. J Clin Epidemiol. 1997;50:253–263. doi: 10.1016/s0895-4356(96)00378-2. [DOI] [PubMed] [Google Scholar]
- 117.Dhar P. Measuring tobacco smoke exposure: quantifying nicotine/cotinine concentration in biological samples by colorimetry, chromatography and immunoassay methods. J Pharm Biomed Anal. 2004;35:155–168. doi: 10.1016/j.jpba.2004.01.009. [DOI] [PubMed] [Google Scholar]
- 118.Jarvis MJ, Primatesta P, Erens B, et al. Measuring nicotine intake in population surveys: comparability of saliva cotinine and plasma cotinine estimates. Nicotine Tob Res. 2003;5:349–355. doi: 10.1080/1462220031000094213. [DOI] [PubMed] [Google Scholar]
- 119.Bernert JT, Jr, McGuffey JE, Morrison MA, et al. Comparison of serum and salivary cotinine measurements by a sensitive high-performance liquid chromatography-tandem mass spectrometry method as an indicator of exposure to tobacco smoke among smokers and nonsmokers. J Anal Toxicol. 2000;24:333–339. doi: 10.1093/jat/24.5.333. [DOI] [PubMed] [Google Scholar]
- 120.Parker DR, Lasater TM, Windsor R, et al. The accuracy of self-reported smoking status assessed by cotinine test strips. Nicotine Tob Res. 2002;4:305–309. doi: 10.1080/14622200210142715. [DOI] [PubMed] [Google Scholar]
- 121.National Institute on Drug Abuse (NIoD Abuse) Hair Testing for Drugs of Abuse: International Research on Standards and Technology. US Department of Health and Human Services, Public Health Service, NIH; Washington, DC: 1995. [Google Scholar]
- 122.Klein J, Chitayat D, Koren G. Hair analysis as a marker for fetal exposure to maternal smoking. N Engl J Med. 1993;328:66–67. doi: 10.1056/NEJM199301073280116. [DOI] [PubMed] [Google Scholar]
- 123.Harkey MR. Anatomy and physiology of hair. Forensic Sci Int. 1993;63:9–18. doi: 10.1016/0379-0738(93)90255-9. [DOI] [PubMed] [Google Scholar]
- 124.Montagna W. The anatomy of the hair follicle. In: Press A, editor. The Biology of Hair Growth. New York: Academic Press; 1958. [Google Scholar]
- 125.Whiting DA, Howsden FL. Color Atlas of Differential Diagnosis of Hair Loss. Fairfield, NY: Canfield Publishing Inc; 1998. [Google Scholar]
- 126.Baden HP, Goldsmith LA, Fleming B. A comparative study of the physicochemical properties of human keratinized tissues. Biochim Biophys Acta. 1973;322:269–278. doi: 10.1016/0005-2795(73)90303-6. [DOI] [PubMed] [Google Scholar]
- 127.Ortonne JP, Prota G. Hair melanins and hair color: ultrastructural and biochemical aspects. J Invest Dermatol. 1993;101:82S–89S. doi: 10.1111/1523-1747.ep12362884. [DOI] [PubMed] [Google Scholar]
- 128.Cesarini J. Hair and Hair Diseases. New York: Springer-Verlag; 1990. [Google Scholar]
- 129.Pragst F, Rothe M, Spiegel K, et al. Illegal and therapeutic drug concentrations in hair segments—a timetable for drug exposure? Forensic Sci Rev. 1998;10:81–111. [PubMed] [Google Scholar]
- 130.Eliopoulos C, Klein J, Koren G. Validation of self-reported smoking by analysis of hair for nicotine and cotinine. Ther Drug Monit. 1996;18:532–536. doi: 10.1097/00007691-199610000-00002. [DOI] [PubMed] [Google Scholar]
- 131.Pichini S, Altieri I, Pellegrini M, et al. The analysis of nicotine in infants’ hair for measuring exposure to environmental tobacco smoke. Forensic Sci Int. 1997;84:253–258. doi: 10.1016/s0379-0738(96)02069-5. [DOI] [PubMed] [Google Scholar]
- 132.Kintz P. Gas chromatographic analysis of nicotine and cotinine in hair. J Chromatogr. 1992;580:347–353. doi: 10.1016/0378-4347(92)80542-x. [DOI] [PubMed] [Google Scholar]
- 133.Al-Delaimy WK, Crane J, Woodward A. Is the hair nicotine level a more accurate biomarker of environmental tobacco smoke exposure than urine cotinine? J Epidemiol Community Health. 2002;56:66–71. doi: 10.1136/jech.56.1.66. [DOI] [PMC free article] [PubMed] [Google Scholar]
- 134.Kintz P, Ludes B, Mangin P. Evaluation of nicotine and cotinine in human hair. J Forensic Sci. 1992;37:72–76. [PubMed] [Google Scholar]
- 135.Nakahara Y, Takahashi K, Sakamoto T, et al. Hair analysis for drugs of abuse. XVII. Simultaneous detection of PCP, PCHP, and PCPdiol in human hair for confirmation of PCP use. J Anal Toxicol. 1997;21:356–362. doi: 10.1093/jat/21.5.356. [DOI] [PubMed] [Google Scholar]
- 136.Kidwell BA. Environmental Exposure—The Stumbling Block of Hair Analysis. CPC Press; 1996. [Google Scholar]
- 137.Dimich-Ward H, Gee H, Brauer M, et al. Analysis of nicotine and cotinine in the hair of hospitality workers exposed to environmental tobacco smoke. J Occup Environ Med. 1997;39:946–948. doi: 10.1097/00043764-199710000-00006. [DOI] [PubMed] [Google Scholar]
- 138.Al-Delaimy WK, Crane J, Woodward A. Questionnaire and hair measurement of exposure to tobacco smoke. J Expo Anal Environ Epidemiol. 2000;10:378–384. doi: 10.1038/sj.jea.7500102. [DOI] [PubMed] [Google Scholar]
- 139.Koren G, Klein J, Forman R, et al. Biological markers of intrauterine exposure to cocaine and cigarette smoking. Dev Pharmacol Ther. 1992;18:228–236. [PubMed] [Google Scholar]
- 140.Eliopoulos C, Klein J, Phan MK, et al. Hair concentrations of nicotine and cotinine in women and their newborn infants. JAMA. 1994;271:621–623. [PubMed] [Google Scholar]
- 141.Eliopoulos C, Klein J, Chitayat D, et al. Nicotine and cotinine in maternal and neonatal hair as markers of gestational smoking. Clin Invest Med. 1996;19:231–242. [PubMed] [Google Scholar]
- 142.Jacqz-Aigrain E, Zhang D, Maillard G, et al. Maternal smoking during pregnancy and nicotine and cotinine concentrations in maternal and neonatal hair. BJOG. 2002;109:909–911. doi: 10.1111/j.1471-0528.2002.01322.x. [DOI] [PubMed] [Google Scholar]
- 143.Uematsu T, Mizuno A, Nagashima S, et al. The axial distribution of nicotine content along hair shaft as an indicator of changes in smoking behaviour: evaluation in a smoking-cessation programme with or without the aid of nicotine chewing gum. Br J Clin Pharmacol. 1995;39:665–669. doi: 10.1111/j.1365-2125.1995.tb05726.x. [DOI] [PMC free article] [PubMed] [Google Scholar]
- 144.Gerstenberg B, Schepers G, Voncken P, et al. Nicotine and cotinine accumulation in pigmented and unpigmented rat hair. Drug Metab Dispos. 1995;23:143–148. [PubMed] [Google Scholar]
- 145.Knight JM, Eliopoulos C, Klein J, et al. Passive smoking in children. Racial differences in systemic exposure to cotinine by hair and urine analysis. Chest. 1996;109:446–450. doi: 10.1378/chest.109.2.446. [DOI] [PubMed] [Google Scholar]
- 146.Pichini S, Altieri I, Pellegrini M, et al. Hair analysis for nicotine and cotinine: evaluation of extraction procedures, hair treatments, and development of reference material. Forensic Sci Int. 1997;84:243–252. doi: 10.1016/s0379-0738(96)02068-3. [DOI] [PubMed] [Google Scholar]
- 147.Florescu A, Ferrence R, Einarson TR, et al. Reference values for hair cotinine as a biomarker of active and passive smoking in women of reproductive age, pregnant women, children, and neonates: systematic review and meta-analysis. Ther Drug Monit. 2007;29:437–446. doi: 10.1097/FTD.0b013e318074df6e. [DOI] [PubMed] [Google Scholar]