

Abstract
Microscale thermophoresis (MST) allows for quantitative analysis of protein interactions in free solution and with low sample consumption. The technique is based on thermophoresis, the directed motion of molecules in temperature gradients. Thermophoresis is highly sensitive to all types of binding-induced changes of molecular properties, be it in size, charge, hydration shell or conformation. In an all-optical approach, an infrared laser is used for local heating, and molecule mobility in the temperature gradient is analyzed via fluorescence. In standard MST one binding partner is fluorescently labeled. However, MST can also be performed label-free by exploiting intrinsic protein UV-fluorescence.
Despite the high molecular weight ratio, the interaction of small molecules and peptides with proteins is readily accessible by MST. Furthermore, MST assays are highly adaptable to fit to the diverse requirements of different biomolecules, such as membrane proteins to be stabilized in solution. The type of buffer and additives can be chosen freely. Measuring is even possible in complex bioliquids like cell lysate allowing close to in vivo conditions without sample purification. Binding modes that are quantifiable via MST include dimerization, cooperativity and competition. Thus, its flexibility in assay design qualifies MST for analysis of biomolecular interactions in complex experimental settings, which we herein demonstrate by addressing typically challenging types of binding events from various fields of life science.
Keywords: Microscale Thermophoresis, Binding Affinity, Label-free, Bioloiquids, Dimerization, Cooperativity
1 Introduction
1.1 The Importance of Biomolecular Affinity Quantification
Binding events involving proteins and other biomolecules play a central role in all fields of life science, from molecular physiology and pathology to diagnostics and pharmacology. Therefore, biomolecular interaction analysis does not only give fundamental insights into the molecular biology of the cell but also paves the way towards improved disease treatment.
Cellular networks for signal transduction are mainly based on the direct interaction of biomolecules. A typical example is the ligand binding-induced activation of cell membrane receptors. It has recently been shown for the fibroblast growth factor receptor (FGFR), that not only interaction with the ligand, but also with a negative regulator is required for proper receptor function: binding of growth-factor receptor-bound protein 2 (Grb2) dimers inhibits FGFR activation in absence of extracellular stimuli. [1] Pathological alterations of these signal transduction networks have to be elucidated to understand disease etiology. In infectious diseases, host cell invasion is a critical step that involves specific protein-protein interactions. For instance, the malaria-causing microorganism Plasmodium falciparum invades red blood cells through multiple receptor-ligand interactions. One of the key steps requires injecting parasite rhoptry neck proteins (RONs). [2] RON2 then functions as a receptor for apical membrane antigen 1 (AMA1) present on the parasite's surface. The interaction of RON2 and AMA1 is therefore of major interest as a potential drug or immunization target. [3]
In these examples, qualitative binding studies alone would hardly be sufficient. Instead, quantitative analysis not only allows obtaining biologically relevant information but also evaluating it in the context of the corresponding system. Microscale themophoresis (MST) quantifies biomolecular interactions based on the unique physical principle of thermophoresis not utilized by any other technique. As thermophoresis is influenced by binding-induced changes of various molecular properties, MST distinguishes itself from other biophysical techniques relying on measurable changes in one single parameter. In addition, MST benefits from very low sample consumption and short measurement times. Its highly flexible assay design makes MST a widely applicable approach, even when the system of interest poses challenging conditions. In this work, we place MST in the context of other well-established biochemical and biophysical methods and illustrate how it can be used to quantify interactions that are difficult to quantify by other means. Measurements in cell lysate or in complex buffers as are needed to stabilize GPCRs are shown. In addition to small molecule interactions, homodimerization, binding events comprising multiple constituents and cooperativity are discussed. We furthermore give detailed information on the background of MST and on its experimental implementation.
1.2 Tools for Biomolecular Binding Analysis
The optimal approach to determine binding constants for a given biological system can be selected by considering the specific strengths and weaknesses of the currently available techniques. Biochemical methods are straightforward to perform and comparably low in cost and effort. They include electrophoretic mobility shift assays (EMSA) for the study of protein-nucleic acid interactions and antibody-based techniques such as enzyme linked immunosorbent assays (ELISA). [4,5] Despite their popularity and application depth, classical biochemical methods are typically limited to semiquantitative interaction analysis. [6]
A number of biophysical approaches, including isothermal titration calorimetry, dynamic light scattering, fluorescent polarization and surface plasmon resonance, do allow quantitative binding studies. Isothermal titration calorimetry (ITC) has the advantage of not requiring labeling or tethering. In this calorimetric approach, the heat change upon binding is measured by titrating one binding partner into an adiabatic sample cell, which contains a constant amount of the other binding partner. ITC gives direct access to affinity, stoichiometry and thermodynamic parameters. However, sensitivity is low, requiring relatively high amounts of sample to generate a sufficiently strong heat signal, which can be difficult to achieve for biological samples. Binding affinities from nM to sub-mM can be resolved with low throughput. [7–9] Label-free, free solution binding analysis is also possible via dynamic light scattering (DLS). DLS utilizes the autocorrelation of time-dependent fluctuations in light scattered by biomolecules in solution. The translational diffusion coefficient and thus the hydrodynamic radius (rH) of the biomolecules are inferred. A binding-induced change in the average particle size can thus be detected. In high-density plate formats, DLS allows for high-throughput measurements of affinities in the low to high micromolar range. The technique, however, relies on a significant difference in the rH of the unbound partners relative to the complex and is thus limited to binding partners that maximally differ by a factor of two in their rH . It has to be taken into account that rH scales with the cube root of the molecular weight. The sensitivity is thus lower for the binding of two larger proteins compared to the binding of two smaller ones. [10,11] Another free solution method is fluorescence polarization (FP; or fluorescence anisotropy). FP requires fluorescent labeling of one of the binding partners, usually a small molecule ligand, which is then excited with polarized light. Fast rotation of the small ligand causes the emitted light to be depolarized. Binding of a larger protein leads to an increase in size and thus slower rotation. As a result, the emitted light remains polarized to a greater extent. FP allows for fully automated high-throughput analysis. Applicability and sensitivity are limited by the relation of fluorescence lifetime of the dye, the size of the fluoroligand and the molecular weight change upon binding. Fluorescein, a dye frequently used for FP, has a lifetime of 4 ns and is thus only applicable in FP assays in which a ligand of less than several thousand Daltons in size is labeled. [12,13] Considering that fluorescein itself has a molecular weight of >300 Da, it seems quite conceivable that labeling alters the ligand's binding behavior.
In contrast to the aforementioned methods, surface plasmon resonance (SPR) is not performed in free solution. Instead, it relies on immobilizing one of the binding partners to a thin noble metal film. Light at the resonance wavelength is used to induce surface plasmons. When a binding partner binds to the immobilized biomolecule layer, the refractive index increases and therefore the resonance frequency changes. The technique allows for real-time determination of on- and off-rates and covers affinities from sub nM to low mM with an intermediate throughput rate. Mass transport as well as rebinding are well-described complications for kinetic measurements. [14,15] Establishing new assays for surface-bound techniques like SPR can be time-consuming. Furthermore, surface immobilization may affect the bound molecules' dynamics and thus alter the binding event. [16]
As a solution-based method, microscale thermophoresis avoids such surface artifacts and immobilization procedures. In standard MST, one binding partner is fluorescently labeled. [17] However, protein interactions can also be analyzed using label-free MST which utilizes the intrinsic UV-fluorescence of proteins. [18] MST relies on binding-induced changes in thermophoretic mobility, which depends on several molecular properties, including not only size, but also charge and solvation entropy. [19] Therefore, MST does not require a change in size or mass like FP and SPR and is not limited by the molecular weight ratio of the binding partners like DLS. This does not only lead to a wider applicability but also to a greater flexibility in assay design. Applicability and flexibility are further enhanced by the fact that virtually any type of buffer as well as complex bioliquid can be used.
2 The Concept of Microscale Thermophoresis
2.1 Experimental Approach
2.1.1 The MST Instrument
Microscale thermophoresis is an all-optical approach to characterize the properties of biomolecules. Visible light is used for fluorescence excitation in the Monolith NT.115 MST instrument, for which three types of LED-filter combinations are available: blue (excitation 460–480 nm, emission 515–530 nm), green (excitation 515–525 nm, emission 560–585 nm) and red (excitation 605–645 nm, emission 680–685 nm). In the Monolith NT.LabelFree instrument an excitation wavelength of 280 nm and an emission of 360 nm are used to respectively excite and detect the intrinsic UV-fluorescence of proteins. As illustrated in Fig. 1A, an infrared (IR) laser with a wavelength of 1480 nm is coupled into the light path of fluorescence excitation and emission. The IR radiation is focused onto the sample to exactly the spot where fluorescence intensity is measured. The infrared radiation is absorbed by the water molecules of the sample buffer to create a temperature gradient. As the coherent IR-laser radiation can be easily focused, the temperature gradient is localized and strong while the overall temperatures remain low. The temperature increase has a 1/e extension of 25 μm, and a total volume of 2 nl of the sample is heated by typically 1–6 K, depending on IR-laser power and capillary type. The height of the sample capillaries is tightly regulated to guarantee highly reproducible temperature gradients. In addition, high-precision glass capillaries are used that have a constant inner and outer diameter and are made from highly pure glass. This ensures that a constant amount of laser power is absorbed, that the conductive heat transport through the glass is constant and that no diffraction of laser radiation occurs. Other important capillary properties are discussed separately in section 2.1.4.
Fig. 1. Microscale thermophoresis.

A) MST setup. The sample solution inside a capillary placed on a temperature-controlled sample tray (TC) is locally heated with an IR-laser (IR), which is coupled into the path of fluorescence excitation and emission with an IR reflecting “hot”-mirror (HM). FO: Fluorescence observation; OBJ: objective. B) Schematic representation of the fluorescence time trace recorded by the MST instrument. A series of processes can be separated from each other: The initial fluorescence (I) drops fast as soon as the heating IR-laser is turned on (t=5 s). This T-jump (II) on a 100 ms timescale depicts the fluorophore's temperature sensitivity. It can easily be separated from the following diffusion-limited thermophoresis (III) lasting several seconds. Both T-jump and thermophoresis can be influenced by a binding event. Turning off the IR laser (t=35 s) leads to the inverse T-jump (IV) and the backdiffusion (V). The fluorescence after thermodiffusion (F1) is normalized to the fluorescence F0 which is either the initial fluorescence (depicted here) or the fluorescence after the T-jump. In the former case shown here, thermophoresis and T-jump are both included in the signal analysis whereas in the latter, only thermophoresis is captured.
2.1.2 Fluorescent Labels
The thermophorectic movement is detected through fluorescence of one of the binding partners, originating either from the addition of fluorescent label, a fluorescent fusion protein or due to protein intrinsic UV-fluorescence. Crosslinker reactive groups are commonly used for protein labeling. The fluorescent dye is coupled to the crosslinker, which covalently binds to specific functional groups of the protein. For instance, N-hydroxysuccinimide (NHS) esters react with primary amines of lysine side chains or at the protein's N-terminus. Coupling to arginine's guanidino group is possible as well. Alternatively, maleimide dyes can be used to label sulfhydryl groups present in reduced cysteine residues. In both cases, unreacted dye needs to be removed prior to the binding analysis. Biomolecules typically contain more than one of these potential labeling sites. However, the exact position of the fluorescent label is not important for thermophoretic analysis. Furthermore, the presence of labels at random positions adds to MST's robustness, as it minimizes possible local effects of a label on the binding behavior. Coupling reactions often require a specific pH, but the conditions are normally well-tolerated by most proteins. Besides proteins, other types of molecules can be fluorescently labeled to study binding interactions (e.g. nucleic acids, sugars, lipids, etc).
Alternative fluorescent labeling approaches can be used to specifically label the target protein without the need for prior purification. In vitro translation systems allow for the linkage of fluorophore-puromycin conjugates to the C-terminus [20] or the incorporation of “non-natural amino acids”. These amino acids can already carry a fluorescent dye [21] or can be specifically modified after incorporation. [22] In addition, recombinant proteins can be used directly in cell lysate. Either fusions to a fluorescent protein, such as the green fluorescent protein (GFP), can be used or specific peptide sequence tags allowing for site-specific dye coupling. Sample volumes and concentrations obtained by such protein purification-free approaches typically suit the requirements of MST experiments very well.
Fluorescent labels provide high sensitivity such that sub-nM concentrations can be used. They also ensure selectivity for measurements in complex fluids or mixtures of molecules carrying different labels. It is however possible that fluorescent labels influence certain binding interactions. Some biomolecules, such as most membrane proteins (e.g. G protein-coupled receptors), are particularly sensitive to modifications. A solution to this is label-free MST which utilizes intrinsic protein fluorescence in the UV-range, arising from the aromatic amino acids tyrosine, phenylalanine and tryptophan (Trp) with the latter being the dominant intrinsic fluorophore. To get a measurable UV-fluorescence signal in label-free MST, proteins of average Trp-content (2≥Trp) can typically be used in concentrations as low as 100 nM. A protein concentration of 100 nM allows to precisely quantify KDs ≥50 nM, whereas smaller KDs can still be detected but not accurately quantified. [18]
The choice of source of fluorescence should take into account the nature of the liquid in which the MST analysis will be performed. Background fluorescence of the buffer at the fluorophore wavelength should be avoided to obtain a good signal to noise ratio. Therefore, label-free measurements cannot be conducted in complex bioliquids such as concentrated cell lysate or blood serum since these show a high background UV-fluorescence due to their high protein content. Red fluorescent labels are therefore the best choice for measuring in serum as their background fluorescence is very low at the red end of the spectrum. The fluorescence intensity should be high enough to keep the concentration of the non-titrated fluorescent binding partner in the order of the expected KD or below. This ensures maximum resolution and highest precision when determining dissociation constants.
2.1.3 The Titration Series
MST measures equilibrium binding events. For this, the non-fluorescent partner is titrated against a fixed concentration of the fluorescent partner. The initial fluorescence intensity should be constant throughout the titration series unless the fluorophore is close to the binding sites or there are problems with aggregation or surface adsorption. To clarify this, the influence of detergents or BSA and a negative control of the protein should be tested. Changes in the fluorescence intensity in label-free MST should be treated carefully, as the non-negligible background fluorescence in the UV-range makes the measurements more susceptible to false-positive signals arising merely from fluorescence changes. Thus, background subtraction and negative controls are very important.
The available Monolith series instruments accept up to 16 capillaries for one experiment. The minimal concentration of titrated partner needs to be sufficiently low to measure the thermophoretic movement of the unbound state. The maximal concentration has to be higher than the expected dissociation constant to reach saturation of the fully bound complex. As a rule of thumb this is about 20-fold above the dissociation constant.
2.1.4 Capillaries
Having prepared the serial dilution, the samples are filled into capillaries through capillary action. Sample volumes of less than 4 μl are sufficient resulting in low sample consumption. MST capillaries have precisely defined dimensions with inner diameter variations of less than 1 μm guaranteeing highly reproducible temperature gradients. The temperature gradient and the overall temperature increase also depends on the thickness of the outer layer of glass since its heat conductivity determines the efficiency of heat transport away from the focal IR-laser area. The inner capillary surface greatly influences in the quality of the measurement. Standard MST capillaries (NanoTemper Technologies) are physically treated to obtain a highly homogeneous surface and thus a low background signal. Unspecific adsorption of one of the binding partners to the capillary surface is readily detected by the MST device. It can be avoided by using capillaries coated with hydrophilic or hydrophobic polymers or by using buffer additives like detergents or proteins (e.g. BSA). When using BSA for small molecule measurements, control experiments are recommended to rule out unspecific binding of the small molecule to BSA.
2.2 Theoretical Background
2.2.1 Thermophoresis
The directed movement of particles in a temperature gradient, thermophoresis, was already described by Carl Ludwig in 1856. [23] Thermophoresis can be depicted as a molecular flow, which is directly proportional to the temperature gradient with the proportionality constant DT, the thermal diffusion coefficient:
j: molecular flow
c: molecule concentration
DT: thermal diffusion coefficient
T: temperature.
In steady state this thermophoretic flow is counterbalanced by mass diffusion:
D: diffusion coefficient.
The thermophoretically induced change in concentration is then determined by the ratio of D and DT which is referred to as the Soret coefficient ST:
For a given spatial temperature difference ΔT the steady state concentration change is therefore given by:
chot: molecule concentration in the hot region
ccold: molecule concentration in the cold area.
This thermophoretic depletion depends on the interface between molecule and solvent. Under constant buffer conditions, thermophoresis probes size, charge, solvation entropy and conformation of the molecules. As biomolecular binding events typically affect at least one these parameters, thermophoresis can be used as a flexible tool for biomolecular affinity quantification. [19]
2.2.2 MST Signal Analysis
The MST instrument excites and records fluorescence of the heat spot within the sample before, during and after the IR-laser is turned on. As thermophoresis is diffusion limited, the spatial restriction of the temperature gradient, achieved by using an IR-laser for heating, allows for short measurement times well below 30 s per sample. The fluorescence time trace, schematically represented in Fig. 1B, displays a series of defined and separable processes, each of them containing different information on the binding event.
Before heating, the initial fluorescence (region I in Fig. 1B) is recorded. It should be constant for all samples. Minor random variations due to pipetting errors do not influence the result, as a relative fluorescence signal is used. Occasionally, changes of the initial fluorescence occur due to binding close to the fluorophore. Having carefully ruled out artifacts as a possible reason (see 2.1.3 ), the KD may already be inferred from these changes in some cases by plotting the initial fluorescence against the concentration of the titrant and fitting to a binding model (see below). Turning on the IR-laser leads to an abrupt change in fluorescence intensity. This so-called temperature jump (T-jump, region II in Fig. 1B) corresponds to the temperature-dependent change of fluorescence, an inherent property of the fluorophore. [24] This temperature dependence is sensitive to the fluorophore's local environment. Thus the T-jump can be influenced by conformational changes or binding in close proximity to the fluorophore [25] which may provide spatial information on the binding site. The T-jump occurs on the same short timescale of several 100 ms as the fast heating by the IR-laser. It can thus easily be separated from the following relatively slow thermophoresis (region III in Fig. 1B) which—as a diffusion-limited process—lasts several seconds. The thermophoretic motion creates a concentration gradient of the fluorescent molecules. Fluorescence intensity reaches a plateau representing the steady state in which thermodiffusion is counterbalanced by mass diffusion. Immediately after the heating laser is turned off, the fluorescence recovery due to the fluorophore's temperature dependence, the inverse T-jump (region IV in Fig. 1B), indicates cooling of the sample. Finally, backdiffusion (region V in Fig. 1B), driven by pure mass diffusion, leads to the compensating of the concentration gradient.
As mentioned above, relative fluorescence is used to quantify binding via MST:
Fnorm: normalized fluorescence
F1: fluorescence after thermodiffusion
F0: initial fluorescence or fluorescence after T-jump.
F1 refers to the fluorescence in the steady state. Even if the diffusion is too slow to reach the steady state within the time of the experiment, the traces of unbound and bound state can typically be discriminated after several seconds. [17] F0 refers to either the initial fluorescence or the fluorescence after the T-jump which is approximately 1 s after the laser has been turned on. In the former case depicted in Fig. 1B, thermophoresis and T-jump are both included in the signal analysis whereas in the latter, only thermophoresis is captured. When the T-jump is influenced by the binding event, including it leads to a better signal to noise ratio in the resulting binding curve. Analysis of thermophoresis with and without T-jump typically yields the same result. Both processes should, however, not be used for a combined analysis when their binding-induced changes show amplitudes with an opposite sign and would thus cancel each other out.
For small relative temperature and concentration changes as is the case in MST experiments, the above mentioned equation describing the concentration change due to thermophoresis can be approximated by linearization:
Fnorm corresponds to ST, plus where applicable the additional contribution of the fluorescence change due to the fluorophore's temperature dependence δF/δT:
Affinity is quantified by analyzing the change in Fnorm as a function of the concentration of the titrated binding partner. As the thermophoretic movement of bound and unbound state superpose linearly, the fraction bound (FB) is described by:
FB: fraction bound
Fnorm, unbound: normalized fluorescence of the unbound state
Fnorm, bound: normalized fluorescence of the bound state.
In many cases the binding event can be described by a simple model according to the law of mass action. More complex binding modes require different models, e.g. the Hill equation for cooperativity. It would be beyond the scope of this review to discuss different binding models in detail. Thus the often applicable model according to the law of mass action will be described in the following. The binding process of a partner A and a partner B leading to the formation of a complex AB is characterized by:
A: binding partner A
B: binding partner B
AB: bound complex of A and B.
The equilibrium dissociation constant KD which quantifies the binding affinity is defined as
KD: equilibrium dissociation constant
[A]free: concentration of free partner A
[B]free: concentration of free partner B
[AB]: concentration of bound complex of A and B
whereas [A]free and [B]free represent the concentration of free partners. As these concentrations are not known, total concentrations are used instead. The total concentration of A and B are defined as:
Thus
In the following, A will represent the titrated partner, B the partner, whose concentration is kept constant and whose fluorescence is read out. To obtain the KD from the MST data, we solve for the fraction bound of B, FB:
FB is now expressed as a function of the total concentration of A and B with the KD being the single free parameter. Fnorm from the MST measurement linearly reports FB and can thus directly be fitted to this equation.
Fnorm is plotted on a linear y-axis in per mil (‰) against the total concentration of the titrated partner on a log10 x-axis. The advantage of this semi-log plot is, that the binding data can be easily inspected by eye: the curve shows a characteristic s-shape (or mirrored-s-shape) in which the unbound and saturated state build a lower and upper plateau. Fnorm of the unbound state is revealed by the fit and can be subtracted as a baseline value to yield ΔFnorm, as depicted in the figures in this manuscript.
The plots show mean ΔFnorm-values resulting from independent repeats of the MST-experiment. The error bars on individual data points represent the standard deviation between these repeats. The means are fitted and the resultant KD-values are given together with an error estimation from the fit. The fitting procedure assumes a Gaussian, symmetric error distribution. Thus the error can reach negative values, if the sensitivity limit determined by the lowest detectable concentration of fluorescent partner is reached. In these cases, the KD-values are presented as an upper limit and can also be lower.
2.3 Summary: Assay Optimization
MST experiments can easily be optimized as any potential problems are immediately revealed during assay design and specific troubleshooting steps are available. Although some points have already been mentioned in the last paragraphs, this section summarizes and details the information on optimization. The list is certainly not exhaustive but can serve as a practical guide for users.
Surface adsorption to reaction tubes, pipette tips or glass capillaries (“Sticking”)
Indications
If the capillary scan in the MST-instrument shows asymmetric peaks, peaks with shoulders or double peaks, the labeled material is most likely sticking to the capillary walls. Sometimes it takes several minutes before this is observed, sometimes it is not observable at all even though it is taking place.
The fluorescence strongly drops along the titration curve as one of the partners or the complex sticks.
The fluorescence of the sample is much lower than expected when compared to a calibration curve of the dye in the measurement buffer.
The fluorescence of the same sample decreases much faster over time than would be explained by bleaching.
The raw data curves of multiple measurements of an identical sample strongly deviate.
Optimization
Use low-binding reaction tubes and pipette tips.
Use capillaries coated with hydrophilic or hydrophobic polymers.
Use buffer additives like detergents or proteins, e.g. BSA. When testing small molecules, binding to BSA has to be excluded experimentally.
Aggregation
Indications
The raw data curves show bumps or waves.
he raw data curves of multiple measurements of an identical sample strongly deviate.
Optimization: improve sample stability, quality and homogeneity by
spinning down the sample before the experiment (e.g. 5min at 15000xg) and only using the supernatant;
using buffer additives like detergents or proteins;
optimizing the buffer in general.
Suboptimal fluorescence intensity
Indications
Low signal to noise ratio in fluorescence intensity during the capillary scan and in the raw data curves.
The upper parts of the peaks in the capillary scan are cut-off or there is no raw data curve but a flat line as the upper limit of the dynamic range of the fluorescence detection is exceeded (2500 counts).
The fluorescence of the sample is much higher or lower than expected.
Optimization
Test for free dye (high fluorescence intensity) or low labeling efficiency and loss of material (low fluorescence intensity) during the labeling process e.g. by photometrically determining the dye and protein concentration.
Adjust the LED-power or concentration of the fluorescent binding partner to yield a fluorescence intensity between 200 and 1500 counts. The optimal concentration and LED-setting can be found before the binding measurement by preparing a dilution series of the fluorescent partner in the measurement buffer.
Suboptimal concentration range in the titration series
Indications
No binding is observed.
The plateau of the unbound state or the saturation of the fully bound state are not reached.
Optimization
Optimize the concentration range of the titration, e.g. by using the concentration finder of the Nanotemper-Analysis-Software.
When the highest possible concentration of one binding partner is below saturation levels (e.g. due to solubility problems) reversing the assay design might be helpful.
Low signal to noise ratio in MST-signal amplitude
Indication
The binding-induced change in the MST-signal can barely or not at all be discriminated from the background fluctuation.
Optimization
Improve the quality of the sample by optimizing the buffer or spinning down the sample before the experiment (e.g. 5min at 15000xg) and only using the supernatant.
Increase the IR-laser power to use a higher temperature gradient.
Reverse the assay design.
3 Results and Discussion
Studying protein interactions can be challenging in certain cases. Problems arise from high mass ratios of the binding partners as in the case of protein-small molecule interactions. Membrane proteins are experimentally demanding, as they are hard to stabilize in solution. Measuring cooperative and competitive binding modes as well as working in biological liquids instead of simplified buffers can be difficult. In the following we demonstrate that MST is applicable under all mentioned challenging conditions by showing previously unpublished data and highlighting relevant examples from literature.
3.1 Protein-Protein Interactions
3.1.1 β-Lactamase TEM1 Binds Its Inhibitor BLIP
Protein-protein binding is mainly based on specific non-covalent interactions at the binding partners' interfaces. The contribution of different amino acid residues can be elucidated by quantifying the influence of site-specific mutations. An in this respect well-characterized system is the binding of β-lactamase TEM1 to the β-lactamase inhibitory protein BLIP. Herein, we investigated the binding of TEM1 β-lactamase to BLIP using MST.
In a first set of experiments, we used a constant concentration of NT647-labeled wild-type TEM1 (wt-TEM1). Binding to wild-type BLIP (wt-BLIP) as well as to two BLIP mutants with substitutions of a tryptophan residue at position 112 or 150 by alanine (W112A-BLIP, W150A-BLIP) was quantified. MST yielded a KD of 3.8±0.8 nM for the interaction of the wt-proteins (Fig. 2A). As expected, the alanine substitutions within BLIP resulted in reduced affinities for TEM with a KD of 0.5±0.1 μM in the case of W112A-BLIP and a KD of 1.7±0.4 μM in the case of W150A-BLIP (Fig. 2B and C). Due to limited sample amounts W150A-BLIP saturation was not fully reached which affects the precision of the fit. Nonetheless, both results are in excellent agreement with the literature values of 3.2±0.6 nM (wt) [26], 0.36±0.06 μM (W112A) and 3.8±0.6 μM (W150A) [27] determined by SPR. Remarkably, the thermophoretic signal seems to contain further information on the binding event. Upon binding of wt-BLIP and W112A-BLIP to TEM1, the complex shows an increased depletion compared to the unbound TEM1, represented by the negative slope of the binding curve (Fig. 2A and B). Binding of W150A-BLIP has the opposite effect (Fig. 2C). As described by Wang et al., the W150A mutation in BLIP leads to a pronounced conformational rearrangement, thus to defects in geometrical shape complementarity to TEM1 and trapping of additional water molecules in the TEM1-BLIP interface. Therefore, the enthalpic driving force for binding decreases. [28] This conformational change likely causes the reversal in sign of the MST-amplitude.
Fig. 2. MST quantifies the TEM1-BLIP interaction in agreement with SPR literature values.

A) By fitting the change in thermophoretic depletion upon titration of wt-BLIP to a constant amount of wt-TEM1 labeled with the fluorescent dye NT647 to the quadratic solution of the mass action law, a binding constant of KD=3.8±0.8 nM was determined. B) The W112A-mutation in BLIP reduces the affinity to TEM1 to 0.5±0.1 μM. C) W150A-BLIP binds TEM1 with an even lower affinity of KD=1.7±0.4 μM. D) In a reversed assay design, the concentration of the fusion protein Ypet-wt-BLIP was kept constant while titrating in wt-TEM1. In concordance with the binding curve shown in A, a KD of 4.8±1.7 nM was determined (black circles). Mutated R243A-TEM1 showed a lower affinity of KD=0.19±0.05 μM (red triangles). In cell lysate, the KD between Ypet-wt-BLIP and wt-TEM1 was quantified as 10±4 nM, thus demonstrating the applicability of MST for measurements in complex bioliquids. Notably, the sign of the MST signal amplitude is changed in lysate compared to buffer due to differences in pH, ionic strength etc.
We also used an alternative labeling approach in combination with the reversed titration protocol. The fluorescent fusion protein Ypet-wt-BLIP was kept constant while wt-TEM1 and R243A-TEM1 (substitution of arginine at position 243 to alanine) were titrated (Fig. 2D). For the interaction of the wt-proteins a KD of 5±2 nM was determined which does not only reproduce the literature value (3.5±0.5 nM, SPR) [29] but also the result measured via the reversed assay design. The R243A-TEM1 mutant showed a reduced affinity for BLIP (KD=0.19±0.05 μM) which is consistent with literature. [30] As measurements in buffer do not resemble the highly crowded, intracellular environment, we also performed MST in mammalian cell lysate. Under these close to in vivo conditions, a KD of 10±4 nM was determined for the binding of Ypet-wt-BLIP to wt-TEM1. This demonstrates the applicability of MST for affinity quantification of protein-protein interactions, not only in buffer, but also in cell lysate.
3.1.2 Grb2 Dimerization
Grb2 is known as an adaptor protein involved in several signal transduction pathways. [31] An additional function has been recently suggested: Grb2 dimers seem to control the activity of the receptor tyrosine kinase FGFR2 in the absence of extracellular stimuli by growth factors. [1]
The dimerization of Grb2 was analyzed via MST. Fluorescently labeled Grb2 at a constant concentration of 100 nM was added to a titration series of unlabeled Grb2 ranging from 55 nM to 100 μM. A KD of 0.65±0.08 μM was determined for Grb2 dimerization (Fig. 3). DLS experiments indicate that the dimer is the predominant form from 40 down to 0.4 μM, whereas below that concentration, the monomer was present. [1] The MST result is consistent with DLS, which as discussed above is most reliable when studying the interaction of small, equally sized molecules as it merely detects changes in the hydrodynamic radius. Also, when measuring dimerization, MST is comparable to DLS in that the two-fold size increase is likely to be the major cause of the decrease in thermophoretic mobility. In general, quantification of a dimerization process is not trivial. Although dimerization can also be quantified via a dilution approach in ITC for KDs in the μM-range, [32] the technique is not feasible for higher dimerization affinities. ITC requires minimal protein concentrations in the μM-range to get a measurable heat change. [8] If the dimerization KD lies in the sub-μM range as for Grb2, nearly all of the protein is present as dimers at this lowest detectable concentration (Fig. 3). Thus the monomeric state and the monomer-dimer-transition are not captured and the KD is not measurable via ITC.
Fig. 3. Grb2 dimerization quantified thermophoretically.

Unlabeled Grb2 is titrated to a constant amount of fluorescently labeled Grb2-NT647. Dimerization causes a change in thermophoresis from which a KD of 0.65±0.08 μM was derived. MST allows the usage of protein concentrations far below this KD—an obligatory prerequisite for dimerization quantification. Figure adapted with permission from Lin et al. [1]
3.2 Protein-Peptide Interaction: AMA1 and RON2
The invasion of red blood cells by the malaria-causing parasite Plasmodium falciparum is critically dependent on the interaction of two parasite proteins, RON2 and AMA1. [3,33,34] To quantify this interaction, the binding between a short RON2 peptide and AMA1 was extensively characterized using MST, SPR and FP. The RON2 peptide represents a conserved region among all P. falciparum isolates with known sequence; in this region, two completely conserved cysteine residues forming a disulfide bridge have been determined to be essential for binding to AMA1, as mutation or alkylation abolished binding. [3]
We used two MST-assay designs for the AMA1-RON2 interaction: titration of AMA1 to a constant concentration of RON2-FITC and titration of RON2 to a constant concentration of AMA1-NT647. When titrating AMA1, the MST-signal shows a single binding event with a KD of 28±2 nM. In contrast, the titration of RON2 yielded an MST-signal in which the high-affinity binding is superimposed by a second binding event at higher RON2 concentrations. When quantifying the high-affinity binding from these data, we restricted the fit to the first half of data points yielding a KD of 62±16 μM. Fitting the low-affinity binding yielded KD=1.4±0.2 μM. We also analyzed all data points with a fit assuming two independent binding events with different KDs, where we used the simplification that both binding events have the same signal amplitude. This fit yielded KDs of 81±21 μM and 1.2±0.1 μM).
The KD determined for the high-affinity AMA1-RON2 interaction varies for the different MST designs. This is because in case of the biphasic signal, the high-affinity KD is either determined by fitting less data points or by using a fit function with an additional parameter, the second, low-affinity KD. Despite this limitation, the KDs for the high-affinity binding lie in the double-digit nanomolar range for both assay designs, which demonstrates the method’s reversibility. However, the example also shows the importance of performing the assay in both ways: while AMA1-titration is needed to precisely quantify the KD, only the titration of RON2 gave additional information on a second, low-affinity binding event.
In SPR, when AMA1 was titrated against a constant level of immobilized RON2, a KD of 13±1 nM (Fig. 4C) was found. The reversed assay design of titrating the same RON2 species as used in MST experiments yielded a KD of 38.3±0.4 nM (Fig. 4D). The dissociation phase in the SPR data was best fit by a heterogeneous ligand, indicative of the same second low affinity binding phase captured in (Fig. 4B and D).
Fig. 4. The AMA1-RON2 binding analyzed via MST, SPR and FP.

A) Titration of the AMA1 protein to a constant amount of RON2-FITC peptide induces a pronounced MST signal change (KD=28±3 nM). B) Titrating the peptide (4.3 kDa) to a constant AMA1-NT647 (66 kDa) concentration yielded an MST signal despite the unfavorable size ratio. The signal indicated a biphasic event. Fitting the high affinity phase (blue) reveals a KD of 62±16 μM, which is similar to the reverse titration (Fig.4 A). Fitting the low affinity phase (red) yields a KD of 1.4±0.2 μM, which putatively results from the binding of a non-cyclized RON2 population. Inset: Instead of two independent fits for the two phases, one fit function assuming two binding events is used. This yields similar KDs of 81±21 μM and 1.2±0.1 μM. C) SPR with immobilized RON2 and five different concentrations of AMA1 yields KD=13±1 nM confirming MST. D) Via the reversed SPR assay design, a similar KD of 38.3±0.4 nM is determined. A heterogeneous ligand model fits the dissociation phase best, thus also indicating a biphasic event as observed in MST. E) FP yields a reliable result when titrating the larger binding partner, AMA1 (EC50 48±11 nM). F) Titrating the small peptide instead reduces the FP signal amplitude significantly. An EC50 of 77.1±0.2 nM is estimated from the initial phase (the last three points were omitted because they appeared to represent the onset of a second phase in that range).
This second binding event could be explained by the fact that the unlabeled RON2 peptide might be present in two forms in solution: one with and one without a disulfide bond, i.e. a cyclized and a linear from. As the second binding phase is not present in the reversed assay design (Fig. 4A), the labeled RON2 seems to be homogeneously cyclized.
An EC50 of 0.05±0.01 μM was obtained by FP experiments where AMA1 titration was performed against a constant concentration of labeled RON2 as illustrated in Fig. 4E. As expected, the reversed assay design, in which biotinylated RON2 was titrated against a constant level of labeled AMA1, yielded a much smaller FP signal amplitude (Fig. 4F). This is because the FP signal amplitude is largely based on the degree of binding-induced size change. Nevertheless, the observed EC50 also lies in the double-digit nanomolar range (77.1±0.2 nM).
This AMA1-RON2 case study shows, firstly, that MST can yield KD data very comparable to that obtained by other well-established biophysical methods, including FP as a solution-based and SPR as a solid-phase technique. All KDs lie in the double digit nM-range. SPR yielded slightly higher affinities than MST. However, it has previously been described, that due to surface artifacts SPR tends to overestimate the affinity compared to other techniques. [35] Secondly, the experiments also exhibited the ability of MST to detect binding even when the assay was set up in a relatively less favorable manner in terms of size change upon binding: when the larger molecule AMA1 (66 kDa) was labeled and was held constant, titration of the smaller peptide (4.3 kDa) yielded a similar high-affinity binding phase as that obtained in the reverse titration. Thirdly, for this particular system, fluorescent labeling of either binding partner did not adversely affect the binding event, i.e. did not give rise to a significant change in the KD or assay artifacts such as non-specific binding to the fluorescent label. An interesting and more specific aspect of this system is the observation of a second binding phase that was identified in both MST and SPR. Conversely, when the biotinylated RON2 peptide was utilized in FP no second binding phase was observed. This could reflect the fact that the biotinylated RON2 peptide is homogeneously cyclized. However, difficulties associated with the production and handling of a fully-reduced/uncyclized peptide precluded us from performing carefully controlled experiments comparing MST and SPR responses derived from fully-cyclized and fully-open peptide counterparts; thus, the proposed explanation for the observed biphasic behavior remains speculative at this point. Overall, the AMA1-RON2 case study illustrates that MST is a sensitive and versatile biophysical technique for protein-peptide interaction studies. We note that while the RON2 peptide represents a good model system to study the interaction by a range of biophysical techniques without the added encumbrance brought about by the need to produce a second protein, these initial findings need to be further validated through a study using the intact protein pair.
3.3 Analyzing GPCR Membrane Proteins NTS1 and A2aR
Membrane proteins make up a third of the proteome and constitute the majority of drug targets. Their biological importance notwithstanding, they are extremely challenging to work with. G protein-coupled receptors (GPCR) are the largest class of membrane proteins encoded in the human genome [36] and share a common architecture (Fig. 5A): a bundle of seven transmembrane (7TM) helices connected by flexible loop regions. Even though structural data is still scarce it has become apparent that while the 7TM fold is conserved, there is remarkable structural diversity particularly at the extracellular ligand binding side of the proteins. [37] Clearly, a combination of structural knowledge, ligand docking [38,39] and fast and reliable technologies for measurement of ligand binding affinities are necessary and indispensable tools for next generation drug discovery efforts. Typically, ligand binding of GPCRs is studied by radioligand binding assays. However, the availability of radioligands is frequently a limiting factor. Microscale thermophoresis could provide a good alternative to determining the affinities of ligands without the need for radioligands.
Fig. 5. Label-free MST for quantification of GPCR NTS1B ligand binding.

A) Homology model of neurotensin receptor 1 (NTS1; Satita Tapaneeyakorn, Biomembrane structure unit, University of Oxford) based on rhodopsin for the transmembrane regions and the β-adrenergic receptors for the loop regions viewed from the side (left) and top (right). Residues involved in binding of neurotensin (W339, F344 and Y347, cyan), inverse agonist SR48692 (Y324, Y351, T354, F358 and Y359, green) or both (M208, F331 and R327, magenta), as determined from mutagenesis studies [71], are highlighted. B) Label-free MST utilizes NTS1B's intrinsic Trp fluorescence to quantify the binding to neurotensin (KD≤20 nM). C) In agreement with other biophysical techniques, MST using fluorescently labeled neurotensin yields a lower affinity (KD=21±20 nM). D) Using label-free MST, a KD of 15±11 nM for the inverse agonist SR48692 was determined (black circles). Pre-saturating NTS1 with neurotensin right-shifts the KD for SR48692 to 640±50 nM (red squares). Denatured NTS1B did not show binding to SR48692 thus proving specificity (blue triangles).
Neurotensin receptor 1 (NTS1) is one of the few class A GPCRs that can be expressed in E. coli and purified in a functional, ligand-binding form. [40] Using MST we determined the binding affinity of the tridecapeptide ligand neurotensin for a fusion construct of NTS1, NTS1B. [41] Titrating NTS1B to AlexaFluor488-labeled neurotensin gave a KD of 21±20 nM (Fig. 5C). Due to limited amounts of NTS1B protein, saturation could not be reached, which affects the precision of the fit. Thus, we also used the reversed protocol yielding KD≥20 nM (Fig. 5B). The intrinsic UV-fluorescence of NTS1B was exploited and the ligand was titrated, so that saturation was reached. The MST results are in good agreement with previous SPR data showing a dissociation constant of 1–2 nM for the binding of neurotensin to an NTS1 fusion construct, [42] while slightly lower affinities have previously been found for a fluorescently labeled (TAMRA) neurotensin derivative by fluorescence correlation spectroscopy (KD=7±3 nM, Harding, unpublished results), although other fluorophores did not affect the affinity (KD=1.4 nM for Cy5-neurotensin). [43] KD dependence on the choice of fluorophores has previously been observed for other fluorescent ligand derivatives as well. [44] We also studied binding of a known inverse agonist, SR48692, to NTS1B and obtained a KD of 15±11 nM using label-free MST (Fig. 5D). This value is in good agreement with the affinities reported in literature obtained for NTS1 in membrane extracts (KD~3–10 nM [45,46]). A competition assay in which we added SR48692 to receptor pre-saturated with neurotensin (1 μM) shifted the dissociation constant more than an order of magnitude (KD=0.64±0.05 μM; Fig. 5D), confirming specificity of binding and that both compounds compete for the same binding pocket (Fig. 5A). Non-specific binding was further excluded by performing a control experiment with denatured receptor. Interestingly, binding of the agonist neurotensin has an opposite effect on the thermophoretic depletion compared to binding of the inverse agonist SR48692. This could be due to the different structures of the binding partners, however, considering the small size of both ligands (<2 kDa) compared to the receptor (100 kDa), it could even reflect the different structural effects the agonist and the inverse agonist have on the receptor, with neurotensin promoting conformational changes, while SR48692 locks the receptor in an inactive conformation, giving rise to differences in the hydration shell and thus the thermophoretic properties of the complex.
As a second type of GPCR, we tested the adenosine A2A receptor (A2aR) expressed and purified as a fusion with apocytochrome b562RIL as previously described. [47] We used label-free MST to analyze the binding of three orthosteric antagonists, caffeine, theophylline and ZM241385, and one allosteric ligand, amiloride. The affinities for these ligands have been previously determined as Ki=18 μM for caffeine, [48] Ki=14 μM for theophylline, [49,50] Ki=1.2 nM for ZM241385, [51] and Ki=12 μM for amiloride (Katritch et al., manuscript in preparation). These Ki values are based on heterologous competition of radioligands and inhibition of biological function and can thus only give an approximate indication of the KD determined via a direct, biophysical measurement like MST. However, we obtained KDs that were in good accordance: 40±17 μM for caffeine, 5±2 μM for theophylline, ≤43 nM for ZM241385 and 52±7 μM (Fig. 6A) for amiloride (Fig. 6B). Amiloride was not used at concentrations above 250 μM due to solubility problems. This affects the precision of the fit. The signal amplitude for the three orthosteric ligands was low. In contrast amiloride, an allosteric ligand that binds to a different site from caffeine and theophylline [51], induced a strong change in thermophoretic mobility, shown in Fig. 6B. Allosteric ligands are known to alter receptor activity by inducing conformational changes. [52] As amiloride is similar in size to the other tested ligands, the much stronger change in thermophoretic mobility upon binding is likely to be caused by this significant conformational change leading to a reorientation of the receptor's hydration shell. Addition of caffeine and theophylline in presence of saturating amounts of amiloride also had a strong but opposite effect on thermophoresis, indicating non-competitive binding that also produced significant conformational change. Apparent KDs of 84±10 μM for caffeine and 27±6 μM for theophylline were derived. Hence, label-free MST can also be used to investigate allosteric binding in GPCRs.
Fig. 6. Label-free MST for quantification of GPCR A2AR ligand binding.
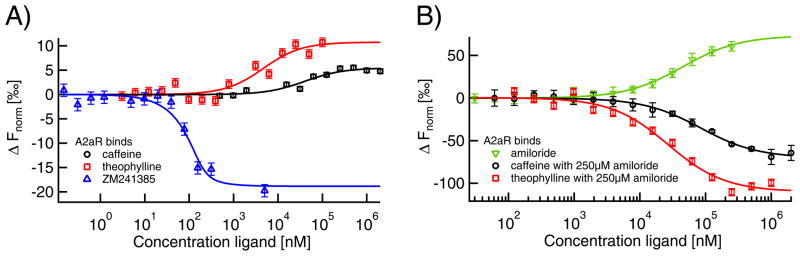
A) Binding of the orthosteric anatagonists caffeine (KD=40±17 μM; black circles), theophylline (KD=5±2 μM; red squares) and ZM241385 (KD≤43 nM; blue triangles) to A2aR induces a comparably small change in thermophoretic mobility. B) In contrast, amiloride-binding (KD=52±7 μM; green inverted triangles) leads to a much larger MST signal amplitude, thus indicating conformational changes upon binding. Comparable signal amplitudes were obtained for the binding of caffeine and theophylline in presence of saturating amiloride concentrations, where the apparent affinities were decreased to 84±10 μM for caffeine and 27±6 μM for theophylline.
This study demonstrates that MST can be used as a quick, sensitive tool to measure binding affinities for difficult systems such as GPCRs which suffer from low expression yields and protein instability. In addition to the pharmaceutical importance of knowing binding affinities, biophysical studies of membrane proteins often require truncations or addition of fusion partners to improve stability and expression, or mutations to facilitate labeling for various techniques. Being able to easily assess the effect of these modifications on the ligand binding capacity to verify the validity of the approach used is invaluable. In comparison to most commonly used techniques, the low sample requirements and the simplicity of the mix-and-read protocol make MST more suited for such routine binding affinity analyses. Compared to alternative techniques such as SPR, MST suffers less from the need for rigorous buffer controls, which can be problematic for membrane proteins in detergent where the exact protein concentration and especially the detergent concentration can be difficult to determine.
3.4 Cooperative Binding within the Ternary Complex: Synaptotagmin
Synaptotagmin-1 (syt1) is the main Ca2+-sensor for fast calcium-regulated neurotransmitter release. [53] It binds five Ca2+-ions with affinities ranging from 50 μM to 10 mM as measured by NMR and ITC. [54,55] Ca2+-binding was reproduced by MST using hydrophobic capillaries and 2.5 mg/ml BSA in order to overcome association of syt1 with the capillaries. An apparent binding affinity of 210–230 μM was determined by MST. [56,57]
Syt1 also binds to membranes containing anionic phospholipids such as phosphatidylinositol 4,5-bisphosphate (PIP2) and this binding is important for its function (Fig. 7A). Binding to PIP2 occurs already in absence of Ca2+ as shown by membrane binding co-sedimentation assays in density gradients with a cytoplasmic fragment of syt1 and artificial liposomes. [58] However, precise quantification of membrane binding is limited because co-sedimentation assays do not report binding under equilibrium conditions. This problem was overcome in a recent study where Förster resonance energy transfer (FRET) was measured from syt1 labeled with a donor fluorophore to liposomes tagged with an acceptor fluorophore. [59] Since close proximity between the two fluorophores is required for FRET (typically well below 5 nm), the results of FRET-based assays fundamentally depend on the labeling positions and binding orientations of syt1 to the membrane.
Fig. 7. Lipid and Ca2+-binding to synaptotagmin-1 by MST.

A). Scheme of the binding interactions of synaptotagmin-1 (green) to Ca2+ (orange) and liposomes containing PIP2 (grey). Note the two possible binding pathways A1–A2 and B1–B2. B) Membrane binding as a function of PIP2 incorporated into 100 nm-sized liposomes (5% PIP2 total lipid concentration). The apparent binding coefficients were 50±10 and 13±3 μM PIP2 in the absence (red squares) and presence (black circles) of 50 μM Ca2+, respectively (see [56] for details). C) Cooperative Ca2+ and PIP2 binding to synaptotagmin-1. Ca2+ and PIP2 binding affinities could be determined by fitting the blue and red axis of the three dimensional MST curve, respectively. In the presence of saturating concentrations of PIP2, the apparent Ca2+-binding constant decreased from ~220 to 3.3 μM Ca2+. Accordingly, in the presence of saturating Ca2+ concentrations, the apparent PIP2-binding constant decreased from ~20 to <2 μM PIP2. Figure adapted with permission from [56]
MST does not suffer from these limitations and allows to measure membrane binding under equilibrium conditions irrespective of the precise labeling of syt1 (Fig. 7B). Indeed, binding of the labeled syt1 to 100 nm-sized PIP2-containing liposomes resulted in a clear change of the MST signal. As apparent from Fig. 7B, the binding strength of syt1 to PIP2-containing liposomes was ~5-fold enhanced in the presence of Ca2+ with readily distinguishable KD-values (50±10 μM in the absence and 13±3 μM in the prescence of Ca2+). The addition of Ca2+ was the only change in an otherwise identical MST assay design. Therefore, the change in KD most likely reflects the influence of Ca2+ on the KD. Similar cooperative Ca2+ and PIP2 binding was previously observed with co-sedimentation assays and FRET. [55,58] However, all these assays (including the MST assay shown in Fig. 7B) suffer from the limitation that Ca2+-binding is not directly measured, but only inferred from binding to the liposomes. Thus, in these assays, Ca2+ and PIP2-binding cooperativity can only be measured in case syt1 first binds to (sufficient) Ca2+ prior to membrane binding (pathway A2–A2 in Fig. 7A) and cannot be distinguished in case syt1 already binds to PIP2 in absence of Ca2+ (pathway B1–B2).
In order to measure binding of Ca2+ to syt1 under saturating conditions of PIP2, we adapted our MST assay and added PIP2 not incorporated into liposomes but directly to the capillaries. Due to high charge of PIP2 (between –3 and –5) [59] even brain-isolated PIP2 (i.e. with long acyl chains) is water soluble up to several mM [60] and short chain fatty acid analogs (such as C8-PIP2) have even higher solubilities and micelle concentrations. By direct addition of PIP2 to the capillaries, the full multidimensional binding spectrum of Ca2+ and PIP2 could be determined with a single set of MST experiments (Fig. 7C). In the presence of saturating concentrations of PIP2 (>10 μM), the apparent binding affinity for Ca2+ was increased more than 40-fold. [56] This interplay between Ca2+, PIP2 and syt1 has profound implications for the mechanisms of neurotransmitter release.
3.5 Competitive Small Molecule Binding to Histone Methyltransferase G9a
The histone methyltransferase (HMT) G9a plays a crucial role in epigenetic regulation and has been implicated in cancer. [61] Thus, G9a inhibitors are expected to exert synergistic effects in epigenetic cancer therapy. A potent new G9a modulator is UNC0321, [62] a BIX-01294 analog. The latter was originally identified as a G9a inhibitor with an IC50 ranging from sub-μM (Thioglo assay and AlphaScreen assay) [63] to low μM (DELFIA format) [64]. Through an antibody-based time-resolved fluorescence assay, BIX-01294 was found to be the first non-peptidomimetic compound that inhibited G9a in a non-competitive mode versus the methyl donor, S-adenosyl-L-methionine (SAM). [64] Furthermore, it was confirmed by co-crystallization with G9a-like protein that BIX-01294 acted as a competitive inhibitor for the peptide substrate. [65] Despite the availability of several different assay formats to measure HMT activity, [66] direct or competition binding assays for HMTs and their potential inhibitors have been largely limited to FP, ITC or differential scanning fluorimetry (DSF) experiments. [63] Thus, MST could provide further information on the G9a system by assessing the direct interaction between the protein and BIX-01294, the protein and its cognate substrate peptide, and the mode of action of BIX-01294 versus both the peptide and the cofactor. We firstly evaluated the affinity of BIX-01294 for G9a via MST. We obtained a KD of 0.7±0.2 μM in both the label-free approach and using NT495-labeled G9a (Fig. 8A), which demonstrates, that the label did not have an influence on the binding. The values are in the same general range established by the enzymatic IC50 values for the compound (reported in multiple papers and summarized in Liu et al 2009 [63] to be between 1.7 and 1.9 μM) and the ITC-derived KD of 0.13 μM (reported in Liu et al 2009 [63]). This further validates both of our MST assays and showcases the ability of MST to detect binding interactions between proteins (G9a; 132 kDa) and small molecules (BIX-01294; 490.6 Da) in spite of the extreme size ratio. We subsequently studied the binding of G9a, labeled with either NT495 or NT647, to its cognate peptide substrate, a biotinylated histone peptide (b-H3(1–21)). Both labeled G9a versions yielded identical KDs, with the former giving a KD of 1.5±0.4 μM and the latter a KD of 1.5±0.2 μM (Fig. 8B). These values are in close agreement with the KMs reported for similar peptide substrates against mammalian G9a. [67] Next, we investigated the mode of inhibitory action of BIX-01294 with respect to either the peptide substrate b-H3(1–21) or the SAM cofactor. Prior to BIX-01294 titration, each component was pre-incubated with NT495-G9a at either a concentration near its respective KD or at a saturating amounts. The results were compared to BIX-01294-G9a binding in absence of the components. As expected, the apparent KD for BIX-01294 against G9a was reduced upon increasing concentrations of b-H3(1–21), suggesting that the compound was competing with the peptide for binding to the histone binding site (Fig. 8C). In contrast, the addition of increasing concentrations of SAM had little effect on the compound's affinity for G9a (Fig. 8D), indicating that the compound was not competing with SAM. These results are in good agreement with previousenzyme kinetic [64] and co-crystallization studies [65] aimed at elucidating the ligands’ mode of action. In summary, the G9a case study demonstrates that MST not only provides enough sensitivity to quantify protein-small molecule interactions but also yields binding affinities that are comparable with those obtained from well-established methods, such as ITC. Moreover, MST has clearly been shown to be able to offer insight on the mode of action of small molecules versus the target protein’s native substrate or cofactor.
Fig. 8. MST analysis of small molecule binding to G9a.

A) The specific interaction of the small molecule BIX-01294 to G9a was quantified via label-free MST (red squares) as well as standard MST with a NT495-label (black circles), where the results were in excellent agreement with each other (KD=0.7±0.2 μM for both) and confirmed previously reported ITC measurements. B) The affinity of the peptide b-H3(1–21) to both G9a-NT495 (black circles) and G9a-NT647 (red squares) was quantified via MST yielding identical KDs (1.5±0.4 μM for G9a-NT495 and 1.5±0.2 μM for G9a-NT647). C) Pre-incubating G9a with b-H3(1–21) right-shifted the KD for BIX-01294 from 0.7 μM (black circles) to 4±1 μM in presence of 2 μM (red squares) and to 37±7 μM (blue triangles) in presence of 100 μM of the peptide suggesting competition at the histone binding site. D) In contrast, addition of SAM in concentrations of 20 μM (KD=1.4±0.3 μM, red squares) and 300 μM (KD=1.2±0.4 μM, blue triangles) only had a minor effect on the apparent KD of BIX-01294 to G9a.
4 Conclusion
We successfully used MST to quantify the interaction of different proteins with a variety of binding partners. In all cases, the determined KDs were in agreement with results obtained by other, well- established biophysical techniques for protein interaction analysis. As MST is a capillary based format and binding-induced changes in thermophoretic mobility are detected via fluorescence, μl volumes and low nM concentrations are sufficient. This results in small sample consumption and allows direct quantification of high affinity protein dimerization as in the case of Grb2. The measured KD of 0.7 μM lies well below the minimally usable μM-concentrations for ITC. [8] The monomeric state and monomer-dimer-transition of Grb2 would not be captured and quantification via ITC would not be possible.
The free solution approach of MST avoids immobilization procedures and possible surface artifacts. Labeling artifacts can be excluded entirely by using label-free MST, which only requires a sufficient intrinsic UV-fluorescence of the protein binding partner. In standard MST, the use of different fluorescent labels provides a means of excluding labeling effects as demonstrated for G9a-binding to b-H3(1–21). Additionally, the fluorescent label can be attached to either of the binding partners to test for possible label-dependent changes of the binding behavior as shown in the AMA1-RON2 experiment. This reversibility in assay design results from the fact that thermophoresis is sensitive to various molecular properties and thus, MST—in contrast to DLS, FP and SPR—does not rely on size changes alone and is not limited by the molecular weight ratio of the binding partners. The strongly preferred assay design for SPR and FP, on the other hand, is to measure interactions by titrating the larger binding partner to a constant amount of the smaller one. However, labeling or immobilizing the smaller ligand bears a higher risk of changing its properties, as the label or anchor is large compared to the ligand. For MST, the reversed assay design of measuring the binding of an unlabeled small molecule to a much bigger, fluorescent protein works equally well, as illustrated by the G9a-BIX-01294 interaction analysis and the label-free GPCR binding studies.
The solution, in which the MST experiment is performed, can be chosen freely allowing to meet the sample's specific buffer requirements. This is invaluable when working with membrane proteins like GPCRs, which typically require strictly optimized buffer conditions and detergents to be stabilized in solution. In addition to buffers with all kinds of additives, proteins embedded in liposomes can be analyzed via MST as well, as demonstrated by the syt1-measurement. MST can also be performed in complex bioliquids such as cell lysate. When combined with the use of fluorescent fusion proteins, as illustrated in the TEM1-BLIP analysis, the fusion protein does not even have to be purified prior to the measurement, but the crude cell extract can directly be used. For the TEM1-BLIP system, the affinities in buffer and lysate were in good agreement. Discrepancies can, however, appear between simple buffers and complex fluids. [17] This demonstrates the importance of analyzing protein interaction in its natural, crowded environment. Apart from cell lysate, MST can also be performed in untreated human blood serum, allowing direct quantification of affinity and concentration of antibodies as disease related biomarkers. [68]
In addition, complex binding modes are readily accessible via MST, e.g. competition in the binding of BIX-01294 and b-H3(1–21) to G9a. Furthermore, the cooperative binding of PIP2 and Ca2+ to syt-1 was quantified via MST. In previous assays, cooperativity had been inferred from Ca2+ binding to membranes. Thus, liposomes with low PIP2 content were used, to which syt-1 only binds in presence of Ca2+. MST with soluble PIP2 allowed to measure under saturating PIP2 conditions. As a result, PIP2 binding in absence of Ca2+ was captured as well, revealing a much higher cooperativity. Due to the low solubility and micelle concentration of PIP2, it would not be possible to perform a comparable assay with a technique requiring higher sample concentrations than MST.
MST provides reliable quantitative information on protein interaction based on a simple protocol, making measurements fast and efficient with low sample consumption. It is sensitive to binding-induced changes in several molecular properties and flexible in assay design. Taken together, this makes MST a highly applicable tool for protein interaction analysis, even for challenging biological systems.
5 Material and Methods
5.1 TEM1-BLIP
Wt-TEM1 was labeled using the Monolith NT Protein Labeling Kit RED (NanoTemper Technologies) according to the supplied protocol. The concentration of labeled TEM1 or Ypet-wt-BLIP was kept constant at 10 nM. The corresponding unlabeled binding partner was titrated in 1:1 dilutions, with the highest final concentration chosen about 20-fold above the KD expected from previously published SPR results. Thus the highest final concentrations were 250 nM wt-BLIP, 6 μM W112A-BLIP and 11 μM W150A-BLIP for the experiments with wt-TEM-NT647. For the measurements with Ypet-BLIP, maximum concentrations of 2 μM wt-TEM and 7.5 μM R243A-TEM were used in buffer, 250 nM TEM in lysate.
A 50 mM Tris-HCl buffer, pH 7.6 containing 150 mM NaCl, 10 mM MgCl2 and 0.05% Tween-20 was used. For the measurements in cell lysate, 20x106 millions 293T cells were lysed in 500 μl RIPA-buffer and centrifuged at 15,000 g for 5 min to remove large aggregates and cell debris. Ypet-BLIP was diluted in 200 μl lysate to a final concentration of 20 nM and mixed with the TEM1 dilution series in buffer to yield a final Ypet-BLIP concentration of 10 nM in 50% lysate.
Measurements were performed in standard treated capillaries (NanoTemper Technologies) on a Monolith NT.115 system (NanoTemper Technologies) using 50% LED and 80% IR-laser power. Laser on and off times were set at 30 s and 5 s, respectively.
5.2 RON2-AMA1
MST experiments were performed on a Monolith NT.115 system (NanoTemper Technologies) using 100% LED and 20% IR-laser power. Laser on and off times were set at 30 s and 5 s, respectively. Recombinant His-tagged AMA1 (His-AMA1) was expressed in Pichia and purified on a nickel column as previously described. [3] The protein was labeled with NT647 (NanoTemper Technologies) and applied at a final concentration of 25 nM. Both unlabeled RON2 peptide and biotinylated RON2 peptide were synthesized by LifeTein LLC (South Plainfield, NJ). A two-fold dilution series was prepared for the unlabeled RON2 in DMSO. Subsequently, 0.5 ìl of each dilution point was transferred to 9.5 ìl labeled AMA1-solution, with the final RON2 concentration ranging from 50 ìM to 1.5 nM, thus maintaining the DMSO concentration at 5% constant sample-to-sample. Samples were filled into hydrophilic capillaries (NanoTemper Technologies) for measurement. FITC labeled RON2 peptide was obtained from Peptide 2.0 (Chantilly, VA), further dissolved in DMSO to produce a 20 μM stock solution and applied at a final concentration of 10 nM. A two-fold dilution series was prepared for unlabeled His-AMA1 in PBS and each dilution point was similarly transferred to FITC-RON2 solution. The final concentrations of His-AMA1 ranged from 7.8 μM to 0.24 nM. Samples were filled into standard-treated capillaries (NanoTemper Technologies) for measurement.
SPR experiments were performed on a ProteOn XPR36 system (Bio-Rad, Hercules, CA) at 25°C using PBS with 0.005% Tween-20 as the running buffer. Immobilization of the His-AMA1 protein was achieved at 30 μl/min on an HTE chip. Samples of the unlabeled RON2 peptide were prepared at final concentration of 500, 167, 55, 18.5 and 6.2 nM and were injected at 30 μl/min in each horizontal channel. Association was monitored for 2 min, dissociation for 10 min. In a separate experiment, immobilization of the biotinylated RON2 (b-Ron2) peptide was achieved on a NLC chip at 100 μl/min. Samples of the His-AMA1 protein were prepared at 300, 100, 33, 11 and 3.7 nM and were injected at 30 μl/min in each horizontal channel. Association was monitored for 2 min, dissociation for 30 min. Kinetic titration data were processed in ProteOn Manager by concatenating the responses of all five analyte concentrations, and by globally fitting to either a simple Langmuir binding model without mass transfer or a heterogeneous ligand model using both buffer blank and interspot as references.
FP experiments were performed on a Viewlux™ high-throughput charge-coupled device (CCD) imager (PerkinElmer, Waltham, MA) using an excitation filter of 480 nm and an emission filter of 540 nm. His-AMA1 was serially diluted in PBS with 0.01% Tween-20 (final concentration: 7.8 μM to 0.24 nM) and mixed with 20 nM FITC-RON2 peptide (final concentration) in a 384-well Greiner (Monroe, NC) solid bottom assay plate. Plates were read after 5 min incubation at room temperature. For the reverse titration, biotinylated RON2 peptide was serially diluted in the same buffer (final peptide concentration started at 100 nM) and was mixed with 25 nM (final concentration) NT495-His-AMA1.
5.3 GPCR
A fusion construct of the rat neurotensin receptor 1, NTS1B, with N- and C-terminal fusion partners, maltose binding protein and thioredoxin respectively, was expressed and purified as described by Attrill et al. [40], with the modification that the ligand affinity column eluate was concentrated using a 1 mL HisTrap Ni2+-column (GE Healthcare), and the eluate thereof was diluted in imidazole- and salt-free buffer (50 mM Tris pH 7.4, 0.1% dodecyl maltoside (w/v), 0.01% cholesteryl hemisuccinate (w/v), 10% glycerol (v/v)) to lower the imidazole concentration to ~85 mM and the sodium chloride concentration to ~50 mM in the final sample to allow salt-sensitive ligand binding, giving a final receptor concentration of ~2.5 μM as determined from A280 and gel electrophoresis against BSA standards. SR48692 was obtained from Sanofi-Aventis and neurotensin was purchased from Sigma Aldrich. A N-terminal cysteine derivative of neurotensin (Alta Bioscience, Birmingham) was labeled with AlexaFluor488 (Sigma Aldrich) by mixing the dye with a three-fold excess of the peptide, adjusting the pH to 7 and incubating for 1 h at room temperature. The labeled compound was purified by HPLC using a 20–60% acetonitrile gradient on a semi-preparative C18 column. Labeling and purity were verified by mass spectrometry. Neurotensin-A488 was lyophilised and subsequently stored in 50 mM Tris pH 7.4.
Two-fold dilution series starting at 375 nM NTS1B in the standard MST experiments and 2.5 μM neurotensin as well as 25 μM SR48692 in the label-free MST experiments were prepared in the following buffer: 50 mM Tris pH 7.4, 0.1% dodecyl maltoside (w/v), 0.01% cholesteryl hemisuccinate (w/v), 10% glycerol (v/v), imidazole 85 mM and sodium chloride 50 mM. Neurotensin-Alexa488 was used at 25 nM, while NTS1B was used at 150 nM. As a control, the SR48692-dilution was tested against a constant concentration of 150 nM thermally denatured NTS1. Due to the fact that concentrations of the receptor in label-free MST experiments were above the KD, the determined KD is a lower limit and affinity can be higher. Lowering receptor concentration will increase resolution. Please note, in label-free experiments the detection limit (i.e. minimum concentration of the fluorescent molecule) depends not only on the number of tryptophanes, but also on their respective position in the protein. Typically, concentrations as low as 100 nM can be used. [18] The fit to the to the quadratic solution of the law of mass action allows to determine even higher affinities than that with high precision.
In the competition experiment, a constant neurotensin concentration of 1 μM was used and SR48692 was diluted 1:1 starting at 50 μM. Label-free experiments were performed at 20% LED and 40% IR-laser power, standard MST experiments at 90% LED power and 20% IR-laser power. Laser on and off times were set at 30 s and 5 s, respectively.
The A2aR was stored and measured in 50 mM K-HEPES pH 7.5 buffer containing 800 mM KCl, 10% glycerol, 0.05% dodecyl maltoside (w/v) and 0.01% cholesterol hemisuccinate (w/v). The concentration of A2aR was determined by measuring protein peak area in an analytical size exclusion chromatogram, and comparing it with protein standards. For the label-free MST experiments, A2aR was used at a constant concentration of 250 nM when testing theophylline-binding and 500 nM in all other experiments. The ligands were added to the buffers in the required concentrations from a 100 mM stock in DMSO. Two-fold dilution series of the ligands were prepared, starting at the following concentrations and resultant maximum DMSO concentrations: 250 μM for amiloride (2.5‰ DMSO), 100 μM for theophylline (0.1% DMSO), 1 mM for caffeine (1% DMSO) and 5 μM for ZM241385 (0.05‰ DMSO). For the competition experiments in presence of 250 μM amiloride, two-fold dilution series of caffeine starting at 2 mM and theophylline (2% DMSO) starting at 1 mM (1% DMSO) were used. Prior to measurement, ligands were incubated with protein for 10 minutes on ice. Experiments were performed at 20% LED and 20% IR-laser power with laser on and off times set at 30 s and 5 s, respectively.
5.4 G9a
G9a was labeled with NT495 or NT647 dye (NanoTemper Technologies) and applied at a final concentration of 50 nM in 50 mM Tris-HCl, pH 7.5, with 150 mM NaCl and 0.05% Tween-20. BIX-01294 was obtained from Sigma-Aldrich (St. Louis, MO) and further dissolved in dH2O to produce a 30 mM stock. A 16-point two-fold dilution series (in dH2O) of BIX-01294 was mixed with G9a solutions to generate a final compound concentration ranging from 500 μM to 15.3 nM. Peptides corresponding to the first 21 N-terminal amino acids of histone H3 followed by a GG linker and a biotinylated lysine (b-H3(1–21)) were purchased from AnaSpec (Fremont, CA). b-H3(1–21) was similarly diluted in dH2O and mixed with labeled G9a to generate a final concentration ranging from 183.6 μM to 5.6 nM. After 15-min incubation at room temperature, samples were filled into standard treated capillaries (NanoTemper Technologies) and MST measurements were performed on a Monolith NT.115 (NanoTemper Technologies) using 100% LED (50% LED for NT647-G9a) and 20% or 40% IR-laser power. Laser on and off times were respectively set at 30 s and 5 s. For competition experiments, labeled G9a was pre-mixed with a constant concentration of b-H3(1–21) or S-adenosylmethionine (SAM) and incubated at room temperature for 15 min. Either compound was added at a concentration near its respective KD (determined using MST for the peptide substrate or based on literature value for SAM [67,69,70]): 2 μM b-H3(1–21) or 20 μM SAM. In a separate experiment, either compound was added at a saturating level (15–50-fold above its KD): 100 μM b-H3(1–21) or 300 μM SAM. The same dilution series of BIX-01294 was added to the pre-formed G9a-b-H3(1–21) or G9a-SAM complex, and MST was measured after 15-min incubation at room temperature.
The interaction between G9a and BIX-01294 was also evaluated using a label-free approach. Specifically, a 16-point titration series of BIX-01294 was mixed with G9a (final concentration: 2 μM) with BIX-01294 final concentration ranging from 200 μM to 6.1 nM. Samples were filled into LabelFree standard treated capillaries (NanoTemper Technologies) and measured on a Monolith NT.LabelFree (NanoTemper Technologies) using 30% LED and 25% IR-laser power. Laser on and off times were also set at 30 s and 5 s, respectively.
Highlights.
Microscale thermophoresis (MST) quantifies protein-protein binding in cell lysate
The KD of Grb2-homodimerization is determined
Competitive binding of small molecules and peptides to proteins is analyzed
GPCR membrane proteins are characterized using label-free MST
Syt-1-binding to PIP2-liposomes and the cooperativity of Ca2+/PIP2 and syt-1 is quantfified
Acknowledgments
The authors thank Dr. Alan Goddard and Eleanor Healey for making AlexaFluor488-neurotensin. We also thank Dr. Masoud Vedadi (University of Toronto) for provision of the G9a protein. Dr. Mohammed Yousef (Bio-Rad Laboratories) is thanked for his expert advice during the initial chip set up on the ProteOn system. The work of SAIS and DB was supported by the Nano Initiative Munich (NIM), the Center for NanoScience (CeNS), the Ludwig Maximilians Universität München (LMU) Initiative Functional Nanosystems and the Deutsche Forschungsgemeinschaft. The work by JSJ and IK was supported by the NIH Common Fund’s Structural Biology Program Grant P50 GM073197.
Footnotes
Conflict of interest statement: Stefan Duhr and Philipp Baaske are founders, Moran Jerabek-Willemsen is an employee of the LMU spin-off company NanoTemper Technologies GmbH, which provides services and devices based on MST.
Publisher's Disclaimer: This is a PDF file of an unedited manuscript that has been accepted for publication. As a service to our customers we are providing this early version of the manuscript. The manuscript will undergo copyediting, typesetting, and review of the resulting proof before it is published in its final citable form. Please note that during the production process errors may be discovered which could affect the content, and all legal disclaimers that apply to the journal pertain.
Contributor Information
Susanne A.I. Seidel, Systems Biophysics and Functional Nanosystems, Ludwig-Maximilians-Universität München, Amalienstrasse 54, 80799 Munich, Germany
Patricia M. Dijkman, Biomembrane Structure Unit, Department of Biochemistry, University of Oxford, South Parks Road, Oxford, OX1 3QU, UK
Wendy A. Lea, Division of Preclinical Innovation, National Center for Advancing Translational Sciences, National Institutes of Health, Bethesda, MD, USA
Geert van den Bogaart, Dept of Tumor Immunology, Radboud University Nijmegen Medical Centre, Geert Grooteplein-Zuid 10, 6525 GA Nijmegen, The Netherlands.
Moran Jerabek-Willemsen, NanoTemper Technologies GmbH, Flöβergasse 4, 81369 Munich, Germany.
Ana Lazic, NanoTemper Technologies, Inc., One Embarcadero Center, Suite 1060, San Francisco, CA 94111 Conflict of interest: Ana Lazic is an employee of NanoTemper Technologies Inc., California, USA.
Jeremiah S. Joseph, The Scripps Research Institute, 10550 North Torrey Pines Road, La Jolla, CA 92037, USA
Prakash Srinivasan, Laboratory of Malaria and Vector Research, National Institute of Allergy and Infectious Diseases, National Institutes of Health, Rockville, MD, USA.
Philipp Baaske, NanoTemper Technologies GmbH, Flöβergasse 4, 81369 Munich, Germany.
Anton Simeonov, Division of Preclinical Innovation, National Center for Advancing Translational Sciences, National Institutes of Health, Bethesda, MD, USA.
Ilia Katritch, The Scripps Research Institute, 10550 North Torrey Pines Road, La Jolla, CA 92037, USA.
Fernando A. Melo, Department of Biochemistry and Molecular Biology and Center for Biomolecular Structure and Function, University of Texas MD Anderson Cancer Center, Unit 1000, 1515 Holcombe Boulevard, Houston, TX 77030, USA
John E. Ladbury, Department of Biochemistry and Molecular Biology and Center for Biomolecular Structure and Function, University of Texas MD Anderson Cancer Center, Unit 1000, 1515 Holcombe Boulevard, Houston, TX 77030, USA
Gideon Schreiber, Department of Biological Chemistry, Weizmann Institute of Science, Rehovot 76100, Israel.
Anthony Watts, Biomembrane Structure Unit, Department of Biochemistry, University of Oxford, South Parks Road, Oxford, OX1 3QU, UK.
Dieter Braun, Systems Biophysics and Functional Nanosystems, Ludwig-Maximilians-Universität München, Amalienstrasse 54, 80799 Munich, Germany.
Stefan Duhr, NanoTemper Technologies GmbH, Flöβergasse 4, 81369 Munich, Germany.
References
- 1.Lin CC, Melo FA, Ghosh R, Suen KM, Stagg LJ, Kirkpatrick J, Arold ST, Ahmed Z, Ladbury JE. Inhibition of Basal FGF Receptor Signaling by Dimeric Grb2. Cell. 2012;149:1514–1524. doi: 10.1016/j.cell.2012.04.033. [DOI] [PubMed] [Google Scholar]
- 2.Besteiro S, Michelin A, Poncet J, Dubremetz JF, Lebrun M. Export of a Toxoplasma gondii rhoptry neck protein complex at the host cell membrane to form the moving junction during invasion. PLoS Pathog. 2009;5:e1000309. doi: 10.1371/journal.ppat.1000309. [DOI] [PMC free article] [PubMed] [Google Scholar]
- 3.Srinivasan P, Beatty WL, Diouf A, Herrera R, Ambroggio X, Moch JK, Tyler JS, Narum DL, Pierce SK, Boothroyd JC, Haynes JD, Miller LH. Binding of Plasmodium merozoite proteins RON2 and AMA1 triggers commitment to invasion. Proc Natl Acad Sci U S A. 2011;108:13275–13280. doi: 10.1073/pnas.1110303108. [DOI] [PMC free article] [PubMed] [Google Scholar]
- 4.Garner MM, Revzin A. A gel electrophoresis method for quantifying the binding of proteins to specific DNA regions: application to components of the Escherichia coli lactose operon regulatory system. Nucl Acids Res. 1981;9:3047–3060. doi: 10.1093/nar/9.13.3047. [DOI] [PMC free article] [PubMed] [Google Scholar]
- 5.Engvall E, Perlmann P. Enzyme-linked immunosorbent assay (ELISA). Quantitative assay of immunoglobulin G. Immunochemistry. 1971;8:871–874. doi: 10.1016/0019-2791(71)90454-x. [DOI] [PubMed] [Google Scholar]
- 6.Hellman LM, Fried MG. Electrophoretic mobility shift assay (EMSA) for detecting protein–nucleic acid interactions. Nat Protoc. 2007;2:1849–1861. doi: 10.1038/nprot.2007.249. [DOI] [PMC free article] [PubMed] [Google Scholar]
- 7.Wiseman Thomas, Williston Samuel, Brandts John F, Lin Lung-Nan. Rapid measurement of binding constants and heats of binding using a new titration calorimeter. Analytical Biochemistry. 1989;179:131–137. doi: 10.1016/0003-2697(89)90213-3. [DOI] [PubMed] [Google Scholar]
- 8.Leavitt S, Freire E. Direct measurement of protein binding energetics by isothermal titration calorimetry. Curr Opin Struct Biol. 2001;11:560–566. doi: 10.1016/s0959-440x(00)00248-7. [DOI] [PubMed] [Google Scholar]
- 9.Ladbury JE, Chowdhry BZ. Sensing the heat: the application of isothermal titration calorimetry to thermodynamic studies of biomolecular interactions. Chem Biol. 1996;3:791–801. doi: 10.1016/s1074-5521(96)90063-0. [DOI] [PubMed] [Google Scholar]
- 10.Fujime S, Ishiwata S. Dynamic study of F-actin by quasielastic scattering of laser light. J Mol Biol. 1971;62:251–265. doi: 10.1016/0022-2836(71)90144-6. [DOI] [PubMed] [Google Scholar]
- 11.Hanlon AD, Larkin MI, Reddick RM. Free-solution, label-free protein-protein interactions characterized by dynamic light scattering. Biophys J. 2010;98:297–304. doi: 10.1016/j.bpj.2009.09.061. [DOI] [PMC free article] [PubMed] [Google Scholar]
- 12.Dandliker WB, Feigen GA. Quantification of the antigen-antibody reaction by the polarization of fluorescence. Biochem Biophys Res Commun. 1961;5:299–304. doi: 10.1016/0006-291x(61)90167-x. [DOI] [PubMed] [Google Scholar]
- 13.Lea WA, Simeonov A. Fluorescence polarization assays in small molecule screening. Expert Opin Drug Discov. 2011;6:17–32. doi: 10.1517/17460441.2011.537322. [DOI] [PMC free article] [PubMed] [Google Scholar]
- 14.Schuck P. Use of surface plasmon resonance to probe the equilibrium and dynamic aspects of interactions between biological macromolecules. Annu Rev Biophys Biomol Struct. 1997;26:541–566. doi: 10.1146/annurev.biophys.26.1.541. [DOI] [PubMed] [Google Scholar]
- 15.Nguyen B, Tanious FA, Wilson WD. Biosensor-surface plasmon resonance: quantitative analysis of small molecule-nucleic acid interactions. Methods. 2007;42:150–161. doi: 10.1016/j.ymeth.2006.09.009. [DOI] [PubMed] [Google Scholar]
- 16.Baksh MM, Kussrow AK, Mileni M, Finn MG, Bornhop DJ. Label-free quantification of membrane-ligand interactions using backscattering interferometry. Nat Biotechnol. 2011;29:357–360. doi: 10.1038/nbt.1790. [DOI] [PMC free article] [PubMed] [Google Scholar]
- 17.Wienken CJ, Baaske P, Rothbauer U, Braun D, Duhr S. Protein-binding assays in biological liquids using microscale thermophoresis. Nat Commun. 2010;1:100. doi: 10.1038/ncomms1093. [DOI] [PubMed] [Google Scholar]
- 18.Seidel SAI, Wienken CJ, Geissler S, Jerabek-Willemsen M, Duhr S, Reiter A, Trauner D, Braun D, Baaske P. Label-free microscale thermophoresis discriminates sites and affinity of protein-ligand binding. Angew Chem Int Ed Engl. 2012;51:10656–10659. doi: 10.1002/anie.201204268. [DOI] [PMC free article] [PubMed] [Google Scholar]
- 19.Duhr S, Braun D. Why molecules move along a temperature gradient. Proc Natl Acad Sci U S A. 2006;103:19678–19682. doi: 10.1073/pnas.0603873103. [DOI] [PMC free article] [PubMed] [Google Scholar]
- 20.Kawahashi Y, Doi N, Takashima H, Tsuda C, Oishi Y, Oyama R, Yonezawa M, Miyamoto-Sato E, Yanagawa H. In vitro protein microarrays for detecting protein-protein interactions: application of a new method for fluorescence labeling of proteins. Proteomics. 2003;3:1236–1243. doi: 10.1002/pmic.200300444. [DOI] [PubMed] [Google Scholar]
- 21.Hohsaka T, Abe R, Shiraga K, Sisido M. Incorporation of fluorescently labeled nonnatural amino acids into proteins in an E. coli in vitro translation system. Nucleic Acids Res Suppl. 2003:271–272. doi: 10.1093/nass/3.1.271. [DOI] [PubMed] [Google Scholar]
- 22.Serwa R, Wilkening I, Del Signore G, Muhlberg M, Claussnitzer I, Weise C, Gerrits M, Hackenberger CPR. Chemoselective Staudinger-phosphite reaction of azides for the phosphorylation of proteins. Angew Chem Int Ed Engl. 2009;48:8234–8239. doi: 10.1002/anie.200902118. [DOI] [PubMed] [Google Scholar]
- 23.Ludwig C. Sitzungsber Akad Wiss Wien Math-Naturwiss Kl. 1856:539. [Google Scholar]
- 24.Ross D, Gaitan M, Locascio LE. Temperature Measurement in Microfluidic Systems Using a Temperature-Dependent Fluorescent Dye. Anal Chem. 2001;73:4117–4123. doi: 10.1021/ac010370l. [DOI] [PubMed] [Google Scholar]
- 25.Royer CA. Probing protein folding and conformational transitions with fluorescence. Chem Rev. 2006;106:1769–1784. doi: 10.1021/cr0404390. [DOI] [PubMed] [Google Scholar]
- 26.Albeck S, Schreiber G. Biophysical Characterization of the Interaction of the β-Lactamase TEM-1 with Its Protein Inhibitor BLIP. Biochemistry. 1999;38:11–21. doi: 10.1021/bi981772z. [DOI] [PubMed] [Google Scholar]
- 27.Reichmann D, Cohen M, Abramovich R, Dym O, Lim D, Strynadka NCJ, Schreiber G. Binding hot spots in the TEM1-BLIP interface in light of its modular architecture. J Mol Biol. 2007;365:663–679. doi: 10.1016/j.jmb.2006.09.076. [DOI] [PubMed] [Google Scholar]
- 28.Wang J, Palzkill T, Chow DC. Structural insight into the kinetics and DeltaCp of interactions between TEM-1 beta-lactamase and beta-lactamase inhibitory protein (BLIP) J Biol Chem. 2009;284:595–609. doi: 10.1074/jbc.M804089200. [DOI] [PMC free article] [PubMed] [Google Scholar]
- 29.Phillip Y, Sherman E, Haran G, Schreiber G. Common crowding agents have only a small effect on protein-protein interactions. Biophys J. 2009;97:875–885. doi: 10.1016/j.bpj.2009.05.026. [DOI] [PMC free article] [PubMed] [Google Scholar]
- 30.Reichmann D, Rahat O, Albeck S, Meged R, Dym O, Schreiber G. The modular architecture of protein-protein binding interfaces. Proc Natl Acad Sci U S A. 2005;102:57–62. doi: 10.1073/pnas.0407280102. [DOI] [PMC free article] [PubMed] [Google Scholar]
- 31.Li N, Batzer A, Daly R, Yajnik V, Skolnik E, Chardin P, Bar-Sagi D, Margolis B, Schlessinger J. Guanine-nucleotide-releasing factor hSos1 binds to Grb2 and links receptor tyrosine kinases to Ras signalling. Nature. 1993;363:85–88. doi: 10.1038/363085a0. [DOI] [PubMed] [Google Scholar]
- 32.Lovatt M, Cooper A, Camilleri P. Energetics of cyclodextrin-induced dissociation of insulin. Eur Biophys J. 1996;24:354–357. doi: 10.1007/BF00180377. [DOI] [PubMed] [Google Scholar]
- 33.Tyler JS, Boothroyd JC. The C-terminus of Toxoplasma RON2 provides the crucial link between AMA1 and the host-associated invasion complex. PLoS Pathog. 2011;7:e1001282. doi: 10.1371/journal.ppat.1001282. [DOI] [PMC free article] [PubMed] [Google Scholar]
- 34.Lamarque M, Besteiro S, Papoin J, Roques M, Vulliez-Le Normand B, Morlon-Guyot J, Dubremetz JF, Fauquenoy S, Tomavo S, Faber BW, Kocken CH, Thomas AW, Boulanger MJ, Bentley GA, Lebrun M. The RON2-AMA1 interaction is a critical step in moving junction-dependent invasion by apicomplexan parasites. PLoS Pathog. 2011;7:e1001276. doi: 10.1371/journal.ppat.1001276. [DOI] [PMC free article] [PubMed] [Google Scholar]
- 35.Jecklin MC, Schauer S, Dumelin CE, Zenobi R. Label-free determination of protein-ligand binding constants using mass spectrometry and validation using surface plasmon resonance and isothermal titration calorimetry. J Mol Recognit. 2009;22:319–329. doi: 10.1002/jmr.951. [DOI] [PubMed] [Google Scholar]
- 36.Fredriksson R, Schioth HB. The repertoire of G-protein-coupled receptors in fully sequenced genomes. Mol Pharmacol. 2005;67:1414–1425. doi: 10.1124/mol.104.009001. [DOI] [PubMed] [Google Scholar]
- 37.Katritch V, Cherezov V, Stevens RC. Diversity and modularity of G protein-coupled receptor structures. Trends Pharmacol Sci. 2012;33:17–27. doi: 10.1016/j.tips.2011.09.003. [DOI] [PMC free article] [PubMed] [Google Scholar]
- 38.Michino M, Abola E, Brooks CL3, Dixon JS, Moult J, Stevens RC. Community-wide assessment of GPCR structure modelling and ligand docking: GPCR Dock 2008. Nat Rev Drug Discov. 2009;8:455–463. doi: 10.1038/nrd2877. [DOI] [PMC free article] [PubMed] [Google Scholar]
- 39.Kufareva I, Rueda M, Katritch V, Stevens RC, Abagyan R. Status of GPCR modeling and docking as reflected by community-wide GPCR Dock 2010 assessment. Structure. 2011;19:1108–1126. doi: 10.1016/j.str.2011.05.012. [DOI] [PMC free article] [PubMed] [Google Scholar]
- 40.Attrill H, Harding PJ, Smith E, Ross S, Watts A. Improved yield of a ligand-binding GPCR expressed in E. coli for structural studies. Protein Expr Purif. 2009;64:32–38. doi: 10.1016/j.pep.2008.10.001. [DOI] [PubMed] [Google Scholar]
- 41.White JF, Trinh LB, Shiloach J, Grisshammer R. Automated large-scale purification of a G protein-coupled receptor for neurotensin. FEBS Lett. 2004;564:289–293. doi: 10.1016/S0014-5793(04)00195-4. [DOI] [PubMed] [Google Scholar]
- 42.Harding PJ, Attrill H, Ross S, Koeppe JR, Kapanidis AN, Watts A. Neurotensin receptor type 1: Escherichia coli expression, purification, characterization and biophysical study. Biochem Soc Trans. 2007;35:760–763. doi: 10.1042/BST0350760. [DOI] [PubMed] [Google Scholar]
- 43.Fang Y, Hong Y, Webb B, Lahiri J. Applications of Biomembranes in Drug Discovery. MRS Bull. 2006;31:541–545. [Google Scholar]
- 44.Beaudet A, Nouel D, Stroh T, Vandenbulcke F, Dal-Farra C, Vincent JP. Fluorescent ligands for studying neuropeptide receptors by confocal microscopy. Braz J Med Biol Res. 1998;31:1479–1489. doi: 10.1590/s0100-879x1998001100017. [DOI] [PubMed] [Google Scholar]
- 45.Gully D, Canton M, Boigegrain R, Jeanjean F, Molimard JC, Poncelet M, Gueudet C, Heaulme M, Leyris R, Brouard A. Biochemical and pharmacological profile of a potent and selective nonpeptide antagonist of the neurotensin receptor. Proc Natl Acad Sci U S A. 1993;90:65–69. doi: 10.1073/pnas.90.1.65. [DOI] [PMC free article] [PubMed] [Google Scholar]
- 46.Labbe-Jullie C, Botto JM, Mas MV, Chabry J, Mazella J, Vincent JP, Gully D, Maffrand JP, Kitabgi P. 3HSR 48692, the first nonpeptide neurotensin antagonist radioligand: characterization of binding properties and evidence for distinct agonist and antagonist binding domains on the rat neurotensin receptor. Mol Pharmacol. 1995;47:1050–1056. [PubMed] [Google Scholar]
- 47.Chun E, Thompson AA, Liu W, Roth CB, Griffith MT, Katritch V, Kunken J, Xu F, Cherezov V, Hanson MA, Stevens RC. Fusion partner toolchest for the stabilization and crystallization of G protein-coupled receptors. Structure. 2012;20:967–976. doi: 10.1016/j.str.2012.04.010. [DOI] [PMC free article] [PubMed] [Google Scholar]
- 48.Ohshita K, Ishiyama H, Oyanagi K, Nakata H, Kobayashi J. Synthesis of hybrid molecules of caffeine and eudistomin D and its effects on adenosine receptors. Bioorg Med Chem. 2007;15:3235–3240. doi: 10.1016/j.bmc.2007.02.043. [DOI] [PubMed] [Google Scholar]
- 49.Peet NP, Dickerson GA, Abdallah AH, Daly JW, Ukena D. Benzo1,2-c:5,4-c'dipyrazoles: non-xanthine adenosine antagonists. J Med Chem. 1988;31:2034–2039. doi: 10.1021/jm00118a032. [DOI] [PubMed] [Google Scholar]
- 50.Shamim MT, Ukena D, Padgett WL, Daly JW. Effects of 8-phenyl and 8-cycloalkyl substituents on the activity of mono-, di-, and trisubstituted alkylxanthines with substitution at the 1-, 3-, and 7-positions. J Med Chem. 1989;32:1231–1237. doi: 10.1021/jm00126a014. [DOI] [PubMed] [Google Scholar]
- 51.Liu W, Chun E, Thompson AA, Chubukov P, Xu F, Katritch V, Han GW, Roth CB, Heitman LH, IJzerman AP, Cherezov V, Stevens RC. Structural basis for allosteric regulation of GPCRs by sodium ions. Science. 2012;337:232–236. doi: 10.1126/science.1219218. [DOI] [PMC free article] [PubMed] [Google Scholar]
- 52.Christopoulos A. Allosteric binding sites on cell-surface receptors: novel targets for drug discovery. Nat Rev Drug Discov. 2002;1:198–210. doi: 10.1038/nrd746. [DOI] [PubMed] [Google Scholar]
- 53.Chapman ER. How does synaptotagmin trigger neurotransmitter release? Annu Rev Biochem. 2008;77:615–641. doi: 10.1146/annurev.biochem.77.062005.101135. [DOI] [PubMed] [Google Scholar]
- 54.Fernandez-Chacon R, Konigstorfer A, Gerber SH, Garcia J, Matos MF, Stevens CF, Brose N, Rizo J, Rosenmund C, Sudhof TC. Synaptotagmin I functions as a calcium regulator of release probability. Nature. 2001;410:41–49. doi: 10.1038/35065004. [DOI] [PubMed] [Google Scholar]
- 55.Radhakrishnan A, Stein A, Jahn R, Fasshauer D. The Ca2+ affinity of synaptotagmin 1 is markedly increased by a specific interaction of its C2B domain with phosphatidylinositol 4,5-bisphosphate. J Biol Chem. 2009;284:25749–25760. doi: 10.1074/jbc.M109.042499. [DOI] [PMC free article] [PubMed] [Google Scholar]
- 56.van den Bogaart G, Meyenberg K, Diederichsen U, Jahn R. Phosphatidylinositol 4,5-bisphosphate increases Ca2+ affinity of synaptotagmin-1 by 40-fold. J Biol Chem. 2012;287:16447–16453. doi: 10.1074/jbc.M112.343418. [DOI] [PMC free article] [PubMed] [Google Scholar]
- 57.van den Bogaart G, Thutupalli S, Risselada JH, Meyenberg K, Holt M, Riedel D, Diederichsen U, Herminghaus S, Grubmuller H, Jahn R. Synaptotagmin-1 may be a distance regulator acting upstream of SNARE nucleation. Nat Struct Mol Biol. 2011;18:805–812. doi: 10.1038/nsmb.2061. [DOI] [PMC free article] [PubMed] [Google Scholar]
- 58.Li L, Shin OH, Rhee JS, Arac D, Rah JC, Rizo J, Sudhof T, Rosenmund C. Phosphatidylinositol phosphates as co-activators of Ca2+ binding to C2 domains of synaptotagmin 1. J Biol Chem. 2006;281:15845–15852. doi: 10.1074/jbc.M600888200. [DOI] [PubMed] [Google Scholar]
- 59.McLaughlin S, Wang J, Gambhir A, Murray D. PIP(2) and proteins: interactions, organization, and information flow. Annu Rev Biophys Biomol Struct. 2002;31:151–175. doi: 10.1146/annurev.biophys.31.082901.134259. [DOI] [PubMed] [Google Scholar]
- 60.Chu A, Stefani E. Phosphatidylinositol 4,5-bisphosphate-induced Ca2+ release from skeletal muscle sarcoplasmic reticulum terminal cisternal membranes. Ca2+ flux and single channel studies. J Biol Chem. 1991;266:7699–7705. [PubMed] [Google Scholar]
- 61.Shinkai Y, Tachibana M. H3K9 methyltransferase G9a and the related molecule GLP. Genes Dev. 2011;25:781–788. doi: 10.1101/gad.2027411. [DOI] [PMC free article] [PubMed] [Google Scholar]
- 62.Liu F, Chen X, Allali-Hassani A, Quinn AM, Wigle TJ, Wasney GA, Dong A, Senisterra G, Chau I, Siarheyeva A, Norris JL, Kireev DB, Jadhav A, Herold JM, Janzen WP, Arrowsmith CH, Frye SV, Brown PJ, Simeonov A, Vedadi M, Jin J. Protein lysine methyltransferase G9a inhibitors: design, synthesis, and structure activity relationships of 2,4-diamino-7-aminoalkoxy-quinazolines. J Med Chem. 2010;53:5844–5857. doi: 10.1021/jm100478y. [DOI] [PMC free article] [PubMed] [Google Scholar]
- 63.Liu F, Chen X, Allali-Hassani A, Quinn AM, Wasney GA, Dong A, Barsyte D, Kozieradzki I, Senisterra G, Chau I, Siarheyeva A, Kireev DB, Jadhav A, Herold JM, Frye SV, Arrowsmith CH, Brown PJ, Simeonov A, Vedadi M, Jin J. Discovery of a 2,4-diamino-7-aminoalkoxyquinazoline as a potent and selective inhibitor of histone lysine methyltransferase G9a. J Med Chem. 2009;52:7950–7953. doi: 10.1021/jm901543m. [DOI] [PMC free article] [PubMed] [Google Scholar]
- 64.Kubicek S, O'Sullivan RJ, August EM, Hickey ER, Zhang Q, Teodoro ML, Rea S, Mechtler K, Kowalski JA, Homon CA, Kelly TA, Jenuwein T. Reversal of H3K9me2 by a small-molecule inhibitor for the G9a histone methyltransferase. Molecular cell. 2007;25:473–481. doi: 10.1016/j.molcel.2007.01.017. [DOI] [PubMed] [Google Scholar]
- 65.Chang Y, Zhang X, Horton JR, Upadhyay AK, Spannhoff A, Liu J, Snyder JP, Bedford MT, Cheng X. Structural basis for G9a-like protein lysine methyltransferase inhibition by BIX-01294. Nature structural & molecular biology. 2009;16:312–317. doi: 10.1038/nsmb.1560. [DOI] [PMC free article] [PubMed] [Google Scholar]
- 66.Quinn AM, Simeonov A. Methods for Activity Analysis of the Proteins that Regulate Histone Methylation. Current chemical genomics. 2011;5:95–105. doi: 10.2174/1875397301005010095. [DOI] [PMC free article] [PubMed] [Google Scholar]
- 67.Patnaik D, Chin HG, Esteve PO, Benner J, Jacobsen SE, Pradhan S. Substrate specificity and kinetic mechanism of mammalian G9a histone H3 methyltransferase. The Journal of biological chemistry. 2004;279:53248–53258. doi: 10.1074/jbc.M409604200. [DOI] [PubMed] [Google Scholar]
- 68.Lippok S, Seidel SAI, Duhr S, Uhland K, Holthoff HP, Jenne D, Braun D. Direct detection of antibody concentration and affinity in human serum using microscale thermophoresis. Anal Chem. 2012;84:3523–3530. doi: 10.1021/ac202923j. [DOI] [PubMed] [Google Scholar]
- 69.Paquet V, Roy M, Pedro L, Gauthier N, Labonte A, Rodenbrock A, Pinard G, Beaudet L, Rodriguez-Suarez R. Technical Note AlphaLISA #2. PerkinElmer; 2010. AlphaLISA G9a Histone H3-Lysine N-methyltransferase Assay. www.perkinelmer.com. [Google Scholar]
- 70.Roy M, Paquet V, Pedro L, Gauthier N, Labonte A, Rodenbrock A, Pinard G, Beaudet L, Rodriguez-Suarez R. Technical Note U-TRF #36. PerkinElmer; 2010. LANCE Ultra G9a Histone H3-Lysine N-methyltransferase Assay. www.perkinelmer.com. [Google Scholar]
- 71.Kitabgi P. Functional domains of the subtype 1 neurotensin receptor (NTS1) Peptides. 2006;27:2461–2468. doi: 10.1016/j.peptides.2006.02.013. [DOI] [PubMed] [Google Scholar]