

Abstract
Quantitative structure–activity relationship (QSAR) models have been developed for a dataset of 3133 compounds defined as either active or inactive against P. falciparum. Since the dataset was strongly biased towards inactive compounds, different sampling approaches were employed to balance the ratio of actives vs. inactives, and models were rigorously validated using both internal and external validation approaches. The balanced accuracy for assessing the antimalarial activities of 70 external compounds was between 87% and 100% depending on the approach used to balance the dataset. Virtual screening of the ChemBridge database using QSAR models identified 176 putative antimalarial compounds that were submitted for experimental validation, along with 42 putative inactives as negative controls. Twenty five (14.2%) computational hits were found to have antimalarial activities with minimal cytotoxicity to mammalian cells, while all 42 putative inactives were confirmed experimentally. Structural inspection of confirmed active hits revealed novel chemical scaffolds, which could be employed as starting points to discover novel antimalarial agents.
Keywords: Antimalarial activity, quantitative structure–activity relationships, virtual screening, experimental confirmation
1 Introduction
Malaria remains one of the most severe infectious diseases in the world. It leads to more than 300 million new clinical cases and ca. 0.7 million deaths each year, mostly among children1,2. About half of the world population, particularly that of underdeveloped countries, is at high risk for malaria infection3.
Malaria is caused by unicellular eukaryotic parasites of the genus Plasmodium. Of the five types of Plasmodium parasites that can infect humans, Plasmodium falciparum is the most lethal strain4. Because of drug resistance, certain prophylactic and therapeutic drugs, such as chloroquine, have lost or are losing their clinical effectiveness. Therefore, novel effective antimalarial compounds continue to be in high demand5.
A powerful modern approach to discovering potential antimalarial compounds is high throughput screening (HTS)5–10. Despite their popularity, current HTS approaches have some important disadvantages. Screening large chemical libraries often leads to very high false positives rates and is still costly. In order to reduce the cost of HTS, the following techniques are frequently applied to reduce the size of chemical library used for screening: (i) test only approved drugs, bioactive compounds, and natural products known to be valuable sources of leads9; (ii) screen the most diverse subsets of chemicals to identify potent scaffolds and then follow up using focused screening9. These approaches often result in active compounds; however, the success rate of finding tractable hits via screening of HTS libraries is typically low.
One of the major factors that have considerable effects on the success rate of HTS is the composition of chemical library. In order to increase the success rate as well as reduce the overall cost of experimental screening, chemical libraries should be refined before conducting HTS. For example, Chong et al.6 identified 189 out of 2,678 existing drugs with more than 50% inhibition of parasite growth at 10µM concentration, which implies a success rate of 7%. Similarly, Weisman et al.9 reported a success rate of 6% for a library of known drugs, bioactive compounds, and natural products. Although such a success rate is relatively high compared with studies on other drug targets, achieving much higher hit rates is still very desirable considering the time and financial resources required for HTS experiments. Therefore, rational approaches such as virtual screening (VS) can help by effectively identifying and prioritizing compounds predicted actives for further experimental tests, thereby reducing the experimental effort and boosting the overall success rate.
VS is a computational drug discovery approach that is employed to evaluate large chemical libraries and identify small numbers of virtual hits for subsequent experimental validation. VS has been traditionally associated with structure-based approaches when the three-dimensional structure of the target protein is known so docking and scoring could be used to select the most probable hit compounds. When targets are unknown or their structures unavailable (as is the case for some antimalarial drug discovery studies), ligand-based strategies relying on the knowledge of chemical structures of active compounds only can be successfully used for VS11.
Our group along with others have been advocating for the increased use of validated Quantitative Structure-Activity Relationship (QSAR) models in VS12–16 (recently reviewed in17). QSAR modeling methods apply machine learning and statistical approaches to establish quantitative relationships between chemical descriptors and biological activities of compounds tested experimentally. The resulting externally predictive QSAR models can be used to screen large virtual libraries to identify putatively active compounds and prioritize them for experimental testing11. This approach shifts the traditional focus of QSAR modeling from achieving statistically significant training set models (where the results are presented in the form of statistical parameters) towards exploiting validated models to prioritize chemicals for subsequent biological evaluation. This focus brings QSAR modeling in tune with the ultimate needs of experimental medicinal chemists to discover bioactive compounds.
There have been several reports in the literature on QSAR studies of antimalarial compounds18–24; however, only few authors have used QSAR models for VS. For example, Mahmoudi et al.22 carried out a QSAR study using a dataset of 395 compounds tested against P. falciparum chloroquine-susceptible strain (3D7) and performed VS on compounds from the Merck Index. One of their Linear Discriminant Analysis (LDA) based models was able to correctly classify 95% of 104 test compounds into active and inactive classes. Then, they successfully predicted the IC50 values of these test compounds with a reasonable accuracy (R2 = 0.76) using a Multiple Linear Regression (MLR) model involving topological indices as compound descriptors. These models were further used to screen 2,000 compounds from the Merck Index and 22 compounds were selected and evaluated in vitro. Six out of the 22 compounds showed antimalarial activities at nanomolar concentrations. Marrero-Ponce et al.23 developed simple LDA-based QSAR models for the prediction of antimalarial activity using TOpological MOlecular COMputer Design - Computer Aided “Rational” Drug Design (TOMOCOMD-CARDD) fingerprints. When using both non-stochastic and stochastic atom-based quadratic fingerprints, the correct classification rates for leave-group-out cross-validation were, on average, 94% and 93%, respectively. They also applied QSAR models to predict antimalarial activity of several acyclic β-enamino esters and arylaminomethylenemalonates and identified a highly active molecule as a promising lead to design novel antimalarial compounds. Montero-Torres et al.24 also developed LDA QSAR models using TOMOCOMD-CARDD strategy, and 83% of test set compounds were classified correctly. Then they evaluated another external set of 17 newly synthesized compounds and compared the predictions with in vitro test results; only one compound showed higher activity than chloroquine. In general, chemical databases screened in these studies were relatively small and covered a limited number of chemical scaffolds. The relatively small size of databases for VS makes it difficult to discover additional active hits and, especially, novel scaffolds, which are in urgent demand considering the rapid emergence of drug-resistant strains of malaria parasites.
In this study, we have analyzed a dataset of 3133 compounds classified as either active or inactive in inhibiting the growth of P. falciparum chloroquine-susceptible strain (3D7)9, by following our general combinatorial QSAR strategy25,26 and predictive QSAR modeling workflow17. The resulting QSAR models were rigorously validated using internal test sets, and were applied to the external evaluation set compounds demonstrating high prediction accuracy. These internally validated and externally predictive models were then used to screen in silico the ChemBridge database27 of approximately 450,000 chemicals. 176 compounds were identified as putative actives using our models, and were then experimentally tested in P. falciparum growth inhibition assays. The experimental validation results indicate both reliability and usefulness of our computational models as efficient predictors to identify novel antimalarial agents.
2 Methodology
2.1 Datasets
A library of 3,133 compounds was screened for their antimalarial activities at St. Jude Children's Research Hospital (the dataset is available on ChemBench http://chembench.mml.unc.edu/, or from Dr. R. K. Guy upon request) using in vitro P. falciparum growth inhibition assays (see Experimental Section). 158 out of these 3,133 compounds had reproducible potency (EC50) better than 2 µM and were considered as active inhibitors8, whereas the remaining 2975 compounds were considered as inactives. This entire dataset of 3,133 compounds was used for QSAR model development and validation. However, because of the substantial prevalence of inactive compounds, the latter class was down-sampled prior to model developments using different strategies as described in the Results section below. The ChemBridge chemical library included within the ZINC database27 (Version 7) was used for VS. After data curation using the standard protocol developed and implemented in our laboratory at UNC28, 454,638 organic compounds were retained for VS.
2.2 Computational Methods
2.2.1 Molecular Descriptors
2.2.1.1 Dragon Descriptors
An ensemble of 929 molecular descriptors was computed with the Dragon software (version 5.4)29 for all compounds (with explicit hydrogen atoms) in our dataset. Descriptors included: 0D-constitutional descriptors (atom and group counts), 1D-functional groups, 1D-atom centered fragments, 2D-topological descriptors, 2D-walk and path counts, 2D-autocorrelations, 2D-connectivity indices, 2D-information indices, 2D-topological charge indices, 2D-Eigenvalue-based indices, 2D-topological descriptors, 2D-edge adjacency indices, 2D-Burden eigenvalues, and various molecular properties such as octanol-water partition coefficient. Descriptors with low variance (standard deviation lower than 0.0001) or missing values were removed. Furthermore, if the correlation coefficient between any two descriptors exceeded 95%, one of them was removed. The final set used in this QSAR study included 298 descriptors. These descriptors were range-scaled, so that their values were within the interval [0, 1]. Definition and calculation procedures for Dragon descriptors and the related references are given in the Handbook of Molecular Descriptors30.
2.2.1.2 ISIDA-2D Fragment Descriptors
The ISIDA Fragmentor software (freely available at http://infochim.u-strasbg.fr) was used to calculate 2D fragment descriptors31,32. Two different types of fragments are included in ISIDA: “sequences” (I) and “augmented atoms” (II). Three sub-types, AB, A, and B are defined for both types. For the fragments I, they represent sequences of atoms and bonds (AB), of atoms only (A), and of bonds only (B). Only shortest paths from one atom to the other are used. For each type of sequence, the minimal (nmin) and maximal (nmax) numbers of constituent atoms are defined (for this study, nmin=2 and nmax=7). An “augmented atom” represents a selected atom with its environment including either both neighboring atoms and bonds (AB), atoms only (A), and bonds only (B). Atomic hybridization (Hy) is taken into account for augmented atoms with the A sub-type. In this study, 429 fragment descriptors were considered.
2.2.2 QSAR Modeling Approaches
2.2.2.1 Dataset Division for Model Development and Validation
Previously, we and other groups33,34 demonstrated that, generally, there is no correlation between the statistical parameters of QSAR models for the training set, such as leave-one-out (LOO) cross-validation R2(q2), and the correlation coefficient R2 between predicted and observed activities of the test set. This statement is also true for classification QSAR models: high classification accuracy for the training and the test set usually do not correlate with each other33,34. Thus, acceptable statistics for the training set only is insufficient to ascertain that the model also has high external predictive power and therefore QSAR models should be rigorously validated using external sets of compounds which were not used to train or select the models34.
Following the standard QSAR modeling workflow17, the antimalarial dataset was randomly split into a modeling set (number of compounds depended on the modeling strategies, cf. Section 3.1 and 3.2) and an external evaluation set of 70 compounds (selected before modeling, cf. Section 3.1 and 3.2). The modeling set was additionally divided multiple times into chemically-diverse training and test sets using the Sphere Exclusion program developed in our computational group and described elsewhere35. The Sphere Exclusion algorithm divides the modeling set into multiple pairs of training and test sets to guarantee that at least in the entire descriptor space, (i) all representative points of the test set are close to at least one representative point of the training set, i.e., test set compounds are within the applicability domain defined by the training set; (ii) given the relative sizes of the training and test sets, the highest portion of the representative points of the training set are close to representative points of the test set; (iii) and the training set is a representative subset of the entire modeling set, i.e., there is no subset in the modeling set not represented by a similar compound in the training set35.
Multiple QSAR models were developed using these training sets and validated using the corresponding test sets. Models with high prediction accuracy assessed by statistical criteria (vide infra) were used for consensus prediction of external evaluation set compounds: each compound was predicted by all models for which it fell within the applicability domain (vide infra), and the consensus predicted value for each compound was rounded to the closest integer (class). The predictivity of the models was evaluated by the consensus Correct Classification Rate (CCR), which is defined below in Formula 3b, for the external evaluation set.
2.2.2.2 Variable Selection k-Nearest Neighbors (kNN) Classification Algorithm
A classification algorithm based on the k-nearest neighbor principle and variable selection was used to develop QSAR models. The program employs a leave-one-out (LOO) cross-validation procedure on the training set and a simulated annealing algorithm in order to select subsets of descriptors that afford models with the highest LOO cross-validation CCR. The procedure starts with the random selection of a predefined subset of descriptors from all descriptors. When the number of nearest neighbors k is higher than one, estimated activities ŷi of compounds excluded by LOO procedure are calculated using the following formula:
| (1) |
where yj is the binary activity of the jth nearest neighbor. Weights wij are defined as:
| (2) |
where dij are Euclidean distances between compound i and its jth nearest neighbor. If k=1, then
| (1a) |
The predicted values are rounded to the closest integer. After each run, CCR (used as an objective target function) and other statistical parameters are calculated as follows:
| (3a) |
| (3b) |
| (3c) |
| (3d) |
| (3e) |
Then, a predefined small number of descriptors are randomly replaced by other descriptors from the original pool, and a new CCR value is obtained. If CCR(new) > CCR(old), the new set of descriptors is accepted; otherwise, if CCR(new) ≤ CCR(old), the new set of descriptors is accepted with probability p = exp ((CCR(new) - CCR(old))/T), or rejected with probability (1-p), where T represents the simulated annealing temperature parameter. During this process, T is decreasing until a predefined threshold. Thus, the optimal (highest) CCR is achieved36,37. For the prediction, the final set of selected descriptors is used, and expressions (1) and (2) with rounding the predicted activity to the closest integer are applied to predict activities of test set compounds. Prediction is estimated as unreliable, if a compound is outside of the applicability domain of the model. The model’s applicability domain is defined by a distance cutoff (i.e., chemical similarity threshold) value between a compound being predicted and its k nearest neighbors of the training set. The applicability domain of QSAR models is discussed below in more detail.
Although there are many different performance metrics (Matthew index, Cohen’s kappa, etc.), we relied primarily on CCR as most relevant for this virtual screening study (see38 for additional discussion on comparing these metrics).
2.2.2.3 Support Vector Machines (SVM)
The description of the original SVM algorithm could be found in many publications, e.g.,39. Briefly, molecular descriptors are first mapped onto a high dimensional feature space using various kernel functions. Then, SVM finds a separating hyperplane with the maximal margin in this high dimensional space in order to separate compounds with different activities. Models built with this machine learning technique allow the prediction of a target property using a set of descriptors solely calculated from the structure of a given compound. In this study, we used the WinSVM program developed in our group (freely available for academic laboratories upon request) implementing the open-source libSVM package39. The WinSVM program provides users with a convenient graphical interface to prepare input data; to split datasets into training and test sets; to set up parameters for SVM grid calculations, including iterative and simultaneous grid optimization of SVM parameters; to launch and follow calculation progress in a powerful graphical interface; to select models with the best prediction accuracy on both training and internal test sets; and to apply them to the external evaluation set as an ensemble consensus model. The program also allows one to visualize molecular structures and produce various plots, making the use of SVM easier and more appropriate for QSAR modeling in order to obtain robust and predictive models and apply them to virtual libraries16.
2.2.3 Selection and Validation of QSAR Models
As mentioned above, model validation is crucial for QSAR modeling. To evaluate the predictive power of a model, CCR (Eq. 3b) values for the training, test, and external evaluation set were calculated. We used sensitivity (SE) and specificity (SP) (Eq. 3c and 3d) as well. SE and SP reflect the accuracy of predicting the compounds of active and inactive classes, respectively. We considered a QSAR model to have an acceptable predictive power, if both of the following conditions were satisfied:
CCR for the LOO cross-validation of the training set (i.e., ) was at least 65%, and CCR for the test set (i.e., CCRtest) was also at least 65%;
For both training and test sets, SE and SP (i.e., , SEtest, SPtest) were at least 60%.
2.2.4 Applicability Domain (AD)
Formally, a QSAR model can predict the target property for any compound for which chemical descriptors can be calculated. However, if it is highly dissimilar from all compounds of the training set, reliable prediction of its activity is unlikely. The concept of AD, previously implemented and widely used in our laboratory12,40,41, was applied to detect and avoid unreliable predictions. In this study, we defined AD as a distance threshold DT between a compound under prediction and its closest nearest neighbors of the training set. It was calculated as follows:
| (4) |
Here, ȳ is the mean Euclidean distance between each compound and its k-nearest neighbors in the model space of the training set (i.e., k is the parameter optimized during QSAR model generation, and the distances are calculated using descriptors selected by the optimized model only), σ is the standard deviation of these Euclidean distances, and Z is a user-defined parameter. We set the default value of this parameter Z at 0.5, which formally places the allowed distance threshold at the mean plus one-half of the standard deviation. We also defined the AD in the entire descriptor space. In this case, the same formula (4) is used, k=1, Z=0.5, and Euclidean distances were calculated using all descriptors. Thus, if the distances of the external compound from its k nearest neighbors (see above) in the training set within either the entire descriptor space or the selected descriptor space exceeded these thresholds, no prediction was made (see example below).
2.2.5 Robustness of QSAR Models
Y-randomization (randomization of response) is a widely used approach to validate the robustness of QSAR models. It consists of rebuilding models using randomized activities of the training set and subsequent assessment of the model statistics. It is expected that models obtained for the training set with randomized activities should have significantly lower values of CCR for the training or the test set than the models built using training set with real activities, or at least these models should not satisfy some of the validation criteria mentioned above. If this condition is not satisfied, models built for this training set with real activities are not reliable and should be discarded. This test was applied to all training sets obtained by data splits into training and test sets and it was repeated three times for each split.
2.3 Virtual Screening and Consensus Prediction Thresholds
The ChemBridge database was screened to identify compounds with potential antimalarial activity. After chemical data curation, Dragon descriptors were generated for each compound and normalized based on the maximum and minimum values of each descriptor in the modeling set. Each validated kNN-Dragon model was then used to predict the activities of compounds that were within the AD. The results for each individual prediction were combined into a consensus prediction: the mean predicted activity was calculated for each compound that was within the respective ADs of multiple models.
Different Consensus Prediction Thresholds (CPTs) were then used to improve the prediction accuracy. Indeed, each individual model could only make binary predictions of compounds as either active (value of 1) or inactive (value of 0). However, since we integrate predictions from the ensemble of models (that passed the acceptance criteria), we could have a situation where different models disagree in their predictions, i.e., a fraction of models may predict the activity of a compound as 1 (active) whereas the remaining fraction of models will predict the activity as 0 (inactive). Thus, the averaged (consensus) predicted activity for each compound is in the [0, 1] range. Formally, compounds with the predicted activity higher than or equal to 0.5 are classified as active and those with the predicted activity lower than 0.5 are classified as inactive. Obviously, the closer the average predicted value to 1 or 0 is, the higher is the concordance among all models and the higher is our confidence in annotating compounds as active or inactive, respectively. Thus, two additional thresholds reflecting this concordance among predictions can be established as a supplementary model’s applicability domain: for instance, selecting only external compounds with predicted activity above 0.9 or below 0.1 would limit the selection of compounds from VS library to a set with higher confidence (but of course it would reduce the total number of compounds for which prediction could be made). Therefore, CPTs were employed in this study to select compounds with high prediction confidence: for instance, CPT 0.9/0.1 means: (i) compounds with predicted activity higher than the upper threshold (0.9) were classified as actives; (ii) compounds with activity lower than 0.1 were classified as inactives; and (iii) compounds with the average predicted activity between the two thresholds were not assigned to any class (inconclusive). The inconclusive compounds were not included when the models’ prediction accuracy was calculated. Different CPTs were tested in this study, from 0.55/0.45 to 0.9/0.1 to analyze their impact on model predictivity.
The percentages of models that were used to make prediction for each compound in the VS database were recorded as well. It was our working hypothesis that the higher was the percentage of models that had a compound within their respective applicability domains and the smaller was the prediction variance across all models, the more accurate the predicted biological activity for this compound should be. Thus, a compound was selected as a hypothetical hit, if and only if (i) it was predicted by at least 50% of the selected models (i.e., it was found within the ADs of these models) and (ii) among those models, at least 90% of them predicted this compound as active. Furthermore, additional filters (implemented in the MOE software42) were also applied to make sure those hits were drug-like molecules. These filters only kept compounds with calculated logP from −0.4 to 5.6, molecular weight from 160 to 480, number of H-bond donors less than 5, and number of H-bond acceptors less than 1043,44.
It should be pointed out that variable selection kNN QSAR method optimizes the selection of a small number of descriptors to produce a statistically acceptable QSAR model. By default, any successful QSAR model captures the correlation between variations in descriptor values and those of the target property. Thus, the significant correlation could be achieved with a small subset of all descriptors. However, some other descriptors may serve as essential determinants of the compound pharmacological class but not be included in the model because of their low variances across the training set (cf. pharmacophoric groups that by default are the same for all active compounds). Therefore, if one searches a database with a small number of variables selected by QSAR models, a similarity screen of the database using the entire pool of descriptors (global similarity) is necessary in addition to model-based activity prediction.
2.4 Hierarchical Cluster Analysis
In this study, we employed the Sequential Agglomerative Hierarchical Nonoverlapping (SAHN) method implemented in the ISIDA/Cluster program32. Briefly, each compound represents one cluster at the start. Then, m compounds are merged iteratively into clusters using their pair wise Euclidean distances stored in an m × m symmetric distance matrix. The two closest objects (molecules or clusters) are iteratively merged to form a new cluster, and then, the distance matrix is updated with the distances between the newly formed cluster and the others, according to the user-specified type of cluster linkage (“complete link” in this study). The process is repeated until one cluster remains. The parent-child relationships between clusters result in a hierarchical data representation or dendrogram. We used ISIDA/Cluster to obtain both dendrogram and the heat map of the proximity matrix (see detailed example in Figure 6)16.
Figure 6.

Pairwise Euclidean distance-based heat map (right) for 429 chemicals and the corresponding clustering dendrogram (left). 9F11
11 The map is colored according to the chemical similarity between compounds (blue-violet, high similarity; yellow-red, low similarity); small clusters with high levels of chemical similarity can be identified on the diagonal of the matrix.
3 Results and Discussion
3.1 Similarity-Based Sampling (SBS) QSAR Modeling Strategy
The chemical library of 3133 compounds tested for antimalarial activity included many more inactive (about 95%) than active (about 5%) compounds. To address this bias (very common in HTS sets), we applied a similarity search procedure using Tanimoto similarity coefficient based on MACCS key fingerprints in MOE, to exclude a large fraction of inactive compounds (dissimilar to actives) in the library (the similarity threshold of 0.83 was set empirically to ensure inactive/active ratio of selected subset to be between two and one). This approach to down-sample the bigger class makes the modeling exercise more difficult because the challenge now is to discriminate active versus inactive compounds that are most similar to actives. Thus, all 158 active compounds and 271 inactive compounds selected by similarity search formed a reduced dataset for QSAR analysis. Of these, 70 compounds (27 actives and 43 inactives) were randomly selected as an external evaluation set, and the remaining 359 compounds (131 actives and 228 inactives) comprised the modeling set. Both Dragon and fragment descriptors were calculated for each compound, whereas kNN and SVM QSAR modeling methods were applied as described in the Methods section. Statistical parameters of selected models and the results of model validation are given in Table 1.
Table 1.
Prediction accuracy of QSAR models developed with different descriptors and modeling methods.
| Method | kNN.1 | WinSVM.2 | Consensus | ||
|---|---|---|---|---|---|
| Descriptor Type | Dragon | ISIDA- Fragments |
Dragon | ISIDA- Fragments |
|
|
No. of Descriptors |
298 | 429 | 298 | 429 | |
|
No. of Accepted Models |
383 | 19 | 33 | 47 | |
|
Prediction on External Evaluation Set (n=70, full coverage).3 | |||||
|
Accuracy |
81% | 79% | 77% | 74% | 79% |
|
CCR4 |
81% | 76% | 74% | 72% | 77% |
|
Sensitivity |
78% | 63% | 59% | 63% | 70% |
|
Specificity |
84% | 88% | 88% | 81% | 84% |
|
Precision |
75% | 77% | 76% | 68% | 73% |
|
Prediction on Excluded Inactives (n=703, full coverage)5 | |||||
| Accuracy | 60% | 71% | 68% | 62% | 65% |
kNN-Dragon models were developed using the UNC-kNN program and kNN-fragments using the ISIDA-kNN program.
SVM models were developed using the WinSVM program implementing the libSVM package (RBF kernel).
Criteria for model selection: for kNN-Dragon: CCRtrain ≥ 0.65 & CCRtest ≥ 0.65; for kNN-fragment: CCRtrain ≥ 0.8 & CCRtest ≥ 0.75. For SVM models, an internal 5-fold cross-validation procedure was used for the modeling set. Models were accepted, if 5-fold-CV accuracy was higher than 72% (Dragon) and 70% (fragments).
Variability of CCR and coverage as a function of the applicability domain could be found in Supplementary Figure 1.
Details of the “excluded inactives” could be found in Section 3.1.
To enable the comparison among different models, all 70 compounds in the external evaluation set were predicted without taking the ADs into account. For models developed using kNN with Dragon descriptors, 383 models that satisfied the acceptance criteria (see Methods section) were selected to predict the antimalarial activity for each compound in the external evaluation set as the average of these 383 predicted values (each individual value being 1 or 0). The accuracy, CCR, sensitivity, and specificity for the external evaluation set were 81%, 81%, 78% and 84%, respectively. For the other three types of models, similar results were obtained (Table 1).
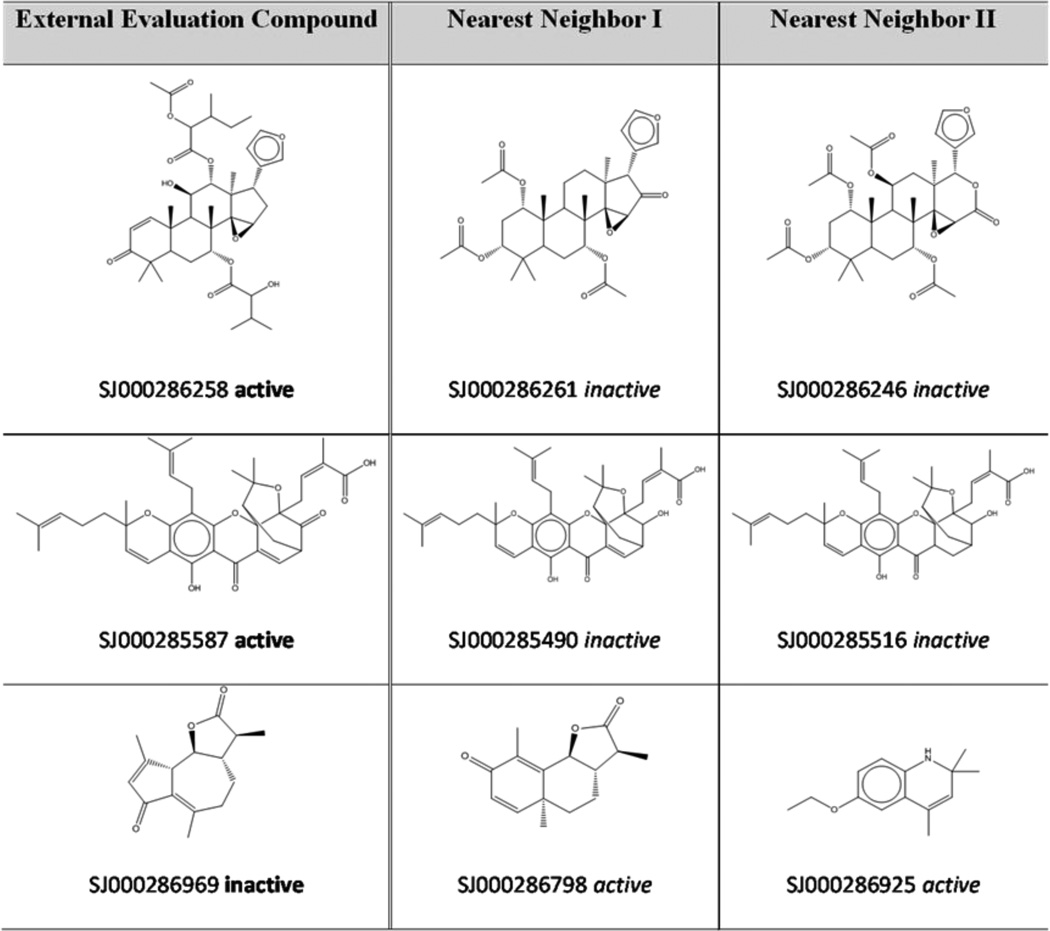
It is of interest to analyze external evaluation set compounds which were predicted incorrectly. Table 2 shows three compounds that are structurally similar to their nearest neighbors in the descriptor space, but belong to a different antimalarial activity class. This observation explains why the antimalarial activities for these external compounds are inaccurately predicted (in the kNN method, the target property of a given compound is calculated as the average of experimental measurements of its nearest neighbors, i.e., most chemically similar compounds). In addition, such analysis may also reveal possible mislabeling of certain compounds in the library. For instance, compounds SJ000285490 and SJ000285587 are very similar to each other; the only structural difference is that a hydroxyl instead of a ketone group is present in the first one. However, these two chemicals are annotated differently: the first one is reported to be inactive, whereas the second one is active. Considering such minor structural change might not be enough for the gain/loss of activity, additional experimental tests are highly recommended to verify the antimalarial activities of these two compounds45.
Table 2.
Examples of external evaluation set compounds mis-predicted by kNN-Dragon models and their nearest neighbors in the modeling set.
 |
Another method to explore and understand why some chemicals were mis-predicted by our models is to study the distribution of active/inactive compounds in the chemical descriptor space and search for clusters and outliers. Thus, the principal component analysis (PCA) of the descriptor matrix was carried out. Two-dimensional projection of the chemical space (i.e., the subspace of first two principal components) is shown in Figure 1a. Red and purple dots represent the 158 active and 271 inactive compounds, respectively, selected by the similarity-based sampling approach. Obviously there is no clear separation between both classes. However, one can distinguish a relatively large cluster of inactive compounds and several small groups of either active or inactive compounds. The presence of this large cluster of inactive compounds affects the distribution of pair wise distances (Figure 1b): there is an extra peak at Euclidean distances equal to 0.4 for inactives. As a consequence, prediction accuracy for inactive compounds, especially those belonging to this large cluster is likely to be better than average. This may explain why all our QSAR models are characterized by higher prediction specificity than sensitivity. Actually, this is a general phenomenon for imbalanced datasets: the prediction accuracy for the minority class is worse than that for the majority class. However, in our study, the active class still has high prediction accuracy, which could also be explained by the representative compound-point distribution of both classes in the chemical space: due to the existence of a large cluster of inactive compounds, fewer inactive compounds are distributed in the areas of the chemistry space occupied by the active compounds (Figure 1a).
Figure 1.

(a) Distribution of active and inactive compounds in the space defined by first two principal components (Dragon descriptors were used in the calculation of principal components); (b) Distributions of Euclidean distances between active (red) and between inactive (purple) compounds.
Our previous experience suggests that consensus prediction always provides the most accurate results40, and naturally avoids the search for the best individual model based on training and test sets statistics. In this study, all four different types of models were used concurrently for consensus activity prediction for each compound. The accuracy, CCR, sensitivity, and specificity of the consensus prediction for the external evaluation set were 79%, 77%, 70% and 84%, respectively; these values are close to those obtained with the best individual models (Table 1).
The Y-randomization test was used to prove the robustness of QSAR models. For example, there were 383 kNN-Dragon models that satisfied the acceptance criteria (see Methods section) for training and test sets. However, no models satisfying these criteria were obtained, if the activities of training sets were randomized. These results indicate that our models are statistically robust.
In this SBS modeling strategy, 2704 of the 2975 inactive compounds in the library were not included in the modeling process, because they were structurally more dissimilar to the 158 actives than those inactives selected by the SBS procedure. As the second stage of the model validation procedure, we applied our selected SBS models to make predictions for these 2704 inactive compounds in the library. Naturally, we expected to find these compounds to be either outside of the models’ applicability domain or inactive. Indeed, 2001 of these compounds were out of the AD calculated based on all Dragon descriptors (Z=0.5). Applying models to the remaining 703 compounds within the AD led to a prediction accuracy of 60%. Meanwhile, kNN-fragment, SVM-fragment and SVM-Dragon models showed slightly higher accuracies, ranging from 62% to 71% (Table 1). In addition to the possible reasons for incorrect prediction of external evaluation set compounds considered above, there are two more possible explanations as to why some of the excluded inactive compounds were predicted as actives. First, compounds that are not close in the global chemical space (defined by the entire descriptor set) may become nearest neighbors in the local chemical space defined by descriptors selected by the model. In other words, the nearest neighbors (in the reduced descriptor space of models built with variable selection) of these excluded inactives might be active. Another possible explanation is based on the use of different similarity measures for excluding inactive compounds dissimilar to actives and for building QSAR models. In this work, the 2704 inactive compounds were excluded by Tanimoto distances based on MACSS key fingerprints. This implies they were not close to the actives in the chemical space described by MACSS descriptors. At the same time, in the modeling procedure, Euclidean distances were used as a measure of dissimilarity between compounds in the descriptor space defined by Dragon or fragment descriptors.
3.2 Diversity-Based Sampling (DBS) QSAR Modeling Strategy
Although the SBS modeling results were reasonable, we wondered if better models could be obtained by using the entire antimalarial library of 3133 compounds. Because the original library was highly unbalanced (158 actives versus 2975 inactives), it was not sensible to build binary QSAR models for the entire dataset. Thus, we have employed a DBS QSAR modeling strategy as follows.
After excluding the same external evaluation set of 70 compounds as for SBS models, we randomly divided the remaining subset of inactive compounds into 10 sets and combined each set with the same set of 131 active molecules. Thus, each modeling set contained a subset of 292 to 294 unique inactive compounds and always the same 131 active compounds. 10 sets of kNN-Dragon models were then developed based on these 10 new modeling sets, and used to predict the same external evaluation set of 70 compounds. The consensus predicted activity of each compound was calculated by averaging the predicted values obtained from all ten sets of models. The workflow of this modeling procedure is illustrated in Figure 2.
Figure 2.

Workflow of DBS modeling procedure and consensus prediction.9
9 P0~P9: predictions for a query compound by all 10 sets of models; the predicted values are between 0 and 1 since they are the average prediction values of all accepted models in each set;
CP1~CP2: if the consensus prediction value for a compound is between upper CPT and 1, a compound is predicted as active; if it is between 0 and lower CPT, it is predicted as inactive; otherwise prediction is inconclusive. A compound is predicted, if it is predicted by at least five sets of models (M1-M10) as active or inactive.
The predictions for external evaluation compounds by each set of models in DBS modeling are listed in Supplementary Table 1. It should be emphasized that external prediction accuracies of all the ten sets of models (i.e., M0~M9 in Figure 2) are lower (Supplemental Table 1, CCR from 60% to 67%) than that of SBS models (Table 1, CCR from 72% to 81%). This observation directly validates the SBS models and is consistent with the results obtained by us previously12. For the similarity-based sampling approach, only inactive compounds in the library that were most similar to active compounds were selected. For the diversity-based sampling approach, the same external evaluation set of 70 compounds was excluded, and then each inactive compound of the remaining part of the library was randomly included in one and only one modeling set. Due to this difference in sampling procedures, the SBS models could distinguish active and structurally similar inactive compounds relatively well. Therefore it is understandable that the prediction accuracy for the same external evaluation set compounds by DBS models was not as good as that by SBS models. Another possible explanation for this observation is that the biological activity (EC50) predicted by both SBS and DBS models was derived from parasite growth inhibition assay (details in Method and Experimental Sections), and it is highly possible that compounds inhibited the growth of parasites through different biological mechanisms. SBS method limited the number of possible mechanisms involved in each modeling set by gathering structurally similar chemicals; however, DBS method was more likely to result in modeling sets with diverse mechanisms of action. Consequently, compared with SBS models, the likelihood for DBS models to identify descriptors with strong correlation to the endpoint is lower, since the signal from any single mechanism is diluted. This could result in a lower predictive accuracy of DBS models.
3.3 Impacts of CPTs on Models’ Predictivity
So far, for the consensus prediction of both SBS and DBS models, a given compound was considered as inactive if its calculated activity was lower than 0.5. Conversely, if the consensus value was higher than or equal to 0.5, the compound was considered as active. Using a single, rigid threshold (0.5 in this study) to distinguish active vs. inactive molecules may lead to inaccurate predictions, especially when predicted values are close to this threshold. To circumvent this problem and improve the predictivity of our models, we applied additional CPT restrictions as described in the Methods. For example, if CPT was 0.9/0.1, and the consensus predicted activity of a compound was higher than 0.9, the compound was predicted as active; if it was lower than 0.1, the compound was predicted as inactive. If the calculated activity was between 0.1 and 0.9, the prediction was “inconclusive” and thus, this compound was not counted in the estimate of prediction accuracy, which inherently led to a decrease in the chemical space coverage of models.
We then studied whether the prediction accuracies of both SBS and DBS models were improved by using CPTs. Dependence of prediction accuracy on the CPT thresholds for external evaluation set is shown in Figure 3. Results indicated that CPT thresholds improved the prediction accuracies of the SBS and DBS models in a drastically different way. When we applied a CPT of 0.9/0.1 to the consensus prediction of the SBS model, CCR, sensitivity, specificity, and coverage were equal to 87%, 83%, 91% and 66%, respectively; thus, as expected, the statistical parameters of the consensus model improved as compared with those obtained with a single activity threshold of 0.5 (Table 1) but at the expense of reducing the chemical space coverage from 100% to 66%. Perhaps surprisingly, all statistical parameters of DBS models at the same CPT value (i.e., CCR, sensitivity, and specificity) reached their theoretical upper limit, i.e., 100%, but the chemical space coverage was reduced to only 11%. Therefore, we can conclude that both CPTs and the sampling strategy contribute to the significant increase of prediction accuracy for DBS models (but of course, at the expense of much lower coverage).
Figure 3.

Dependence of the consensus prediction sensitivity, specificity and coverage of 70 external evaluation set compounds on CPTs (kNN-Dragon models). (a) SBS models; (b) DBS models.
Even though formally better prediction accuracy was achieved, the prediction coverage of DBS models dramatically decreased to 11% when the CPT was equal to 0.9/0.1, whereas it dropped to 66% only for SBS models. To ensure the reliability of consensus prediction by DBS models, a compound was marked as “no prediction” if at least five sets of DBS models predicted it as “inconclusive". As CPT became stricter, more chemicals were predicted as “inconclusive”. Therefore, fewer chemicals were retained in the consensus prediction, which led to the rapid decrease of the prediction coverage. Meanwhile, SBS models were not subjected to such constraint, because they only have one prediction for each compound. This partially explains why the prediction coverage of DBS models decreased much faster than that of SBS models (Supplementary Table 2). At the same time, the remaining eight compounds (CPT = 0.9/0.1) that were still within the applicability domain of the DBS models were predicted with 100% accuracy.
This analysis suggests that users should consider the goals of their QSAR studies carefully when deciding whether to employ SBS or DBS modeling approaches. If the goal is to predict as many compounds as possible, or derive a relatively large set of candidates from VS, the SBS modeling approach is recommended because the prediction coverage will remain high, even if CPT is employed. If prediction accuracy is a major concern (e.g., when experimental resources are limited so a relatively small set of compounds should be selected for testing), DBS modeling approach is more appropriate, provided that large datasets are available for modeling.
3.4 Analysis of Molecular Descriptors
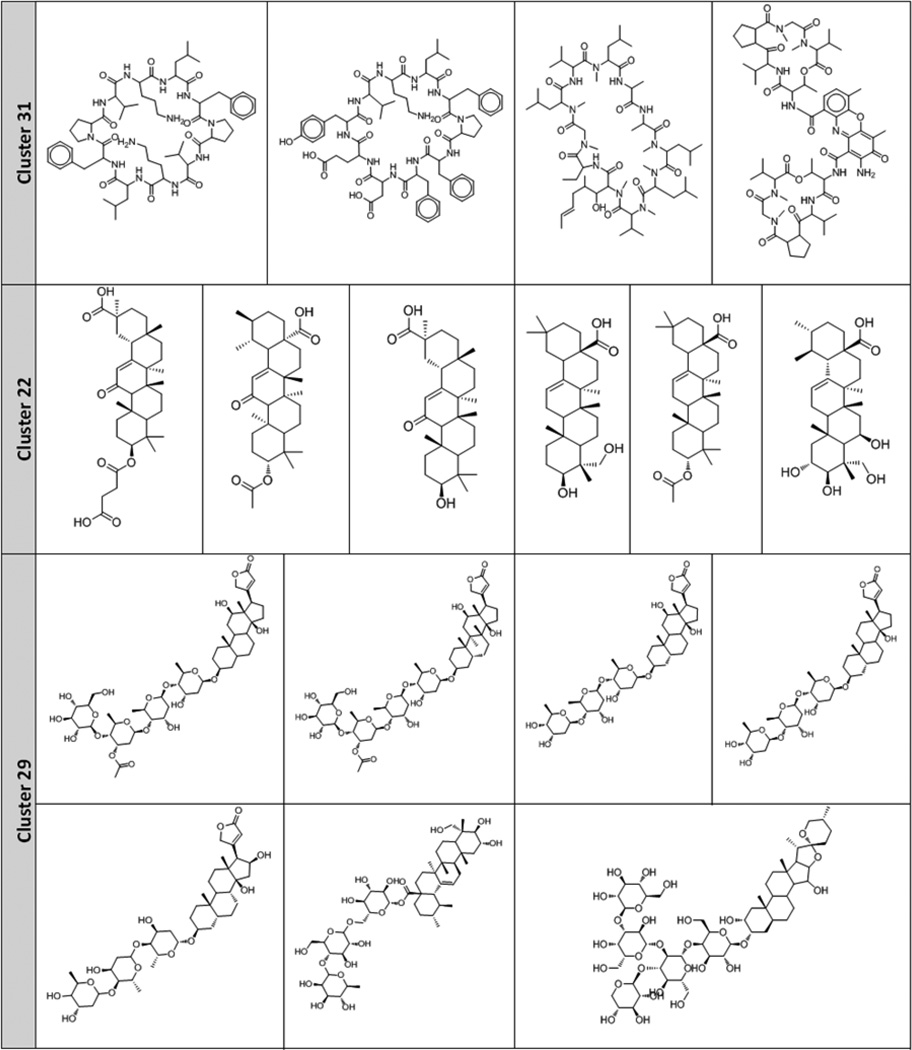
Several descriptors were found to be most frequently used in accepted models, suggesting that they probably play a critical role in expressing the antimalarial activity of organic compounds. We specifically analyzed the Dragon descriptors used in kNN models. In order to make the interpretation of descriptors easier, only functional group descriptors calculated by Dragon are discussed. The most frequently used Dragon functional group descriptors in the kNN-Dragon QSAR models are shown in Table 3, along with their descriptions and frequencies of occurrence in the 383 kNN models that had optimal and acceptable predictivity. These structural features could help provide meaningful interpretations of possible mechanisms of antimalarial activity. Meanwhile, it needs to be pointed out that none of the descriptors alone could explain the observed distribution of antimalarial activities. Thus, we stress that each individual model depends on the combined use of all selected descriptors.
Table 3.
Most frequently used Dragon functional group descriptors in 383 kNN-Dragon models.
| Name of Descriptors |
Percentage Frequency (%) |
Description | Illustration |
|---|---|---|---|
| nCrq | 52 | Number of ring quaternary C(sp3) |  |
| nArCO | 46 | Number of ketones (aromatic) |  |
| O-057 | 28 | Fragment = phenol / enol / carboxyl OH | OH |
| nCONN | 24 | Number of urea (-thio) derivatives | 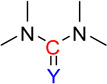 |
| cC-018 | 21 | Fragment = CHX | CHX |
| C-011 | 21 | Fragment = CR3X | CR3X |
| C-019 | 19 | Fragment = CRX | CRX |
| nArNH2 | 19 | Number of primary amines (aromatic) |  |
| nP | 18 | Number of Phosphorous atoms | P |
| nArOH | 18 | Number of aromatic hydroxyls |  |
| nArNR2 | 18 | Number of tertiary amines (aromatic) |  |
| nRCOOR | 18 | Number of esters (aliphatic) |  |
| nRCOOH | 17 | Number of carboxylic acids (aliphatic) |  |
| nCbH | 16 | Number of unsubstituted benzene C(sp2) |  |
Notes
Y = Al or Ar;
Al = H or aliphatic group linked through C;
Ar = aromatic group linked through any atom;
X = electronegative atom (O, N, S, P, halogens).
When analyzing the most frequently used descriptors, we noticed that seven of them had significant differences between the mean values for active versus inactive compounds. These variations could potentially imply that these descriptors could serve as indicators of antimalarial activity. Four descriptors (nCrq, number of ring quaternary C; C-018, the number of fragment “=CHX”; C-011, the number of fragment “CR3X”; and nRCOOR, the number of esters (aliphatic); see Table 3 for their descriptions) have higher mean values for inactive compounds than for active compounds (Figure 4). This result suggests the negative contributions of the corresponding functional groups to the antimalarial activity of chemicals. Three descriptors (nArNH2, number of primary amines (aromatic); nArNR2, number of tertiary amines (aromatic); and nCbH, number of unsubstituted benzene carbons) have lower values for inactive compounds than for active compounds, and the presence of the corresponding groups in chemicals might increase the antimalarial activity.
Figure 4.

Dragon functional group descriptors with different mean values for active vs. inactive compounds in modeling set. Annotations of descriptors are given in Table 4. 8F10
10 Z-score was calculated for each descriptor and labeled on according column.
ISIDA fragment descriptors were also analyzed by calculating the frequency of their occurrence in active and inactive compounds (Figure 5a). We noticed that 316 fragments had differences of their occurrence in actives vs. inactives higher than or equal to 5% (and for 89 fragments, the difference was higher or equal to 20%). In other words, certain fragments occurred more frequently in active than in inactive compounds, and vice versa. Most fragments associated with actives (Figure 5b) are related to amine derivatives (e.g., C-N, C-C-N-C, and C-C-C-N) or aromatic rings including nitrogen atoms (e.g., C*N and C*N*C; * represents aromatic bonds). Although this information is not sufficient to conclude that the presence of these fragments could endow chemicals with antimalarial activities, they should be viewed as having high priority for chemists to consider for synthesis and modifications of potential antimalarial compounds.
Figure 5.

(a) Frequency analysis of ISIDA fragment descriptors (X axis) for active (red) vs. inactive (purple) compounds; (b) List of fragment descriptors that are more frequent in actives than in inactives.
It is interesting to point out that the fragment descriptors representing protonatable amines, such as pyridine and pyrazine, were found to occur more frequently in active than inactive compounds. This observation is in agreement with earlier reports that some antimalarial drugs, e.g., chloroquine, accumulate by a weak base mechanism in the acidic food vacuoles of malaria parasites46.
3.5 Hierarchical Cluster Analysis
The chemical library used in this study is structurally diverse. To gain deeper insight into this dataset, we conducted the cluster analysis of the dataset of 429 molecules selected by a similarity-based sampling approach (158 active and 271 inactive compounds). Our main goal was to identify small groups of structurally similar compounds and assess whether they possessed similar antimalarial activities. For this purpose, compounds were clustered using ISIDA fragment descriptors and the hierarchical algorithm of ISIDA/Cluster as described in the Methods section. The resulting dendrogram and the associated distance matrix represented by a heat map are given in Figure 6. Analysis of the dendrogram revealed 31 clusters with relatively high levels of chemical similarity among compounds (Table 4). Three clusters (Cluster ID 31, 22, and 29, see Table 4) were of the highest interest because all compounds in these clusters belonged to the same activity class. Their structures are shown in Table 5. Four peptides make up Cluster 31, and all of them have antimalarial activity. Previous evidence showed the antimalarial effects of peptide inhibitors of a P. falciparum cysteine proteinase47, suggesting that peptides might be promising agents for antimalarial treatments48. Cluster 22 includes six terpenes, none of which has antimalarial activity. Six cardiac glycosides and one terpene glycoside compose Cluster 29, and they showed no antimalarial activity in the parasite growth inhibition assays. Therefore, it is suggested that terpenes and cardiac glycosides are of lower priority for future antimalarial HTS tests.
Table 4.
Cluster analysis of similarity-based sampling dataset comprising 429 compounds. 5F6
| Cluster ID |
# of Comp |
# of Actives |
# of Inactives |
% Active |
Cluster ID |
# of Comp |
# of Actives |
# of Inactives |
% Active |
|---|---|---|---|---|---|---|---|---|---|
| Cluster 31 | 4 | 4 | 0 | 100% | Cluster 6 | 5 | 2 | 3 | 40% |
| Cluster 8 | 13 | 11 | 2 | 85% | Cluster 27 | 4 | 1 | 3 | 25% |
| Cluster 30 | 9 | 7 | 2 | 78% | Cluster 2 | 15 | 3 | 12 | 20% |
| Cluster 7 | 16 | 12 | 4 | 75% | Cluster 10 | 10 | 2 | 8 | 20% |
| Cluster 13 | 15 | 11 | 4 | 73% | Cluster 18 | 6 | 1 | 5 | 17% |
| Cluster 9 | 6 | 4 | 2 | 67% | Cluster 23 | 12 | 2 | 10 | 17% |
| Cluster 17 | 7 | 5 | 2 | 71% | Cluster 11 | 19 | 3 | 16 | 16% |
| Cluster 14 | 14 | 9 | 5 | 64% | Cluster 19 | 19 | 3 | 16 | 16% |
| Cluster 5 | 36 | 23 | 13 | 64% | Cluster 25 | 28 | 4 | 24 | 14% |
| Cluster 1 | 8 | 5 | 3 | 63% | Cluster 20 | 9 | 1 | 8 | 11% |
| Cluster 16 | 13 | 8 | 5 | 62% | Cluster 26 | 27 | 3 | 24 | 11% |
| Cluster 28 | 8 | 4 | 4 | 50% | Cluster 24 | 22 | 1 | 21 | 5% |
| Cluster 3 | 16 | 7 | 9 | 44% | Cluster 21 | 26 | 1 | 25 | 4% |
| Cluster 15 | 16 | 7 | 9 | 44% | Cluster 22 | 6 | 0 | 6 | 0% |
| Cluster 12 | 23 | 10 | 13 | 43% | Cluster 29 | 7 | 0 | 7 | 0% |
| Cluster 4 | 10 | 4 | 6 | 40% |
Clusters were sorted by the percentage of active compounds. Clusters in bold are shown in Table 5.
Table 5.
Clusters containing compounds of either active (Cluster 31) or inactive (Cluster 22 and 29) compounds.
 |
3.6 VS of ChemBridge Database
VS of the ChemBridge database using our SBS QSAR models initially identified an ensemble of compounds predicted to be active by at least 50% of the models with a stringent AD cutoff (Z=0.5). Drug-likeness filters (see Method section) were then used to remove chemicals that were unlikely to be orally bioavailable. Furthermore, as discussed earlier, the DBS modeling approach is more appropriate when a relatively small set of chemicals with high prediction confidence is expected from VS. Therefore, DBS models and strict CPTs (CPT=0.9/0.1) were applied for hit refining. Finally, given the commercial availability, we considered the remaining 176 organic compounds as putative hits possessing antimalarial activity (Figure 7). In parallel, 42 compounds predicted as inactives were selected as negative controls for experimental confirmation. These 176 VS hits and 42 inactives were then purchased and tested in P. falciparum growth inhibition and mammalian cell drug susceptibility assays (see Experimental Section). Structures and experimental results for these 176 VS hits and 42 inactives are available in the Supporting Information (Supplementary Table 3 and 4).
Figure 7.

A workflow for VS of the ChemBridge chemical library to identify potential antimalarial compounds and prioritize them for subsequent experimental assays. QSAR models indicate both predictive SBS and DBS models.
3.7 Experimental Validation of VS Hits
Out of the 176 VS hits that were experimentally tested, 18 compounds were confirmed to have moderate antimalarial activity, with EC50 ranging from 2 to 8 µM. Furthermore, 7 additional compounds had EC50 less than 2µM in P. falciparum growth inhibition assays against either 3D7 or K1 strains, suggesting a hit rate for relatively potent compounds as high as 4.0% (Table 6 and Supplementary Table 3). The most potent VS hit (SJ000565000) had an EC50 value of 95.6 nM. Therefore, in total 25 (14.2%) VS hits were proved to possess antimalarial activity. At the same time, none of the 42 putative inactives were found to have antimalarial activity (EC50 >10 µM, Supplementary Table 4), confirming the high specificity of our models. This high specificity could ensure the minimum loss of potential antimalarials when refining the hit list in the HTS library. Additionally, results from the drug susceptibility assays against two mammalian cell lines (HepG2 and BJ) showed that our confirmed VS hits had relatively large therapeutic windows, and might have low toxicity in humans.
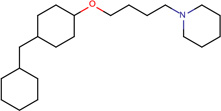
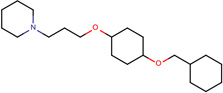
Table 6.
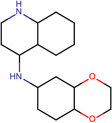
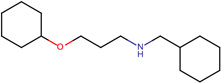
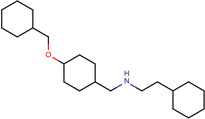
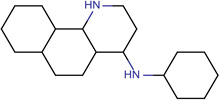
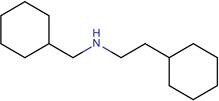
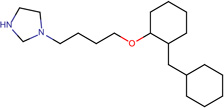
Structures of the 25 confirmed VS hits.
| REGNUM | Smiles | Structure | Core Structure7 | Similarity to Modeling Set Actives 8 |
|---|---|---|---|---|
| SJ000565000 | N12CCC(CC1C(c 3ccnc(cccc4)c34 )OC(=O)C5CC5)C(C=C)C2.Cl | 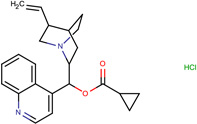 |
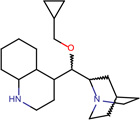 |
0.81 |
| SJ000565062 | C12c(cccc1)cccc2OCC(O)CN(CCCC)CCCC.Cl | 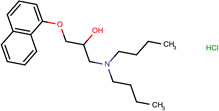 |
 |
0.72 |
| SJ000565033 | C1(cc(C)nc(ccc(OC)c2)c12)Nc(cc3)ccc3OCC | 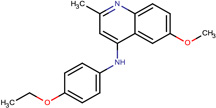 |
 |
0.71 |
| SJ000173328 | C1(cc(C)nc(ccc(OCC)c2)c12)Nc(ccc(c34)OCCO3)c4.Cl | 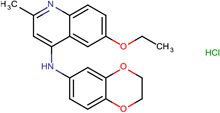 |
 |
0.71 |
| SJ000565039 | c1(ccccc1OCC(O)CNC(C)c2ccccc2)C(C)(C)C.Cl | 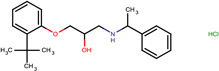 |
 |
0.88 |
| SJ000565002 | c12c(cccc1)ccc(OCC(O)CN(CCCC)CCCC)c2.Cl | 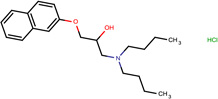 |
- | 0.72 |
| SJ000565115 | N(Cc(cc1)ccc1OCc2ccccc2)C(C)C(O)c3ccccc3.Cl | 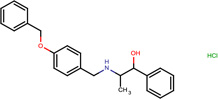 |
 |
0.78 |
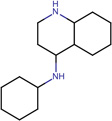
| SJ000565043 | c1(nc(C)cc2Nc3ccc(c(OC)c3)OC)c 2ccc(cccc4)c14 | 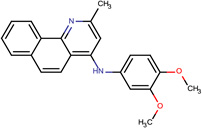 |
 |
0.84 |
| SJ000205073 | N(Cc(cc1)ccc1OCC=C)C(C)C(O)c2ccccc2.Cl | 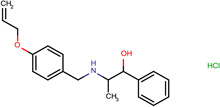 |
 |
0.74 |
| SJ000565072 | n(ccn1CCCOc(cc2)ccc2C(C)(C)c3ccccc3)c1.C(O)(=O)C(O)=O | 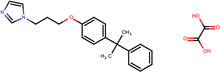 |
 |
0.80 |
| SJ000188975 | N(CCc(c12)cccc1)(CC(O)COc3ccc(cc3C(C)(C)C)C)C2.Cl |  |
 |
0.75 |
| SJ000565117 | n(ccn1CCCCOc2ccccc2Cc3ccccc3)c1.Cl |  |
 |
0.83 |
| SJ000565031 | S(N)(=O)(=O)c1ccc(cc1)Nc(c(cc2)c3cc2[N+](=O)[O-])c(cccc4C)c4n3 | 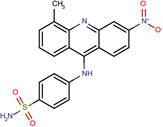 |
 |
0.84 |
| SJ000150414 | c1(ccccc1OCCN(CC)CC)C(CCc2ccccc2)=O.Cl | 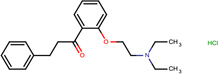 |
 |
0.83 |
| SJ000565025 | c12c(cccc1)ccc(OCCCCCNCCCC)c2 |  |
- | 0.69 |
| SJ000564998 | [n+]1(C)ccc(c2c1Cc(ccc(c3OC)OC)c3)cc(c(OC)c2)OC.[I-] |  |
 |
0.87 |
| SJ000565010 | N1(CCCCC1)CCCCCOc(ccc(c23)cccc2)c3 | 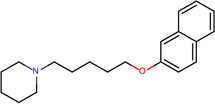 |
 |
0.80 |
| SJ000202592 | C(O)(=O)C(O)=O.c1(cc(Cl)ccc1OCCCCNCC(C)O)Cc2ccccc2 | 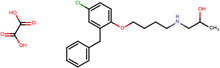 |
 |
0.81 |
| SJ000565067 | C(O)(=O)C(O)=O.c1(ccccc1OCCCCN2CCCCC2)c3ccccc3 |  |
 |
0.77 |
| SJ000183110 | C(O)(=O)C(O)=O.N(C)(CCCCOc(cc1)ccc1CC)Cc2ccccc2 | 0.80 | ||
| SJ000565003 | c1(c(ccc2C(CC3)(CCO3)CNCCC(c4ccccc4)c5ccccc5)OCCO1)c2.Cl |  |
 |
0.71 |
| SJ000565071 | C(O)(=O)C(O)=O.C(c1ccccc1)(=O)c2ccc(cc2)OCCCCN3CCC(CC3)C | 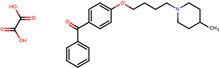 |
 |
0.93 |
| SJ000565094 | N1(CCCCC1)CC(O)COc(cc2)ccc2OCc3ccccc3 | 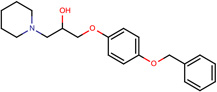 |
 |
0.77 |
| SJ000565077 | C(O)(=O)C(O)=O.N(C)(CCCCOc1cccc(CC)c1)Cc2ccccc2 | - | 0.80 | |
| SJ000565064 | C(CCCC)(CC(OCC)=O)(C1=O)C(=O)N(N1c2ccccc2)c3ccccc3 |  |
 |
0.92 |
Only novel core structures that haven’t been reported in Guiguemde HTS hits were shown.
Tanimoto similarity coefficient based on MACCS key fingerprints in MOE.
We then compared our VS hit rate with the one obtained from HTS. In a comprehensive antimalarial HTS campaign reported by Guiguemde et al.8, 561 out of 309,474 chemicals were confirmed to have EC50 ≤ 2µM against either 3D7 or K1 malaria strains, indicating a hit rate of 0.18%. For comparison, our QSAR models using the same activity threshold featured a significantly higher hit rate of 4.0 %. This result illustrates that rigorously developed QSAR models when applied to VS presents an effective means to refine HTS library, identify putative hits and thus, increase the success rate of biological testing.
Importantly, to estimate the structural novelty of confirmed 25 VS hits, we calculated the pairwise Tanimoto similarity coefficients (using MACCS fingerprints) between the confirmed VS hits and their nearest neighbor compounds from the actives in the modeling set as well as from Guiguemde HTS hits (Figure 8a). Results showed that about 40% of the confirmed VS hits were structurally dissimilar (Tanimoto coefficient < 0.7) with the modeling set actives or Guiguemde HTS hits. We then compared the retrieving power of QSAR models with that of similarity search (Figure 8b), and results indicated that our QSAR models could identify the confirmed VS hits much more efficiently. Both analyses demonstrated the power of QSAR-based VS in identifying novel antimalarial agents.
Figure 8.

(a) Similarity of confirmed VS hits to the Guiguemde HTS hits (solid line) and to the modeling set actives (dotted line) 10F12; (b) Yield curve of retrieving 25 confirmed VS hits from ChemBridge database using different methods.
12 Two chemicals were considered as structurally dissimilar if Tanimoto coefficient < 0.7.
To refine this analysis of chemical novelty of VS hits, we compared the chemical structures of confirmed VS hits with those in Guiguemde HTS hits. Core structures were generated using the same protocol mentioned in the Guiguemde’s paper. 22 unique core structures were derived from the 25 confirmed VS hits, implying a high chemical diversity. Meanwhile, 481 core structures were extracted from Guiguemde’s 1,300 primary HTS hits. After comparison, only 6 core structures of confirmed VS hits could be found in Guiguemde primary HTS hits. 16 novel core structures were thus found in the confirmed VS hits (Table 6 Supplementary Table 5). These “active” core structures should be of great interest for medicinal chemists who are searching for new antimalarial agents.
Finally, we explored a set of fragments frequently present in confirmed VS hits compared with the modeling set actives or Guiguemde HTS hits (Figure 9). This could indicate their positive contributions to the antimalarial activity. Actually, comparing confirmed VS hits with modeling set inactives provided some evidence that these fragments could help gain antimalarial activities for chemicals (Figure 9c). Meanwhile, we noticed that the “amino alcohol” motif was represented in a significant number of ISIDA fragments (Figure 9b), and this class of chemicals is known to possess antimalarial activities9. These results suggest that the use of these “key” fragments during lead optimization could help find more potent antimalarial agents and/or modify existing active structures for enhanced activity.
Figure 9.

Fragments present more frequently in confirmed VS hits than in modeling set actives or Guiguemde HTS hits. (a) Dragon fragment descriptors; (b) ISIDA fragment descriptors; (c) Examples of chemical structures containing importat fragments 11F13
13 For Dragon fragments: --: aromatic single bond; X: heteroatom; Al/Ar: aliphatic/aromatic group; nCbH/nCb-: unsubstituted/substituted benzene C; O-060: Al-O-Ar ; / Ar-O-Ar / R..O..R / R-O-C=X; H-046/H-052: H attached to C0(sp3) with no X/1X attached to next C
For ISIDA fragments: * : aromatic bonds; = : double bond; - : single bond.
4 Conclusions and Future Work
We carried out a combi-QSAR analysis for a library of 3133 organic compounds with known antimalarial activities. Since the dataset was highly imbalanced (only 158 active compounds), we applied similarity- and diversity-based sampling approaches to downsize the set of inactive compounds and generate balanced modeling sets for QSAR studies. For SBS models, only a subset of inactive compounds that were most structurally similar to the actives was included; In DBS models, the structural information associated with the inactive compounds of the entire library was fully utilized. For external validation of QSAR models developed for both similarity- and diversity-based sampling datasets, the same external evaluation set of 70 compounds was used. We rigorously validated all QSAR models and demonstrated that they afforded high prediction accuracy for the external evaluation set. We also applied more restricted activity thresholds, i.e., CPTs, in the consensus prediction of both SBS and DBS models. For SBS models, the CCR of the external evaluation set was 87% (CPT=0.9/0.1), whereas for DBS models, the CCR was as high as 100% (CPT=0.8/0.2 and CPT=0.9/0.1). Restricting the CPTs increased the accuracy but decreased the chemical space coverage for the prediction of the external evaluation set. Therefore, adjusting CPTs is necessary in order to obtain better balance between prediction accuracy and chemical space coverage. It needs to be pointed out that although DBS models gave better prediction accuracy than SBS models, the decline of coverage of DBS models was inevitably far greater than that of SBS models (the prediction coverage of DBS models with CPT=0.9/0.1 decreased to 11%, whereas that of SBS models remained as high as 66%). Therefore, users should decide which approach is more appropriate for QSAR-based predictions depending on their goals and resources, and make the necessary trade off. One could also suggest the use of the Pareto approach instead of using a hard cut off49.
The analysis of most frequent descriptors selected by QSAR models helped interpreting the antimalarial activity in terms of chemical features. For example, we found that some functional group descriptors, such as aromatic ketones and primary amines, were frequently used in kNN-Dragon models, suggesting they may play a critical role in defining antimalarial activity. These results may facilitate the synthesis and modification of novel antimalarial compounds, and shed light on their possible biological mechanisms of action.
Virtual screening of the ChemBridge database using our predictive SBS and DBS models resulted in the selection of 176 VS hits and 42 inactives. Experimental testing verified the high specificity of our models. Moreover, 25 (14.2%) VS hits were confirmed to have antimalarial activity better than 8 µM. These confirmed VS hits were structurally dissimilar from previous HTS hits and modeling set actives; they could be studied as starting points to discover novel antimalarial agents.
In summary, we have developed internally validated and externally predictive QSAR models for antimalarial activity. We have shown that by using the SBS and DBS modeling strategies as well as CPTs, it is possible to develop QSAR models with high external prediction accuracy. VS of large chemical database helped refine HTS library and greatly improve hit rate of experimental testing. Models developed in this study could be used for antimalarial activity prediction of chemical libraries; they can be accessed via the ChemBench portal (http://chembench.mml.unc.edu) established in our laboratory. We will gladly apply our models to screen any chemical libraries of interest to any researchers interested in antimalarial compound discovery.
5 Experimental Section
5.1 P. falciparum Growth Inhibition Assay
All compounds were tested for the inhibition of P. falciparum 3D7 strain growth in concentration-response experiments spanning a series of concentrations from 10 µM to 5 nM8. Parasites were incubated in purified human erythrocytes and media, with or without test compounds for 3 days. Samples of cultures were stained with the DNA dye YOYO-1 and measured by UV flow cytometry. Parasite growth in each sample was correlated with fluorescence signals and was determined relative to infected erythrocytes without test compound. The positive control was mefloquine (consensus EC50 is 0.0398 µM), the reference compound was chloroquine (consensus EC50 is 0.0268 µM), and the negative control is DMSO. All experiments were carried out in triplicate and the experiments themselves carried out twice, on two different days. Concentration response curves were fit and EC50 values were estimated. Each EC50 value represented was the median value from 2 fully independent replicates of dependent triplicates. The 95% confidence limits were calculated as well. These data were then uploaded to the Collaborative Drug Discovery (CDD) database50 and used for sharing the datasets between laboratories.
5.2 Mammalian Cell Drug Susceptibility Assay
Hep G2 and BJ cell lines were purchased from the American Type Culture Collection and were cultured according to recommendations. Exponentially growing cells were plated in white polystyrene flat bottom sterile 384-well tissue culture treated plates (Corning), and incubated overnight at 37 °C in a humidified 5% CO2 incubator. DMSO inhibitor stock solutions were pin-transferred (V&P Scientific) the following day in concentration-response experiments spanning a series of concentrations from 10 µM to 5nM. Plates were placed back in the incubator for 72 h incubation and equilibrated at room temperature for 20 min before addition of 25 µl Cell Titer Glo (Promega) to each well. Plates were shaken on an orbital shaker for 2 min at 500 rpm. Luminescence was read after 15 min on an Envision plate reader (Perkin Elmer)8. All experiments were carried out in triplicate and the experiments themselves carried out twice, on two different days. Concentration response curves were fit and EC50 values were estimated.
Supplementary Material
Acknowledgements
We are grateful to Mr. Christopher Grulke for his assistance with the chemical similarity calculations. We thank Dr. X. Simon Wang for providing the ChemBridge database for virtual screening. We are grateful to CDD for providing access to the datasets used in this study. Finally we thank Jimmy Cui in the High Throughput Screening Center and Andy Lemmoff in the High Throughput Analytical Chemistry Center at the St. Jude Children’s Research Hospital. The studies reported in this paper have been supported by the NIH grants GM076059 and GM66940, the American Lebanese Syrian Associated Charities, and St Jude Children’s Research Hospital.
Footnotes
Abbreviations List: QSAR, Quantitative Structure–Activity Relationship; VS, Virtual Screening; kNN, k-Nearest Neighbors; SVM, Support Vector Machines; AD, Applicability Domain; CPT, Consensus Prediction Threshold; CCR, Correct Classification Rate; HTS, High Throughput Screening; LDA, Linear Discriminant Analysis; MLR, Multiple Linear Regression; CDD, Collaborative Drug Discovery; LOO, Leave-One-Out; SE, Sensitivity; SP, Specificity; SBS, Similarity-Based Sampling; DBS, Diversity-Based Sampling.
Supporting Information
Supporting information (Supplementary figures and tables mentioned above) is available free of charge via the Internet at http://pubs.acs.org.
REFERENCES
- 1.Xue CX, Cui SY, Liu MC, Hu ZD, Fan BT. 3D QSAR studies on antimalarial alkoxylated and hydroxylated chalcones by CoMFA and CoMSIA. Eur J Med Chem. 2004;39:745–753. doi: 10.1016/j.ejmech.2004.05.009. [DOI] [PubMed] [Google Scholar]
- 2.Report WM. World Malaria Report 2010. World Health. 2010:204.
- 3.Xie A, Sivaprakasam P, Doerksen RJ. 3D-QSAR analysis of antimalarial farnesyltransferase inhibitors based on a 2,5-diaminobenzophenone scaffold. Bioorg.Med.Chem. 2006;14:7311–7323. doi: 10.1016/j.bmc.2006.06.041. [DOI] [PubMed] [Google Scholar]
- 4.Wells TNC, Alonso PL, Gutteridge WE. New medicines to improve control and contribute to the eradication of malaria. Nat Rev Drug Discov. 2009;8:879–891. doi: 10.1038/nrd2972. [DOI] [PubMed] [Google Scholar]
- 5.ChEMBL-NTD. 2010 www.ebi.ac.uk/chemblntd.
- 6.Chong CR, Chen X, Shi L, Liu JO, Sullivan DJ., Jr A clinical drug library screen identifies astemizole as an antimalarial agent. Nat.Chem.Biol. 2006;2:415–416. doi: 10.1038/nchembio806. [DOI] [PubMed] [Google Scholar]
- 7.Gamo F-JJ, Sanz LM, Vidal J, de Cozar C, Alvarez E, Lavandera J-LL, Vanderwall DE, Green DVS, Kumar V, Hasan S, Brown JR, Peishoff CE, Cardon LR, Garcia-Bustos JF. Thousands of chemical starting points for antimalarial lead identification. Nature. 2010;465:305–310. doi: 10.1038/nature09107. [DOI] [PubMed] [Google Scholar]
- 8.Guiguemde WA, Shelat AA, Bouck D, Duffy S, Crowther GJ, Davis PH, Smithson DC, Connelly M, Clark J, Zhu F, Jiménez-Díaz MB, Martinez MS, Wilson EB, Tripathi AK, Gut J, Sharlow ER, Bathurst I, El Mazouni F, Fowble JW, Forquer I, McGinley PL, Castro S, Angulo-Barturen I, Ferrer S, Rosenthal PJ, Derisi JL, Sullivan DJ, Lazo JS, Roos DS, Riscoe MK, Phillips MA, Rathod PK, Van Voorhis WC, Avery VM, Guy RK. Chemical genetics of Plasmodium falciparum. Nature. 2010;465:311–315. doi: 10.1038/nature09099. [DOI] [PMC free article] [PubMed] [Google Scholar]
- 9.Weisman JL, Liou AP, Shelat AA, Cohen FE, Guy RK, DeRisi JL. Searching for new antimalarial therapeutics amongst known drugs. Chem.Biol.Drug Des. 2006;67:409–416. doi: 10.1111/j.1747-0285.2006.00391.x. [DOI] [PMC free article] [PubMed] [Google Scholar]
- 10.Yuan J, Cheng KC-C, Johnson RL, Huang R, Pattaradilokrat S, Liu A, Guha R, Fidock DA, Inglese J, Wellems TE, Austin CP, Su X-z. Chemical Genomic Profiling for Antimalarial Therapies, Response Signatures, and Molecular Targets. Science. 2011;333:724–729. doi: 10.1126/science.1205216. (80-) [DOI] [PMC free article] [PubMed] [Google Scholar]
- 11.Varnek A, Tropsha A. Chemoinformatics Approaches to Virtual Screening. London: RSC; 2008. [Google Scholar]
- 12.Zhu H, Tropsha A, Fourches D, Varnek A, Papa E, Gramatica P, Oberg T, Dao P, Cherkasov A, Tetko IV. Combinatorial QSAR Modeling of Chemical Toxicants Tested against Tetrahymena pyriformis. J Chem.Inf.Model. 2008 doi: 10.1021/ci700443v. [DOI] [PubMed] [Google Scholar]
- 13.Zhang S, Golbraikh A, Oloff S, Kohn H, Tropsha A. A novel automated lazy learning QSAR (ALL-QSAR) approach: method development, applications, and virtual screening of chemical databases using validated ALL-QSAR models. J.Chem.Inf.Model. 2006;46:1984–1995. doi: 10.1021/ci060132x. [DOI] [PMC free article] [PubMed] [Google Scholar]
- 14.Shen M, LeTiran A, Xiao Y, Golbraikh A, Kohn H, Tropsha A. Quantitative structure-activity relationship analysis of functionalized amino acid anticonvulsant agents using k nearest neighbor and simulated annealing PLS methods. J.Med.Chem. 2002;45:2811–2823. doi: 10.1021/jm010488u. [DOI] [PubMed] [Google Scholar]
- 15.Oloff S, Mailman RB, Tropsha A. Application of validated QSAR models of D1 dopaminergic antagonists for database mining. J.Med.Chem. 2005;48:7322–7332. doi: 10.1021/jm049116m. [DOI] [PubMed] [Google Scholar]
- 16.Fourches D, Barnes JC, Day NC, Bradley P, Reed JZ, Tropsha A. Cheminformatics analysis of assertions mined from literature that describe druginduced liver injury in different species. Chem.Res.Toxicol. 2010;23:171–183. doi: 10.1021/tx900326k. [DOI] [PMC free article] [PubMed] [Google Scholar]
- 17.Tropsha A, Golbraikh A. Predictive QSAR modeling workflow, model applicability domains, and virtual screening. Curr.Pharm.Des. 2007;13:3494–3504. doi: 10.2174/138161207782794257. [DOI] [PubMed] [Google Scholar]
- 18.Agrawal VK, Sharma R, Khadikar PV. QSAR studies on antimalarial substituted phenyl analogues and their N(omega)-oxides. Bioorg.Med.Chem. 2002;10:1361–1366. doi: 10.1016/s0968-0896(01)00399-6. [DOI] [PubMed] [Google Scholar]
- 19.Cardoso FJ, de Figueiredo AF, da Silva LM, de Miranda RM, de Almeida RC, Pinheiro JC. A study on antimalarial artemisinin derivatives using MEP maps and multivariate QSAR. J.Mol.Model. 2008;14:39–48. doi: 10.1007/s00894-007-0249-9. [DOI] [PubMed] [Google Scholar]
- 20.Cruz-Monteagudo M, Borges F, Perez GM, Cordeiro MN. Computational modeling tools for the design of potent antimalarial bisbenzamidines: overcoming the antimalarial potential of pentamidine. Bioorg.Med.Chem. 2007;15:5322–5339. doi: 10.1016/j.bmc.2007.05.034. [DOI] [PubMed] [Google Scholar]
- 21.Katritzky AR, Kulshyn OV, Stoyanova-Slavova I, Dobchev DA, Kuanar M, Fara DC, Karelson M. Antimalarial activity: a QSAR modeling using CODESSA PRO software. Bioorg.Med.Chem. 2006;14:2333–2357. doi: 10.1016/j.bmc.2005.11.015. [DOI] [PubMed] [Google Scholar]
- 22.Mahmoudi N, Julian-Ortiz JV, Ciceron L, Galvez J, Mazier D, Danis M, Derouin F, Garcia-Domenech R. Identification of new antimalarial drugs by linear discriminant analysis and topological virtual screening. J.Antimicrob.Chemother. 2006;57:489–497. doi: 10.1093/jac/dki470. [DOI] [PubMed] [Google Scholar]
- 23.Marrero-Ponce Y, Iyarreta-Veitia M, Montero-Torres A, Romero-Zaldivar C, Brandt CA, Avila PE, Kirchgatter K, Machado Y. Ligand-based virtual screening and in silico design of new antimalarial compounds using nonstochastic and stochastic total and atom-type quadratic maps. J.Chem.Inf.Model. 2005;45:1082–1100. doi: 10.1021/ci050085t. [DOI] [PubMed] [Google Scholar]
- 24.Montero-Torres A, Garcia-Sanchez RN, Marrero-Ponce Y, Machado-Tugores Y, Nogal-Ruiz JJ, Martinez-Fernandez AR, Aran VJ, Ochoa C, Meneses-Marcel A, Torrens F. Non-stochastic quadratic fingerprints and LDA-based QSAR models in hit and lead generation through virtual screening: theoretical and experimental assessment of a promising method for the discovery of new antimalarial compounds. Eur.J.Med.Chem. 2006;41:483–493. doi: 10.1016/j.ejmech.2005.12.010. [DOI] [PubMed] [Google Scholar]
- 25.de Cerqueira LP, Golbraikh A, Oloff S, Xiao Y, Tropsha A. Combinatorial QSAR modeling of P-glycoprotein substrates. J.Chem.Inf.Model. 2006;46:1245–1254. doi: 10.1021/ci0504317. [DOI] [PubMed] [Google Scholar]
- 26.Kovatcheva A, Golbraikh A, Oloff S, Xiao YD, Zheng W, Wolschann P, Buchbauer G, Tropsha A. Combinatorial QSAR of ambergris fragrance compounds. J.Chem.Inf.Comput.Sci. 2004;44:582–595. doi: 10.1021/ci034203t. [DOI] [PubMed] [Google Scholar]
- 27.Irwin JJ, Shoichet BK. ZINC--a free database of commercially available compounds for virtual screening. J. Chem. Inf. Model. 2004;45:177–182. doi: 10.1021/ci049714. [DOI] [PMC free article] [PubMed] [Google Scholar]
- 28.Fourches D, Muratov E, Tropsha A. Trust, but verify: on the importance of chemical structure curation in cheminformatics and QSAR modeling research. J.Chem.Inf.Model. 2010;50:1189–1204. doi: 10.1021/ci100176x. [DOI] [PMC free article] [PubMed] [Google Scholar]
- 29.Talete srl. DRAGON. 2006. [Google Scholar]
- 30.Todeschini V, R C. Handbook of Molecular Descriptors. Weinheim Germany: Wiley; 2000. [Google Scholar]
- 31.Varnek A, Fourches D, Hoonakker F, Solov’ev VP. Substructural fragments: an universal language to encode reactions, molecular and supramolecular structures. J.Comput.Aided Mol.Des. 2005;19:693–703. doi: 10.1007/s10822-005-9008-0. [DOI] [PubMed] [Google Scholar]
- 32.Fourches D, Horvath D, Klimchuk O, Gaudin C, Vayer P, Solov’ev V, Hoonakker F, Tetko I, Marcou G. ISIDA - Platform for virtual screening based on fragment and pharmacophoric descriptors. Curr.Comput.Aided.Drug.Des. 2008;4:191–198. [Google Scholar]
- 33.Kubinyi H, Hamprecht FA, Mietzner T. Three-dimensional quantitative similarityactivity relationships 3D QSiAR. from SEAL similarity matrices. J.Med.Chem. 1998;41:2553–2564. doi: 10.1021/jm970732a. [DOI] [PubMed] [Google Scholar]
- 34.Golbraikh A, Tropsha A. Beware of q2! J.Mol.Graph.Model. 2002;20:269–276. doi: 10.1016/s1093-3263(01)00123-1. [DOI] [PubMed] [Google Scholar]
- 35.Golbraikh A, Shen M, Xiao Z, Xiao YD, Lee KH, Tropsha A. Rational selection of training and test sets for the development of validated QSAR models. J.Comput.Aided Mol.Des. 2003;17:241–253. doi: 10.1023/a:1025386326946. [DOI] [PubMed] [Google Scholar]
- 36.Zheng W, Tropsha A. Novel Variable Selection Quantitative Structure-Property Relationship Approach Based on the k-Nearest-Neighbor Principle. J. Chem. Inf. Model. 2000;40:185–194. doi: 10.1021/ci980033m. [DOI] [PubMed] [Google Scholar]
- 37.Xiao Z, Xiao YD, Feng J, Golbraikh A, Tropsha A, Lee KH. Antitumor agents-213 Modeling of epipodophyllotoxin derivatives using variable selection k nearest neighbor QSAR method. J.Med.Chem. 2002;45:2294–2309. doi: 10.1021/jm0105427. [DOI] [PubMed] [Google Scholar]
- 38.Nicholls A. What do we know and when do we know it? J. Comput. Aided Mol. Des. 22:239–255. doi: 10.1007/s10822-008-9170-2. [DOI] [PMC free article] [PubMed] [Google Scholar]
- 39.Chang C, Lin C. LIBSVM : a library for support vector machines. Software. 2001 available at http://www.csie.ntu.edu.tw/~cjlin/libsvm.
- 40.Zhang L, Zhu H, Oprea TI, Golbraikh A, Tropsha A. QSAR modeling of the bloodbrain barrier permeability for diverse organic compounds. Pharm.Res. 2008;25:1902–1914. doi: 10.1007/s11095-008-9609-0. [DOI] [PubMed] [Google Scholar]
- 41.Tropsha A, Gramatica P, Gombar VK. The Importance of Being Earnest: Validation is the Absolute Essential for Successful Application and Interpretation of QSPR Models. QSAR Comb.Sci. 2003;22:69–77. [Google Scholar]
- 42.Molecular Operating Environment. 2009. [Google Scholar]
- 43.Ghose AK, Viswanadhan VN, Wendoloski JJ. A knowledge-based approach in designing combinatorial or medicinal chemistry libraries for drug discovery. 1. A qualitative and quantitative characterization of known drug databases. J.Comb.Chem. 1999;1:55–68. doi: 10.1021/cc9800071. [DOI] [PubMed] [Google Scholar]
- 44.Lipinski CA, Lombardo F, Dominy BW, Feeney PJ. Experimental and computational approaches to estimate solubility and permeability in drug discovery and development settings. Adv.Drug Deliv.Rev. 2001;46:3–26. doi: 10.1016/s0169-409x(00)00129-0. [DOI] [PubMed] [Google Scholar]
- 45.Ekins S, Williams AJ. Precompetitive preclinical ADME/Tox data: set it free on the web to facilitate computational model building and assist drug development. Lab on a Chip. 10:13–22. doi: 10.1039/b917760b. [DOI] [PubMed] [Google Scholar]
- 46.Slater AFG. Chloroquine: Mechanism of drug action and resistance in plasmodium falciparum. Pharmacol.Ther. 1993;57:203–235. doi: 10.1016/0163-7258(93)90056-j. [DOI] [PubMed] [Google Scholar]
- 47.Rosenthal PJ, Wollish WS, Palmer JT, Rasnick D. Antimalarial effects of peptide inhibitors of a Plasmodium falciparum cysteine proteinase. J.Clin.Invest. 1991;88:1467–1472. doi: 10.1172/JCI115456. [DOI] [PMC free article] [PubMed] [Google Scholar]
- 48.Rosenthal PJ. Antimalarial drug discovery: old and new approaches. Journal of Experimental Biology. 2003;206:3735–3744. doi: 10.1242/jeb.00589. [DOI] [PubMed] [Google Scholar]
- 49.Ekins S, Honeycutt JD, Metz JT. Evolving molecules using multi-objective optimization: applying to ADME/Tox. Drug Discov.Today. 2010;15:451–460. doi: 10.1016/j.drudis.2010.04.003. [DOI] [PubMed] [Google Scholar]
- 50.Collaborative Drug Discovery. 2010 http://www.collaborativedrug.com/
Associated Data
This section collects any data citations, data availability statements, or supplementary materials included in this article.