

Abstract
The amount of weight loss attained after Roux-en-Y gastric bypass (RYGB) surgery follows a wide and normal distribution, and recent evidence indicates that this weight loss is due to physiological, rather than mechanical, mechanisms. To identify potential genetic factors associated with weight loss after RYGB, we performed a genome-wide association study (GWAS) of 693 individuals undergoing RYGB and then replicated this analysis in an independent population of 327 individuals undergoing RYGB. We found that a 15q26.1 locus near ST8SIA2 and SLCO3A1 was significantly associated with weight loss after RYGB. Expression of ST8SIA2 in omental fat of these individuals at baseline was significantly associated with weight loss after RYGB. Gene expression analysis in RYGB and weight-matched, sham-operated (WMS) mice revealed that expression of St8sia2 and Slco3a1 was significantly altered in metabolically active tissues in RYGB-treated compared to WMS mice. These findings provide strong evidence for specific genetic influences on weight loss after RYGB and underscore the biological nature of the response to RYGB.
Main Text
It is estimated that 66% of adults in the United States are overweight and that half of these individuals are obese (MIM 601665).1 Behavioral interventions and pharmacotherapies for the treatment of obesity have had limited long-term success.2–4 In contrast, Roux-en-Y gastric bypass (RYGB) results in substantial and durable weight loss.5 Individuals who undergo RYGB initially lose an average of 35%–40% of their baseline weight and maintain approximately 80% of this weight loss over time.6 Despite its overall effectiveness, however, not all people lose the same amount of weight or obtain the same clinical benefits from surgery. Indeed, there is a wide and normal distribution of weight-loss outcomes after RYGB,7,8 and the drivers of this variation remain largely unknown. Although a variety of clinical, demographic, psychological, and technical (surgical) predictors have been identified, these factors alone and in combination have been able to explain only a small fraction of the observed variation in weight loss after surgery.7
Recent evidence indicates that RYGB affects weight loss through multiple physiological rather than mechanical mechanisms by altering the regulation of energy expenditure, food intake, food preference, and reward pathways.9–11 Weight loss after RYGB thus appears to result from biological mechanisms, which could be subject to genetic influences. We have recently demonstrated that genetically related individuals who live separately and undergo gastric bypass have highly similar weight-loss outcomes, whereas cohabitating but genetically unrelated individuals have weight-loss outcomes similar to randomly paired, unrelated controls.8 These observations suggest that genetic factors explain up to 70% of the variability in weight loss after RYGB.8 Although the specific genetic contributors are currently unknown, their identification would enhance our understanding of the mechanisms of weight loss and help identify those individuals for whom RYGB is most likely to be effective. Preferential targeting of surgical therapies to this population could be expected to improve the overall risk:benefit profile for RYGB.
To identify genetic factors contributing to weight loss after RYGB, we performed an exploratory genome-wide association study (GWAS) of genetically unrelated individuals undergoing RYGB (Table S1 in the Supplemental Data available with this article online). All studies were conducted in accordance with the ethical standards of the Human Studies Committee of the Massachusetts General Hospital (MGH), and written informed consent was obtained for all participants. From February 2000 until April 2007, we obtained consent from 1,018 (97%) individuals undergoing RYGB at MGH to collect and analyze tissue samples removed at the time of surgery. Surgical procedures and the study population have been described previously.8,12,13 Intraoperative liver, subcutaneous fat, omental fat, and stomach tissues were collected in RNAlater (Ambion and Applied Biosystems) and stored at −80°. Genomic DNA was extracted from liver samples, and 950 samples were successfully genotyped with the Illumina HumanHap 650Y BeadChip array at the Gene Expression Laboratory of Rosetta Inpharmatics. Data were converted to PLINK format,14 and all genetic analyses were performed with this software. SNPs with a call rate of <90%, a minor-allele frequency of <1%, or a Hardy-Weinberg equilibrium p value of <10−6 were excluded from analysis, yielding an initial set of 524,284 SNPs. Using identity-by-descent (IBD) coefficients for all pairs of individuals, we identified 36 related individuals (relatedness was defined as having an IBD coefficient ≥0.125). One person per family was included for analysis on the basis of completeness of phenotypic and genetic information. In addition, one person was removed as a result of having >10% of genetic information missing. Of the remaining 930 individuals, 806 self-identified as white. To address population structure not captured through self-identification, we used EIGENSTRAT15 to calculate principal components of ancestry and identified 25 outlying samples (greater than six standard deviations from the mean), resulting in a sample of 781 participants of confirmed European descent. Of these 781 samples, 693 had a weight nadir value, were not on weight-lowering medications after surgery, did not have cancer, acute kidney disease, or end-stage renal disease, and were thus included in the GWAS data set. We imputed 2,199,259 genotypes by using MACH software16 and the reference set of HapMap CEU (CEPH [Utah residents with ancestry from northern and western Europe]) SNPs (release 21). After we applied the strict quality-control measures described above, 1,943,170 SNPs were available for analysis. Demographic and clinical information was extracted from a review of electronic medical records. Weight nadir was defined as the lowest weight at least 10 months after surgery. Chart-derived nadir weight was validated through telephone interviews in a subset of participants (n = 306); there was a 97% correlation between these two sources. We calculated percent weight loss (%WL) at weight nadir by subtracting the individual’s weight at nadir from his or her presurgical weight and then dividing by the individual’s presurgical weight.
We assessed the association between SNPs and %WL at the weight nadir after RYGB by using additive models of quantitative-trait associations. We compared each SNP to %WL by using additive linear-regression models. We observed a genomic control inflation factor of 1.01, indicating minimal inflation of test statistics as a result of population stratification (Figure S1). SNPs that were within a 250 kb window of each other and that had an r2 > 0.5 were not considered independent; only the strongest associated SNP for each block was considered for follow up. In this first-stage GWAS, we identified 102 marginally significant (p < 5 × 10⁻⁵) SNPs (Figure 1; Table S3), representing 26 independent loci (pairwise r2 < 0.5).
Figure 1.
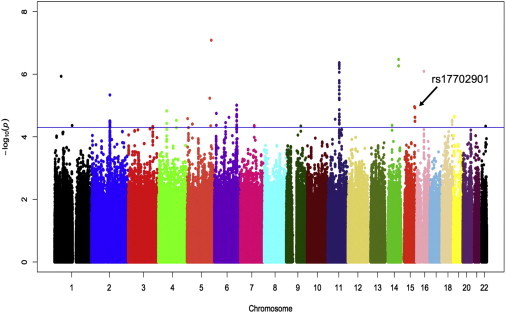
Manhattan Plot of the Results of a GWAS of 1,943,373 SNPs and Percent Weight Loss after RYGB in 693 Individuals of European Descent
Each SNP is plotted relative to its chromosomal location (x axis) and –log10 p value (left y axis). The horizontal blue line represents p < 5 × 10⁻⁵.
We carried forward the most significantly associated SNP in each independent region for validation in an independent cohort of individuals undergoing RYGB (Table S2). From May 2007 until October 2009, we enrolled 369 individuals undergoing RYGB; all individuals self-identified as white. Tissue collection methods and clinical-trait extraction were as described for the first-stage GWAS cohort. DNA was extracted from liver samples, and genotypes were assessed with a Sequenom MassARRAY at the Eli and Edythe Broad Institute (Cambridge, MA). Three hundred twenty-seven individuals had complete genetic and phenotypic information and were included in the final data set. We successfully genotyped 22 SNPs and analyzed associations with %WL by using additive linear-regression models. We then conducted meta-analysis on results of the original and validation cohorts by using fixed-effects models and inverse variance weights. Using a strict Bonferroni correction based on the SNPs genotyped in the replication cohort (pBonferroni = 0.0023), we identified the SNP rs17702901 at 15q26.1 as significantly associated with %WL after RYGB (preplication = 0.0020). The magnitude of effect was similar in the GWAS and replication cohorts; β = −6.70 (95% confidence interval [CI]: −9.7 to −3.7) and −6.52 (95% CI: −10.7 to −2.4), respectively (Table 1), and the meta-analyzed magnitude of effect was −6.64 (pmeta-analyzed = 7.4 × 10⁻⁸). Thus, individuals with one copy of the minor allele of rs17702901 lost, on average, 6.64% less weight after RYGB than those who had two copies of the major allele at this locus. Although the direction of the effect (β) for 13 of the 22 SNPs in the replication cohort was the same as in the GWAS cohort, none of the other 21 candidate SNPs reached statistical significance in either the validation cohort or by meta-analysis.
Table 1.
SNP Association Results between Genotype and Percent Weight Loss after RYGB among Individuals of European Descent in a GWAS and Replication Cohort
| SNP | Closest Gene | MIM | Distance (bp)a | Reduced WL Alleleb | Chr | Position |
GWAS Cohort (N = 693) |
Replication Cohort (N = 327) |
Combined (N = 1020) |
||||||
|---|---|---|---|---|---|---|---|---|---|---|---|---|---|---|---|
| β | SE3 | p Value | β | SE3 | p Value | β | SE3 | p Value | |||||||
| rs10515808 | C1QTNF2 | ____ | 23283 | A | 5 | 159753509 | −4.06 | 0.75 | 8.2 × 10⁻⁸ | −1.17 | 1.05 | 0.27 | −3.08 | 0.61 | 4.2 × 10⁻⁷ |
| rs7158359 | FOXN3 | 602628 | 28219 | G | 14 | 88664048 | −3.03 | 0.59 | 3.4 × 10⁻⁷ | −0.41 | 0.92 | 0.65 | −2.27 | 0.5 | 4.6 × 10⁻⁶ |
| rs7129556 | AQP11 | 609914 | 631 | T | 11 | 76977696 | −2.80 | 0.55 | 4.3 × 10⁻⁷ | −0.60 | 0.78 | 0.44 | −2.07 | 0.45 | 3.9 × 10⁻⁶ |
| rs7185923 | SALL1 | 602218 | 60335 | C | 16 | 49802988 | −2.40 | 0.49 | 8.1 × 10⁻⁷ | −0.63 | 0.75 | 0.40 | −1.89 | 0.41 | 3.5 × 10⁻⁶ |
| rs934760 | CLASP1 | 605852 | 0 | G | 2 | 12202672 | −4.28 | 0.93 | 4.6 × 10⁻⁶ | 0.56 | 1.37 | 0.68 | −2.76 | 0.77 | 6.3 × 10⁻⁵ |
| rs1104959 | RPS14 | 130620 | 79991 | G | 5 | 149722429 | −7.75 | 1.70 | 5.8 × 10⁻⁶ | −0.86 | 1.95 | 0.66 | −4.79 | 1.28 | 1.8 × 10⁻⁴ |
| rs9403832 | STXBP5 | 604586 | 0 | T | 6 | 14795969 | −2.17 | 0.49 | 9.8 × 10⁻⁶ | 0.51 | 0.72 | 0.47 | −1.30 | 0.4 | 0.001 |
| rs17702901 | ST8SIA2 | 602546 | 6728 | A | 15 | 90731415 | −6.70 | 1.52 | 1.1 × 10⁻⁵ | −6.52 | 2.12 | 0.002 | −6.64 | 1.23 | 7.4 × 10⁻⁸ |
| rs588217 | INTS4 | 611348 | 6391 | A | 11 | 77261024 | −2.55 | 0.58 | 1.4 × 10⁻⁵ | −0.59 | 0.80 | 0.47 | −1.87 | 0.47 | 7.0 × 10⁻⁵ |
| rs6554217 | KDR | 191306 | 32755 | C | 4 | 55672161 | −2.89 | 0.66 | 1.5 × 10⁻⁵ | 1.43 | 0.99 | 0.15 | −1.56 | 0.55 | 1.1 × 10⁻⁵ |
| rs9357419 | PHACTR1 | 608723 | 134845 | C | 6 | 12690973 | −2.95 | 0.68 | 1.8 × 10⁻⁵ | 0.56 | 0.98 | 0.56 | −1.80 | 0.56 | 0.001 |
| rs11260025 | CLEC4G | ____ | 12090 | T | 19 | 7687753 | −3.33 | 0.78 | 2.2 × 10⁻⁵ | 1.06 | 1.07 | 0.32 | −1.82 | 0.63 | 0.004 |
| rs12803675 | OR4C13 | ____ | 71848 | T | 11 | 49858702 | −3.69 | 0.87 | 2.7 × 10⁻⁵ | −0.37 | 1.44 | 0.79 | −2.80 | 0.75 | 1.8 × 10⁻⁴ |
| rs13380914 | FBXO15 | 609093 | 578813 | A | 18 | 69312767 | −2.50 | 0.59 | 2.9 × 10⁻⁵ | −0.57 | 0.87 | 0.51 | 1.89 | 0.49 | 1.2 × 10⁻⁴ |
| rs10518316 | SYNPO2 | ____ | 0 | G | 4 | 120241167 | −2.52 | 0.60 | 3.0 × 10⁻⁵ | 1.37 | 0.95 | 0.15 | −1.41 | 0.51 | 2.1 × 10⁻⁵ |
| rs6911409 | KCNQ5 | 607357 | 0 | A | 6 | 73910091 | −3.71 | 0.89 | 3.5 × 10⁻⁵ | −1.14 | 1.14 | 0.32 | −2.74 | 0.7 | 9.7 × 10⁻⁵ |
| rs12659689 | RAI14 | 606586 | 0 | C | 5 | 34836108 | −1.98 | 0.48 | 3.9 × 10⁻⁵ | −0.11 | 0.69 | 0.87 | −1.39 | 0.39 | 4.6 × 10⁻⁴ |
| rs1952291 | MIS18BP1 | ____ | 618149 | A | 14 | 45410504 | −4.32 | 1.05 | 4.3 × 10⁻⁵ | 1.27 | 1.61 | 0.42 | −2.65 | 0.88 | 0.003 |
| rs1289666 | TTF2 | 604718 | 0 | T | 1 | 117350312 | −2.73 | 0.66 | 4.3 × 10⁻⁵ | −0.24 | 0.97 | 0.80 | −1.79 | 0.55 | 4.7 × 10⁻⁴ |
| rs11788785 | HSD17B3 | 605573 | 0 | A | 9 | 96111183 | −2.79 | 0.68 | 4.5 × 10⁻⁵ | −0.68 | 1.02 | 0.50 | −2.14 | 0.57 | 1.8 × 10⁻⁴ |
| rs1883264 | BIK | 603392 | 0 | G | 22 | 41834344 | −2.85 | 0.70 | 4.6 × 10⁻⁵ | −0.76 | 1.04 | 0.46 | −2.21 | 0.58 | 1.7 × 10⁻⁴ |
| rs12696123 | MIR135A2 | ____ | 66339 | C | 3 | 163099074 | −2.36 | 0.58 | 4.7 × 10⁻⁵ | 0.24 | 0.84 | 0.77 | −1.52 | 0.47 | 1.3 × 10⁻⁴ |
Absolute value of the distance from the start or stop site of the closest gene. A distance of 0 indicates that the SNP is located within the gene.
Allele associated with decreased weight loss.
Using pooled data from the two cohorts (n = 1020) showed that individuals with no copies of the minor allele (A) of rs17702901 (n = 967) lost an average of 38.7% of their body weight, whereas individuals carrying a single copy of this variant (n = 52) lost an average of 33.5% (Figure 2A). The sole homozygous AA individual had a %WL of 28.8%. The rs17702901 genotype explained 2.8% of the variance in %WL. This SNP was not associated with baseline BMI in this population (p = 0.33) or with BMI in the GIANT17 consortium analysis (p = 0.89). To examine the predictive utility of rs17702901 for discriminating individuals, we categorized individuals into those who lost more than 30% of their baseline weight (n = 849) and those who lost 30% or less of their baseline weight (n = 171) at weight nadir, and we conducted logistic regression analyses by using SAS statistical software (SAS Institute). Individuals with at least one copy of the minor allele were 2.54 times more likely to experience weight loss ≤ 30% than individuals with no copies of this allele (p < 0.0001). No individuals with the minor allele lost more than 50% of his or her initial weight (corresponding to the upper 10% of the weight loss distribution; Figure 2B). We next tested the predictive ability of this SNP by adding it to a clinical model for predicting weight loss after RYGB. Logistic regression models were constructed, and the area under the receiver operating characteristic curve (AUROC) before and after the addition of rs17702901 was assessed.18 Clinical variables included age at the time of surgery, sex, preoperative BMI measured by a nurse 0–7 days before surgery, and type 2 diabetes mellitus status (T2D; MIM 125853), determined by a review of the medical record (Table S2 and Figure S2). After multivariable adjustment, rs17702901 remained significant (Table S3). In the clinical model alone, the AUROC was 0.620; with the addition of rs17702901, the AUROC increased slightly to 0.633 (p = 0.36). These analyses indicate that rs17702901 is associated with decreased weight loss, independent of current clinical predictors, and highlight the potential predictive utility of this marker.
Figure 2.
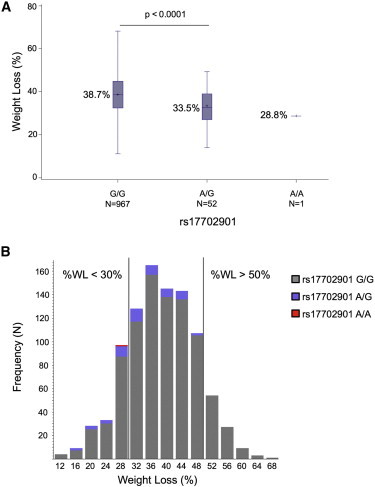
Weight Loss after RYGB by rs17702901 Genotype Status
(A) Percent weight loss in individuals after Roux-en-Y gastric bypass by rs17702901 genotype. Error bars denote the minimum and maximum value by group.
(B) Distribution of percent weight loss in individuals after Roux-en-Y gastric bypass by rs17702901 status. Grey bars indicate individuals with no rs17702901 minor alleles; purple bars indicate individuals with one copy of the minor allele; and the red bar indicates the single individual with two copies of the minor allele.
We analyzed expression of the two genes closest to rs17702901—ST8SIA2 (MIM 602546), located ∼6.7 kilobases (kb) downstream of rs17702901, and SLCO3A1 (MIM 612435), located ∼223 kb upstream of this SNP—in liver, subcutaneous fat, and omental fat obtained from participants in the first-stage GWAS. A detailed description of the sample processing, normalization, and data-cleaning methods has been provided previously.12 After adjustment for age, sex, diabetes, and preoperative BMI in linear-regression models, increased expression of ST8SIA2 in omental fat was significantly associated with %WL (p = 0.008). This relationship persisted after adjustment for rs17702901 genotype (pST8SIA2 = 0.008; prs17702901 = 0.007). Neither expression of ST8SIA2 in liver or subcutaneous fat nor expression of SLCO3A1 in any of these three tissues was significantly associated with %WL. We next examined whether genotype at the rs17702901 locus was associated with the expression level of any of ∼44,000 transcripts in liver, omental fat, and subcutaneous fat.12 We determined the association between rs17702901 genotype and gene expression in liver, subcutaneous fat, and omental fat by using Kruskal-Wallace tests and adjusting for the effect of surgery year, age, race, and sex by using a principal-components analysis.12 Using this approach, we detected no multiple-test-corrected, significant associations (expression quantitative trait loci [eQTL]) between rs17702901 and preoperative expression of any transcripts, including ST8SIA2 and SLCO3A1 (Table S4).
We examined the effect of RYGB on expression of the orthologs of ST8SIA2 and SLCO3A1 in a mouse gastric-bypass model that closely mimics the procedure in humans.19,20 All experiments in mice were performed in compliance with and were approved by the Institutional Animal Care and Use Committee of the Massachusetts General Hospital. At 12 weeks of age, male, diet-induced-obese C57BL/6 mice that had been on a high-fat diet since weaning (Jackson Laboratories, Bar Harbor, ME) were randomized to RYGB or sham operation with food restriction to match the weights of the RYGB mice weekly. The comparison of RYGB to weight-matched, sham-operated (WMS) mice allows for the identification of effects that are specific to surgery and independent of the effects of weight loss alone. Surgical procedures and postoperative care have been described previously.20 Ten weeks after surgery, animals were euthanized by carbon dioxide inhalation followed by cervical dislocation, and tissues were harvested immediately (Figure S3), flash frozen, and stored at −80°C until further processing. Total RNA was extracted with the SuperScript III First-Strand Synthesis System for RT-PCR kit (Invitrogen) according to the manufacturer’s instructions. One microgram of total RNA was used as a template for cDNA synthesis with the TaqMan Gene Expression Master Mix kit (Applied Biosciences). The relative expression level was determined by qPCR with preoptimized, gene-specific primer probe sets purchased from Applied Biosciences (catalog number 4331182) for Slco3a1 and St8sia2, and expression was analyzed with a CFX96 Real-Time PCR Detection System (BioRad). Data were normalized to actin, and one-way ANOVAs were calculated for each transcript. Expression of Sta8sia2, the mouse ortholog of the gene closest to rs17702901, was significantly lower in the epididymal fat and liver of RYGB-treated than WMS mice (Figure 3A). In addition, expression of Slco3a1 in the mid-jejunum (alimentary limb) was significantly greater in the RYGB group than in WMS controls (Figure 3B).
Figure 3.
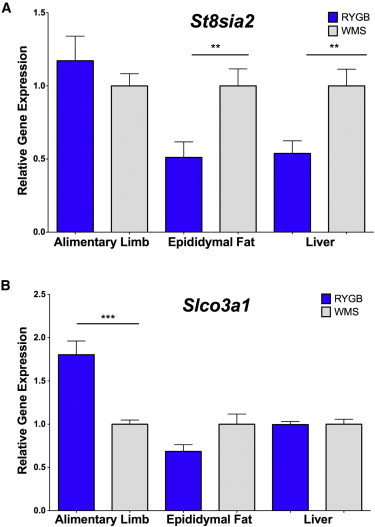
Comparative Expression of St8sia2 and Slco3a1 in RYGB-Treated and Sham-Operated, Weight-Matched Mice
Grey bars denote the sham-operated, weight-matched (WMS) group, and blue bars indicate the RYGB group. Error bars denote the standard error of the mean. *p < 0.05, **p < 0.01, and ***p < 0.001.
We next analyzed the results in humans by using a gene-based association test that integrates SNP associations with linkage-disequilibrium patterns within each gene,21 and identified a marginally significant association (p = 8.0 × 10⁻⁷) with aquaporin 11 (AQP11 [MIM 609914]; Table S5). Although there were 27 SNPs with a p value < 0.001 in this region, there was no statistically significant association between the region's top SNP, rs7129556, and %WL in the replication cohort (Figure 4A). Because only one SNP per independent locus was carried forward, the other 26 SNPs in this region were not genotyped in the replication cohort. We detected no genome-wide, multiple-test-corrected, significant associations between rs7129556 and the expression of any transcripts in humans, but this SNP was marginally associated with expression of AQP11 itself (pomental = 9.7 × 10⁻⁵, pliver = 1.6 × 10⁻⁴; Table S6). AQP11 expression in humans did not correlate with %WL in any tissue. We assessed gene expression of Aqp11 and Clns1a, the next closest gene to rs7129557, in the mouse models of RYGB as described above by using primer probe sets purchased from Applied Biosciences (catalog number 4331182) for Aqp11 and Clns1a. In the mouse models, Aqp11 expression in the alimentary limb and liver was significantly lower after RYGB than in WMS mice (Figure 4B). In contrast, expression of Clns1a was not significantly changed after RYGB (Figure 4C).
Figure 4.
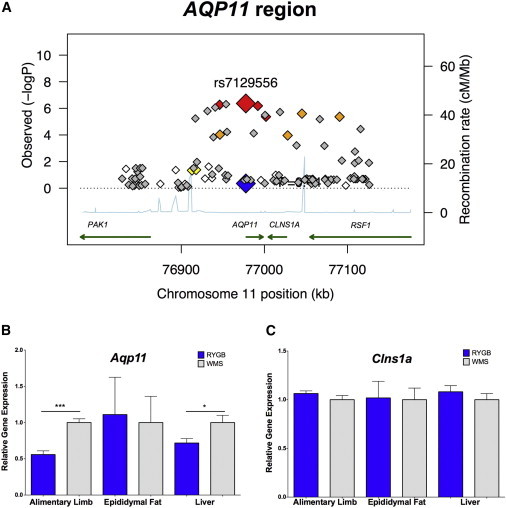
Analysis of the AQP11 Region
(A) Regional association plot of the AQP11 locus. Each SNP is plotted as a diamond on the basis of its chromosomal location (x axis) and −log10 p value (left y axis). Recombination rates are plotted in blue (right y axis). The large red diamond represents the region's top SNP (rs7129556) from the GWAS, and the large blue diamond represents the p value for that SNP in the replication cohort. White diamonds are not in significant linkage disequilibrium (LD) with rs7129556, whereas red, orange, and yellow diamonds are in strong (r2 ≥ 0.8), moderate (0.5 ≤ r2 < 0.8), and weak (0.2 ≤ r2 < 0.5) LD, respectively. Expression of Aqp11 (B) and Clns1a (C) is shown. Grey bars denote the WMS group, and blue bars denote the RYGB group. Error bars denote the standard error of the mean. *p < 0.05, **p < 0.01, and ***p < 0.001.
Because the physiological mechanisms underlying predisposition to obesity and weight loss after RYGB could be related, we assessed whether previously reported and validated BMI-associated loci17 were also associated with weight loss after RYGB in humans. None of the 32 previously reported BMI-associated loci were associated with weight loss after surgery in the GWAS or replication cohorts (Table S7). Furthermore, none of the SNPs identified in the GWAS stage (Table 1) were significantly associated with BMI in the GIANT consortium17 in the GWAS or replication cohorts (Table S8) after multiple-test correction, although rs3810291 and rs11847697 demonstrated marginal significance (uncorrected p values at both loci 0.01). In addition, deep sequencing of the MC4R (MIM 155541) locus showed no evidence of an association between variants in this gene and weight loss after RYGB.20 Finally, 28 T2D-associated loci were similarly not associated with weight loss after RYGB in the GWAS cohort (Table S9). None of the BMI or diabetes-associated SNPs were in linkage disequilibrium with rs17702901. Taken together, these findings suggest that the mechanisms of weight loss, particularly weight loss achieved with RYGB, could be distinct from the mechanisms associated with sustained elevated body weight.
In the current study, we have identified and validated a single genetic locus, near ST8SIA2 and SLCO3A1, that is significantly associated with weight loss after RYGB. Expression of ST8SIA2 in human omental tissue was associated with weight loss, further supporting the potential physiological relevance of this locus. These findings underscore the physiological mechanisms of action of RYGB and highlight the importance of biological, including genetic, factors in determining outcomes after this bariatric procedure.
ST8SIA2 encodes a sialyltransferase that catalyzes the transfer of polysialic acid to neural cell adhesion molecule 1 (NCAM1), resulting in posttranslational modification of NCAM1 and influencing brain development.22 SNPs near ST8SIA2 are associated with autism (MIM 209850), bipolar disorder (MIM 125480), and schizophrenia (MIM 181500).23–26 Notably, mutation of St8sia2, the mouse ortholog of this gene, has been associated with obesity in a congenic mouse model, although the mechanisms by which this gene might influence body fat are unclear.27 SLCO3A1 encodes organic anion transporting polypeptide, subtype D (OATP-D), which transports organic solutes, including certain drugs and xenobiotics.28 OATP-D also influences the cellular uptake of prostaglandins, which could influence hormone regulation and muscle contraction after RYGB.28 Other members of the OATP family have been shown to be associated with bile acid transport,29 which is altered after RYGB,30,31 and OATP-D itself has recently been postulated to play a role in this process as well.32 We also found that SNPs in and near AQP11 are associated with WL after RYGB and that Aqp11 expression is downregulated after RYGB in mice in a WL-independent manner. AQP11 encodes a member of the aquaporin family of membrane transporters.33 It has low sequence similarity to most family members, and its physiological function is unknown. Recently, however, Aqp11 has been shown to play a role in kidney development in mice.34,35 Based on the totality of the evidence, we hypothesize that ST8SIA2, SLCO3A1, and AQP11 might play a role in the widespread metabolic changes seen after RYGB and similar bariatric operations.
Despite these findings, it is important to note the limitations of this study. First, with only 693 participants, it is almost certainly underpowered to detect most genetic effects. The ability to detect even a single locus, however, underscores the contribution of genetic factors to surgical outcomes8 and suggests a strong likelihood of identifying additional genetic contributors to weight loss after RYGB. Second, because this study included only individuals of European descent, we do not know whether these same genetic factors are relevant to other populations. As genetic information from additional cohorts who have undergone RYGB becomes available, we will be able to compare and/or combine the results from these studies to address each of these limitations. Finally, the mechanisms through which the identified loci influence postoperative weight loss are unclear. Functional assessment of the potential roles of the genes identified through this association study will be necessary if we are to address this important question. It will also be necessary to determine whether the identified genetic factors predict weight loss achieved through diet, pharmaceuticals, or other surgical procedures or whether these genetic factors are specific to RYGB-induced weight loss.
In conclusion, we have identified a genetic locus that is reproducibly associated with weight loss after RYGB. This study provides evidence for the use of genomics to identify response to surgical procedures (surgicogenomics). Comparison of genetic predictors identified for RYGB with those identified for other weight-loss procedures could provide insight into their shared and distinct mechanisms of action. The gene(s) responsible for the correlation between rs17709201 and postoperative weight loss should provide additional insight into the mechanisms of action of RYGB and elucidate potential targets for obesity therapies. Given the wide distribution of outcomes after RYGB, including in individuals carrying the rs17702901 minor allele, we cannot recommend that rs17702901 allele status, in isolation, be used as an exclusion criterion for surgical therapy. Identification of additional genetic contributors to weight loss, comorbidity resolution, and adverse outcomes after RYGB and their incorporation into composite models that include validated clinical predictors of outcome could help to more precisely identify those individuals who will obtain the greatest benefit from RYGB and other types of weight-loss surgery. Furthermore, future identification of predictors of long-term weight stabilization would provide important information that would complement the identified predictors of initial weight loss. Together, these approaches could facilitate identification of individuals who would benefit most from RYGB and thereby improve the overall utility of this highly effective yet invasive treatment.
Acknowledgments
The authors thank Shubhra Kashyap and Melissa Paziuk for their expert technical assistance, Harveen Dhillon Natarajan and Nadia Ahmad for their help with the animal studies, and Rahul Deo for his invaluable statistical expertise. This work was supported by National Institutes of Health grants DK093257 (I.J.H.), DK088661 (L.M.K.), and DK090956 (L.M.K.) and by research grants from Merck Research Laboratories (L.M.K.) and Ethicon Endo-Surgery (L.M.K.). D.M.G. reports employment by Merck Research Laboratories. M.L.R. reports former employment by Merck Research Laboratories.
Supplemental Data
Web Resources
The URLs for data presented herein are as follows:
Online Mendelian Inheritance in Man (OMIM), http://www.omim.org
Gene Expression Omnibus (GEO), www.ncbi.nlm.nih.gov/geo
Accession Numbers
Human expression microarrays are available in the GEO database (accession numbers GSE24297, GSE24294, and GSE24293 for the subcutaneous adipose, omental adipose, and liver samples, respectively).
References
- 1.Ogden C.L., Carroll M.D., Curtin L.R., McDowell M.A., Tabak C.J., Flegal K.M. Prevalence of overweight and obesity in the United States, 1999-2004. JAMA. 2006;295:1549–1555. doi: 10.1001/jama.295.13.1549. [DOI] [PubMed] [Google Scholar]
- 2.Gardner C.D., Kiazand A., Alhassan S., Kim S., Stafford R.S., Balise R.R., Kraemer H.C., King A.C. Comparison of the Atkins, Zone, Ornish, and LEARN diets for change in weight and related risk factors among overweight premenopausal women: the A TO Z Weight Loss Study: a randomized trial. JAMA. 2007;297:969–977. doi: 10.1001/jama.297.9.969. [DOI] [PubMed] [Google Scholar]
- 3.Wing R.R., Look AHEAD Research Group Long-term effects of a lifestyle intervention on weight and cardiovascular risk factors in individuals with type 2 diabetes mellitus: four-year results of the Look AHEAD trial. Arch. Intern. Med. 2010;170:1566–1575. doi: 10.1001/archinternmed.2010.334. [DOI] [PMC free article] [PubMed] [Google Scholar]
- 4.Bray G.A. Medications for weight reduction. Endocrinol. Metab. Clin. North Am. 2008;37:923–942. doi: 10.1016/j.ecl.2008.08.004. [DOI] [PubMed] [Google Scholar]
- 5.Buchwald H., Avidor Y., Braunwald E., Jensen M.D., Pories W., Fahrbach K., Schoelles K. Bariatric surgery: a systematic review and meta-analysis. JAMA. 2004;292:1724–1737. doi: 10.1001/jama.292.14.1724. [DOI] [PubMed] [Google Scholar]
- 6.Sjöström L., Narbro K., Sjöström C.D., Karason K., Larsson B., Wedel H., Lystig T., Sullivan M., Bouchard C., Carlsson B., Swedish Obese Subjects Study Effects of bariatric surgery on mortality in Swedish obese subjects. N. Engl. J. Med. 2007;357:741–752. doi: 10.1056/NEJMoa066254. [DOI] [PubMed] [Google Scholar]
- 7.Hatoum I.J., Stein H.K., Merrifield B.F., Kaplan L.M. Capacity for physical activity predicts weight loss after Roux-en-Y gastric bypass. Obesity (Silver Spring) 2009;17:92–99. doi: 10.1038/oby.2008.507. [DOI] [PMC free article] [PubMed] [Google Scholar]
- 8.Hatoum I.J., Greenawalt D.M., Cotsapas C., Reitman M.L., Daly M.J., Kaplan L.M. Heritability of the weight loss response to gastric bypass surgery. J. Clin. Endocrinol. Metab. 2011;96:E1630–E1633. doi: 10.1210/jc.2011-1130. [DOI] [PMC free article] [PubMed] [Google Scholar]
- 9.Ochner C.N., Kwok Y., Conceição E., Pantazatos S.P., Puma L.M., Carnell S., Teixeira J., Hirsch J., Geliebter A. Selective reduction in neural responses to high calorie foods following gastric bypass surgery. Ann. Surg. 2011;253:502–507. doi: 10.1097/SLA.0b013e318203a289. [DOI] [PMC free article] [PubMed] [Google Scholar]
- 10.Shin A.C., Zheng H., Pistell P.J., Berthoud H.-R. Roux-en-Y gastric bypass surgery changes food reward in rats. Int. J. Obes. (Lond.) 2011;35:642–651. doi: 10.1038/ijo.2010.174. [DOI] [PMC free article] [PubMed] [Google Scholar]
- 11.Stylopoulos N., Hoppin A.G., Kaplan L.M. Roux-en-Y gastric bypass enhances energy expenditure and extends lifespan in diet-induced obese rats. Obesity (Silver Spring) 2009;17:1839–1847. doi: 10.1038/oby.2009.207. [DOI] [PMC free article] [PubMed] [Google Scholar]
- 12.Greenawalt D.M., Dobrin R., Chudin E., Hatoum I.J., Suver C., Beaulaurier J., Zhang B., Castro V., Zhu J., Sieberts S.K. A survey of the genetics of stomach, liver, and adipose gene expression from a morbidly obese cohort. Genome Res. 2011;21:1008–1016. doi: 10.1101/gr.112821.110. [DOI] [PMC free article] [PubMed] [Google Scholar]
- 13.Cotsapas C., Speliotes E.K., Hatoum I.J., Greenawalt D.M., Dobrin R., Lum P.Y., Suver C., Chudin E., Kemp D., Reitman M., GIANT Consortium Common body mass index-associated variants confer risk of extreme obesity. Hum. Mol. Genet. 2009;18:3502–3507. doi: 10.1093/hmg/ddp292. [DOI] [PMC free article] [PubMed] [Google Scholar]
- 14.Purcell S., Neale B., Todd-Brown K., Thomas L., Ferreira M.A.R., Bender D., Maller J., Sklar P., de Bakker P.I.W., Daly M.J., Sham P.C. PLINK: a tool set for whole-genome association and population-based linkage analyses. Am. J. Hum. Genet. 2007;81:559–575. doi: 10.1086/519795. [DOI] [PMC free article] [PubMed] [Google Scholar]
- 15.Price A.L., Patterson N.J., Plenge R.M., Weinblatt M.E., Shadick N.A., Reich D. Principal components analysis corrects for stratification in genome-wide association studies. Nat. Genet. 2006;38:904–909. doi: 10.1038/ng1847. [DOI] [PubMed] [Google Scholar]
- 16.Li Y., Willer C.J., Ding J., Scheet P., Abecasis G.R. MaCH: using sequence and genotype data to estimate haplotypes and unobserved genotypes. Genet. Epidemiol. 2010;34:816–834. doi: 10.1002/gepi.20533. [DOI] [PMC free article] [PubMed] [Google Scholar]
- 17.Speliotes E.K., Willer C.J., Berndt S.I., Monda K.L., Thorleifsson G., Jackson A.U., Lango Allen H., Lindgren C.M., Luan J., Mägi R., MAGIC; Procardis Consortium Association analyses of 249,796 individuals reveal 18 new loci associated with body mass index. Nat. Genet. 2010;42:937–948. doi: 10.1038/ng.686. [DOI] [PMC free article] [PubMed] [Google Scholar]
- 18.DeLong E.R., DeLong D.M., Clarke-Pearson D.L. Comparing the areas under two or more correlated receiver operating characteristic curves: a nonparametric approach. Biometrics. 1988;44:837–845. [PubMed] [Google Scholar]
- 19.Nestoridi E., Kvas S., Kucharczyk J., Stylopoulos N. Resting energy expenditure and energetic cost of feeding are augmented after Roux-en-Y gastric bypass in obese mice. Endocrinology. 2012;153:2234–2244. doi: 10.1210/en.2011-2041. [DOI] [PubMed] [Google Scholar]
- 20.Hatoum I.J., Stylopoulos N., Vanhoose A.M., Boyd K.L., Yin D.P., Ellacott K.L., Ma L.L., Blaszczyk K., Keogh J.M., Cone R.D. Melanocortin-4 receptor signaling is required for weight loss after gastric bypass surgery. J. Clin. Endocrinol. Metab. 2012;97:E1023–E1031. doi: 10.1210/jc.2011-3432. [DOI] [PMC free article] [PubMed] [Google Scholar]
- 21.Liu J.Z., McRae A.F., Nyholt D.R., Medland S.E., Wray N.R., Brown K.M., Hayward N.K., Montgomery G.W., Visscher P.M., Martin N.G., Macgregor S., AMFS Investigators A versatile gene-based test for genome-wide association studies. Am. J. Hum. Genet. 2010;87:139–145. doi: 10.1016/j.ajhg.2010.06.009. [DOI] [PMC free article] [PubMed] [Google Scholar]
- 22.Horstkorte R., Mühlenhoff M., Reutter W., Nöhring S., Zimmermann-Kordmann M., Gerardy-Schahn R. Selective inhibition of polysialyltransferase ST8SiaII by unnatural sialic acids. Exp. Cell Res. 2004;298:268–274. doi: 10.1016/j.yexcr.2004.04.014. [DOI] [PubMed] [Google Scholar]
- 23.Lee M.T.M., Chen C.H., Lee C.S., Chen C.C., Chong M.Y., Ouyang W.C., Chiu N.Y., Chuo L.J., Chen C.Y., Tan H.K.L. Genome-wide association study of bipolar I disorder in the Han Chinese population. Mol. Psychiatry. 2011;16:548–556. doi: 10.1038/mp.2010.43. [DOI] [PubMed] [Google Scholar]
- 24.Anney R., Klei L., Pinto D., Regan R., Conroy J., Magalhaes T.R., Correia C., Abrahams B.S., Sykes N., Pagnamenta A.T. A genome-wide scan for common alleles affecting risk for autism. Hum. Mol. Genet. 2010;19:4072–4082. doi: 10.1093/hmg/ddq307. [DOI] [PMC free article] [PubMed] [Google Scholar]
- 25.Vazza G., Bertolin C., Scudellaro E., Vettori A., Boaretto F., Rampinelli S., De Sanctis G., Perini G., Peruzzi P., Mostacciuolo M.L. Genome-wide scan supports the existence of a susceptibility locus for schizophrenia and bipolar disorder on chromosome 15q26. Mol. Psychiatry. 2007;12:87–93. doi: 10.1038/sj.mp.4001895. [DOI] [PubMed] [Google Scholar]
- 26.McAuley E.Z., Scimone A., Tiwari Y., Agahi G., Mowry B.J., Holliday E.G., Donald J.A., Weickert C.S., Mitchell P.B., Schofield P.R., Fullerton J.M. Identification of sialyltransferase 8B as a generalized susceptibility gene for psychotic and mood disorders on chromosome 15q25-26. PLoS ONE. 2012;7:e38172. doi: 10.1371/journal.pone.0038172. [DOI] [PMC free article] [PubMed] [Google Scholar]
- 27.Sarahan K.A., Fisler J.S., Warden C.H. Four out of eight genes in a mouse chromosome 7 congenic donor region are candidate obesity genes. Physiol. Genomics. 2011;43:1049–1055. doi: 10.1152/physiolgenomics.00134.2010. [DOI] [PMC free article] [PubMed] [Google Scholar]
- 28.Adachi H., Suzuki T., Abe M., Asano N., Mizutamari H., Tanemoto M., Nishio T., Onogawa T., Toyohara T., Kasai S. Molecular characterization of human and rat organic anion transporter OATP-D. Am. J. Physiol. Renal Physiol. 2003;285:F1188–F1197. doi: 10.1152/ajprenal.00402.2002. [DOI] [PubMed] [Google Scholar]
- 29.Mikkaichi T., Suzuki T., Tanemoto M., Ito S., Abe T. The organic anion transporter (OATP) family. Drug Metab. Pharmacokinet. 2004;19:171–179. doi: 10.2133/dmpk.19.171. [DOI] [PubMed] [Google Scholar]
- 30.Patti M.-E., Houten S.M., Bianco A.C., Bernier R., Larsen P.R., Holst J.J., Badman M.K., Maratos-Flier E., Mun E.C., Pihlajamaki J. Serum bile acids are higher in humans with prior gastric bypass: potential contribution to improved glucose and lipid metabolism. Obesity (Silver Spring) 2009;17:1671–1677. doi: 10.1038/oby.2009.102. [DOI] [PMC free article] [PubMed] [Google Scholar]
- 31.Pournaras D.J., Glicksman C., Vincent R.P., Kuganolipava S., Alaghband-Zadeh J., Mahon D., Bekker J.H.R., Ghatei M.A., Bloom S.R., Walters J.R.F. The role of bile after Roux-en-Y gastric bypass in promoting weight loss and improving glycaemic control. Endocrinology. 2012;153:3613–3619. doi: 10.1210/en.2011-2145. [DOI] [PMC free article] [PubMed] [Google Scholar]
- 32.Libra A., Fernetti C., Lorusso V., Visigalli M., Anelli P.L., Staud F., Tiribelli C., Pascolo L. Molecular determinants in the transport of a bile acid-derived diagnostic agent in tumoral and nontumoral cell lines of human liver. J. Pharmacol. Exp. Ther. 2006;319:809–817. doi: 10.1124/jpet.106.106591. [DOI] [PubMed] [Google Scholar]
- 33.Yakata K., Tani K., Fujiyoshi Y. Water permeability and characterization of aquaporin-11. J. Struct. Biol. 2011;174:315–320. doi: 10.1016/j.jsb.2011.01.003. [DOI] [PubMed] [Google Scholar]
- 34.Okada S., Misaka T., Tanaka Y., Matsumoto I., Ishibashi K., Sasaki S., Abe K. Aquaporin-11 knockout mice and polycystic kidney disease animals share a common mechanism of cyst formation. FASEB J. 2008;22:3672–3684. doi: 10.1096/fj.08-111872. [DOI] [PubMed] [Google Scholar]
- 35.Tchekneva E.E., Khuchua Z., Davis L.S., Kadkina V., Dunn S.R., Bachman S., Ishibashi K., Rinchik E.M., Harris R.C., Dikov M.M., Breyer M.D. Single amino acid substitution in aquaporin 11 causes renal failure. J. Am. Soc. Nephrol. 2008;19:1955–1964. doi: 10.1681/ASN.2008030296. [DOI] [PMC free article] [PubMed] [Google Scholar]
Associated Data
This section collects any data citations, data availability statements, or supplementary materials included in this article.