

Abstract
The C57BL/6ByJ (B6) strain of mice exhibits higher preferences than does the 129P3/J (129) strain for a variety of sweet-tasting compounds. We measured gustatory afferent responses of the whole chorda tympani nerve in these two strains using a broad array of sweeteners and other taste stimuli. Neural responses were greater in B6 than in 129 mice to the sugars sucrose and maltose, the polyol D-sorbitol, and the non-caloric sweeteners NaSaccharin, acesulfame-K, SC-45647, and sucralose. Lower neural response thresholds were also observed in the B6 strain for most of these stimuli. The strains did not differ on their neural responses to amino acids that are thought to taste sweet to mice, with the exception of L-proline, which evoked larger responses in the B6 strain. Aspartame and thaumatin, which taste sweet to humans but are not strongly preferred by B6 or 129 mice, did not evoke neural responses that exceeded threshold in either strain. The strains generally did not differ in their neural responses to NaCl, quinine, and HCl. Thus, variation between the B6 and 129 strains in the peripheral gustatory system may contribute to differences in their consumption of many sweeteners.
Keywords: mouse, sweetness, electrophysiology, amino acids, Polycose
INTRODUCTION
The consumption of sugars and other substances that humans describe as sweet has been shown to have a genetic basis in humans and mice (Hoshishima, et al., 1962; Fuller, 1974; Lush, 1989; Capeless and Whitney, 1995; Reed et al., 1997). Some mouse strains vary considerably in their sugar preference, with the C57BL/6 and 129 strains exhibiting one of the largest differences (Lush, 1989; Capeless and Whitney, 1995). The former have a higher preference for low concentrations of sucrose and, while both strains have a near 100 % preference for sucrose concentrations above 4 %, B6 mice consume a larger volume in 48-h tests (Bachmanov et al., accompanying manuscript).
Although sucrose intake is regulated by a number of mechanisms, such as release of endorphins (Marks-Kaufman et al., 1989; Yamamoto et al., 2000) and post-ingestive stimulation (Mook, 1963), differences in sensory factors (“sweetness”) may play an important role in these behavioral differences. Mice from C57BL/6 strains have higher preferences for artificial sweeteners, such as saccharin, which do not provide calories (Lush, 1989; Capeless and Whitney, 1995; Bachmanov et al., accompanying manuscript). They also have greater whole nerve chorda tympani responses to sucrose than do 129/J mice, indicating that there is a difference in gustatory processing of this stimulus that originates peripherally (Bachmanov et al., 1997).
In order to characterize more fully the electrophysiological differences between C57BL/6ByJ (B6) and 129P3/J (129) mice, we measured their whole nerve chorda tympani responses to a broad array of chemicals that humans describe as sweet and that appear to generate the quality of sweetness in mice, as indicated by intake tests, generalizations of conditioned taste aversions, and electrophysiology (Iwasaki et al., 1985; Kasahara et al., 1987; Ninomiya et al., 1992; Bachmanov et al., accompanying manuscript). The chorda tympani nerve was chosen because it responds robustly to sweet stimuli, as well as to other tastants, in different strains of mice (Ninomiya et al., 1982; Ninomiya et al., 1984a; Sako et al., 1996; Frank and Blizzard, 1999).
Taste stimuli included artificial sweeteners, amino acids, the sugars sucrose and maltose, and the polyol D-sorbitol. Aspartame and thaumatin, which taste sweet to humans but are not palatable to rodents (Brouwer et al., 1973; Nowlis et al., 1980; Sclafani and Abrams, 1986; DeFrancisco and Dess, 1998), were also included. We also presented the carbohydrates Polycose and maltooligosaccharide, which are preferred by mice and other rodents (Feigin and Sclafani, 1987; Rehnberg at al., 1996; Bachmanov et al., 2001), but appear to have a taste quality that is distinct from sugars (Nissenbaum and Sclafani, 1987; Formaker et al., 1988; Sclafani, 1991; Sako et al., 1994). The results of behavioral comparisons between the two strains are presented in a separate paper (Bachmanov et al., accompanying manuscript).
METHODS
Two experiments were conducted. They used separate groups of subjects and different stimulus arrays (see below), but did not vary on other methodological details.
Subjects
Subjects were adult male mice of the C57BL/6ByJ (B6) and 129P3/J (129) strains. They were obtained from The Jackson Laboratory (Bar Harbor, ME) and weighed 20–38 g at the time of recording. Ten mice were used in experiment 1 (five from each strain) and 11 in experiment 2 (B6, n = 5; 129, n = 6). They were kept in a temperature-controlled room at 23 °C on a 12:12 h light:dark cycle with lights on at 7:00 am. They had ad libitum access to deionized H2O and standard laboratory chow.
Electrophysiology
Subjects were anesthetized with sodium pentobarbital (40–50 mg/kg, with further doses as necessary). A tracheotomy was conducted, after which the animal was placed supine in a non-traumatic headholder. The right chorda tympani nerve was exposed between its exit from the lingual nerve and entry to the bulla. The chorda tympani was cut near the bulla and placed on a platinum wire electrode, and a few drops of mineral oil were placed in the wound site to prevent dessication of the nerve. An indifferent electrode was positioned in nearby muscle tissue. The whole nerve response was amplified, integrated with a time constant of 1.0 sec, and displayed on chart recorder paper.
Stimuli and Delivery
In experiment 1, taste stimuli consisted of 100 mM NaCl, 20 mM quinine HCl, 10 mM HCl, 100 mM D-phenylalanine, sucrose at 10, 30, 100, 300, and 1000 mM, and NaSaccharin at 0.2, 0.6, 2, 6, and 20 mM. The results of the NaSaccharin data have been published previously inLi et al. (2001).
Stimuli for experiment 2 are shown in table 1. Polycose was obtained from Ross Laboratories (Columbus, OH). Some mice received multiple applications of particular chemicals, in which case the responses were averaged to obtain a single value for the subject. However, the large size of the array also necessitated that some subjects did not receive all of the stimuli (see table 1).
Table 1.
Concentrations of compounds that were applied in Experiment 2, neural response thresholds, and the number of 129 or B6 mice in which recordings were obtained.
| Compound | Concentrations | B6 Thresholda |
129 Thresholda |
# B6 mice |
# 129 mice |
|---|---|---|---|---|---|
| NaCl | 100 mM | 5 | 6 | ||
| Sucrose | 500 mM | 5 | 6 | ||
| Quinine HCl | 20 mM | 4 | 6 | ||
| HCl | 10 mM | 5 | 6 | ||
| Maltose | 30, 300, 500 mM | 500 mM | – | 5 | 5 |
| D-sorbitol | 60, 600, 2000 mM | 600 mM | 2000 mM | 5 | 5 |
| Acesulfame-K | 2, 10, 20, 100 mM | 10 mM | 100 mM | 5 | 4 |
| Aspartame | 0.1, 1, 10 mM | – | – | 2 | 5 |
| SC-45647 | 0.01, 0.1, 1 mM | 1 mM | – | 5 | 4 |
| Sucralose | 10, 100, 1000 mg/L | 1000 mg/L | – | 5 | 5 |
| Thaumatin | 1, 10, 100 mg/L | – | – | 4 | 3 |
| L-alanine | 10, 100, 1000 mM | 100 mM | 100 mM | 5 | 5 |
| Glycine | 10, 30, 100, 300, 1000 mM | 100 mM | 100 mM | 5 | 5 |
| D-histidine | 10, 100 mM | 100 mM | 100 mM | 5 | 5 |
| L-proline | 10, 100, 1000 mM | 100 mM | 1000 mM | 5 | 5 |
| L-serine | 10, 100, 1000 mM | 100 mM | 100 mM | 5 | 5 |
| L-threonine | 10, 100 mM | 100 mM | 100 mM | 5 | 5 |
| Polycose | 1, 10, 30 % | 10 % | 10 % | 5 | 4 |
| Maltooligosaccharide | 1, 10, 30 % | 2 | 2 |
Thresholds were defined as the lowest concentration of a compound for which a response could be distinguished from baseline in at least half the subjects. A dash indicates that the highest concentration tested did not reach threshold, and a blank indicates that a threshold could not be determined due to an insufficient number of concentrations or subjects.
Chemicals were mixed in distilled water and were applied at room temperature and in volumes of 1 ml, which were applied to the tongue by gravity flow for 30 sec. Concentration series of a given compound were applied in ascending order. Stimulus presentations were followed by a deionized water rinse of 2 ml or more, and an interval of at least 1 min was allowed between stimuli.
We used two approaches to normalize the magnitude of neural responses. First, ammonium chloride (NH4Cl) at 100 mM was presented frequently throughout recording to serve as a reference stimulus. For compounds that were presented at multiple concentrations, NH4Cl was given before and after each concentration series; the remaining four stimuli (NaCl, quinine, HCl, and, depending on the experiment, D-phenylalanine or 500 mM sucrose) were presented at the start of the recording session and were preceded and followed by NH4Cl applications. Individual responses were expressed as a percentage of the average of the two nearest NH4Cl responses. This normalization procedure was necessary because the absolute magnitude of multifiber responses can vary over a recording session based on factors such as the dryness of the nerve. We chose 100 mM NH4Cl as our reference stimulus because it evokes robust responses in the CT of both B6 and 129 mice, and the two strains do not differ on their preferences for this solution in 48-h two-bottle tests with water (Bachmanov, unpublished observations). We also examined whether responding to NH4Cl differed between strains. For each mouse, responses to NH4Cl were expressed relative to the average of the absolute magnitude of the responses to NaCl, quinine, HCl, and sucrose. The resulting normalized NH4Cl values did not differ between B6 and 129 mice for either experiment.
We also examined the data from experiment 2 using an alternate normalization procedure, similar to one used by Frank and Blizard (1999), in which the absolute magnitudes of the responses to NH4Cl, NaCl, quinine, HCl, and sucrose were averaged to obtain a single reference number for each mouse. Responses to individual stimuli were then expressed as percentages of this reference number. Because of the large size of the entire stimulus array, we could not present a group of five reference stimuli continuously throughout recording, and thus this method suffers from not being able to address fluctuations in the nerve’s responsiveness over time. However, it has the advantages of not depending on a single reference stimulus and of including stimuli that evoke robust responses in all of the fiber types found in the mouse chorda tympani.
Analysis
Responses to all stimuli, including NH4Cl, were calculated based on the magnitude of the integrated whole-nerve response at 20 sec after stimulus onset. We also examined the data using peak responses and obtained similar results. However, only 20 sec data are reported here, because they are less variable and less prone to onset artifacts than peak response values.
For each compound that was presented at multiple concentrations, a two-way ANOVA was performed with strain as a between-group factor and concentration as a within-group factor. Post-hoc comparisons (t-tests) were conducted when appropriate to examine differences on individual concentrations. For the stimuli that were presented at only a single concentration, differences between strains were assessed using t-tests. For all tests, p < 0.05 was considered significant. In order to simplify the reporting of a large number significant findings, in some cases we list only the minimum F or t and maximum P values across a number of comparisons (e. g., “p < 0.05 in all cases”).
The threshold response for a compound was defined as the lowest concentration for which a clear deviation from baseline activity could be observed on the chart paper in at least half the subjects tested.
RESULTS
Experiment 1
Chorda tympani responses were significantly smaller in B6 than in 129 mice to HCl (t[8] = 2.5, p = 0.04). No differences in evoked activity were observed for NaCl, quinine, and the sweet amino acid D-phenylalanine (figure 1). For sucrose and saccharin (figure 2), responses in B6 mice were larger overall (effect of strain, F[1, 8] ≥ 7.1, p < 0.05 in both cases), and there was also a significant strain × concentration interaction (F[4, 32] ≥ 3.1, p < 0.05 in both cases). Post-hoc comparisons revealed that responses in the B6 strain were significantly greater to all concentrations of sucrose except 300 mM and to 6 and 20 mM NaSaccharin (figure 2; t[8] ≥ 2.3, p < 0.05 in all cases).
Figure 1.

Mean (± SEM) whole nerve chorda tympani responses in B6 (closed bars) and 129 (open bars) mice in experiment 1, expressed as a percentage of the response to 100 mM NH4Cl. D-phe, D-phenylalanine; *, p < 0.05, B6 vs 129.
Figure 2.

Mean (± SEM) whole nerve chorda tympani responses to sucrose (top panel) and NaSaccharin (bottom panel) in B6 (closed circles) and 129 (open circles) mice in experiment 1, expressed as a percentage of the response to 100 mM NH4Cl. The data for NaSaccharin has been published previously in Li et al. (in press). *, p < 0.05, B6 vs 129.
The B6 group had a lower response threshold to sucrose (10 mM) than did the 129 group (100 mM). For both strains, the lowest concentration of NaSaccharin tested (0.2 mM) was above threshold.
Experiment 2
Representatives of the basic tastes
Among the chemicals representative of the four basic taste qualities (figure 3), sucrose evoked a significantly greater response in B6 than in 129 mice (t[9] = 3.1, p = 0.01). Responses to NaCl, quinine, and HCl did not differ between the strains, though there was a tendency (p = 0.07) for responses to HCl to be larger in B6 mice. There were small but consistent within-strain differences in mean responding to NaCl, quinine, and HCl compared with experiment 1 (larger responses in B6 mice and smaller ones in 129 mice relative to the previous data). However, in no cases were these differences between experiments significant.
Figure 3.
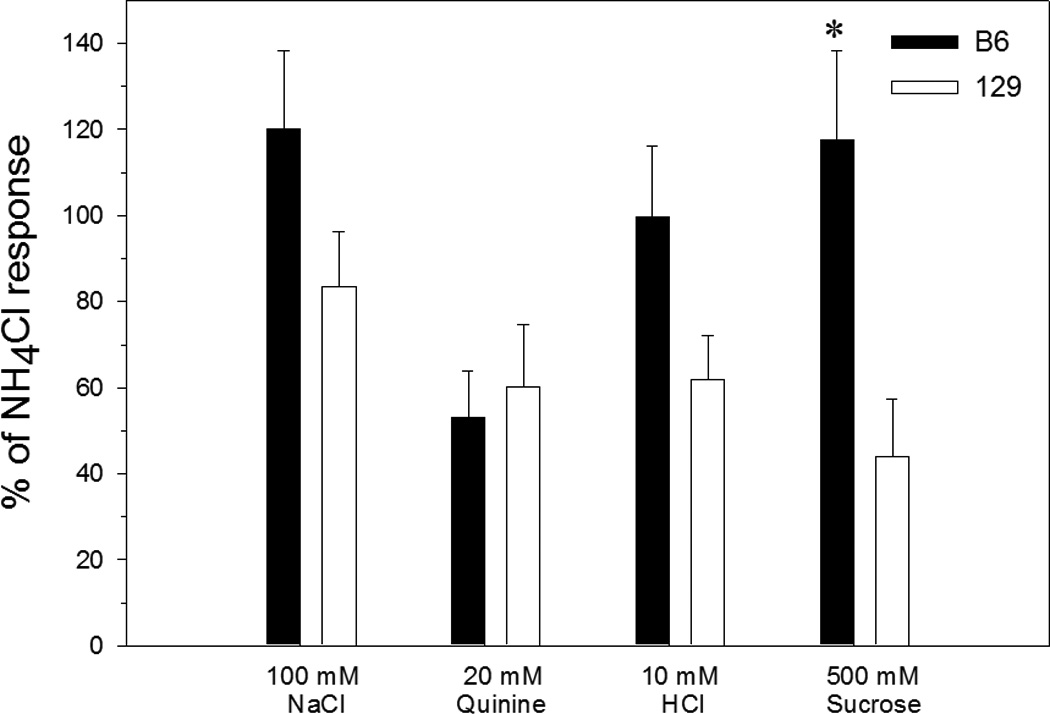
Mean (± SEM) whole nerve chorda tympani responses in B6 (closed bars) and 129 (open bars) mice in experiment 2, expressed as a percentage of the response to 100 mM NH4Cl. *, p < 0.05, B6 vs 129.
Non-amino acid sweeteners
Most of these stimuli evoked greater responses in the B6 than in the 129 strain (figure 4). There were significant effects of strain (F[1, 7–8] ≥ 11.1, p < 0.05 in all cases) and strain × concentration interactions (F[2–3, 14–21] ≥ 5.1, p < 0.05 in all cases) for maltose, D-sorbitol, acesulfame-K, SC-45647, and sucralose. Post-hoc comparisons indicated that these differences first appeared at 500 mM for maltose, 600 mM for D-sorbitol, 10 mM for acesulfame-K, 1 mM for SC-45647, and at 1 g/L for sucralose (t[7–8] ≥ 2.5, p < 0.05 in all cases). Response thresholds for these five stimuli were also lower in B6 mice (table 1), with D-sorbitol and acesulfame-K being the only sweeteners to evoke a suprathreshold response in 129 mice at the concentrations tested. Aspartame and thaumatin did not evoke responses that exceeded threshold in either strain at any concentration (table 1, figure 4). Figure 5 shows representative sample recordings of responses to NH4Cl and three stimuli that evoked larger responses in B6 mice.
Figure 4.

Mean (± SEM) whole nerve chorda tympani responses in B6 (closed circles) and 129 (open circles) mice in experiment 2 to maltose, D-sorbitol, acesulfame-K, aspartame, SC-45647, sucralose, and thaumatin, expressed as a percentage of the response to 100 mM NH4Cl. *, p < 0.05, B6 vs 129.
Figure 5.

Sample recordings of integrated whole-nerve chorda tympani activity taken from a B6 (top) and a 129 (bottom) mouse in experiment 2. Responses to the reference stimulus (100 mM NH4Cl) and three sweeteners which evoked significantly larger mean responses in the B6 strain (2 M D-sorbitol, 20 mM acesulfame-K, and 1 g/L sucralose) are shown. D-sorb, D-sorbitol; Ace, Acesulfame-K.
Amino acid sweeteners
Responses to most sweet amino acids did not differ between the strains (figure 6), with the exception of L-proline, which evoked significantly greater responses in B6 mice (effect of strain, F[1, 8] = 10.3, p = 0.01; strain × concentration interaction, F[2, 16] = 5.1, p = 0.02). Post-hoc comparisons revealed significant differences for 100 and 1000 mM L-proline (figure 6; t[8] ≥ 2.4, p < 0.05 in both cases). The B6 group also had a lower response threshold for L-proline (100 mM) than did the 129 group (1000 mM). Thresholds for other amino acids did not differ between groups (table 1).
Figure 6.
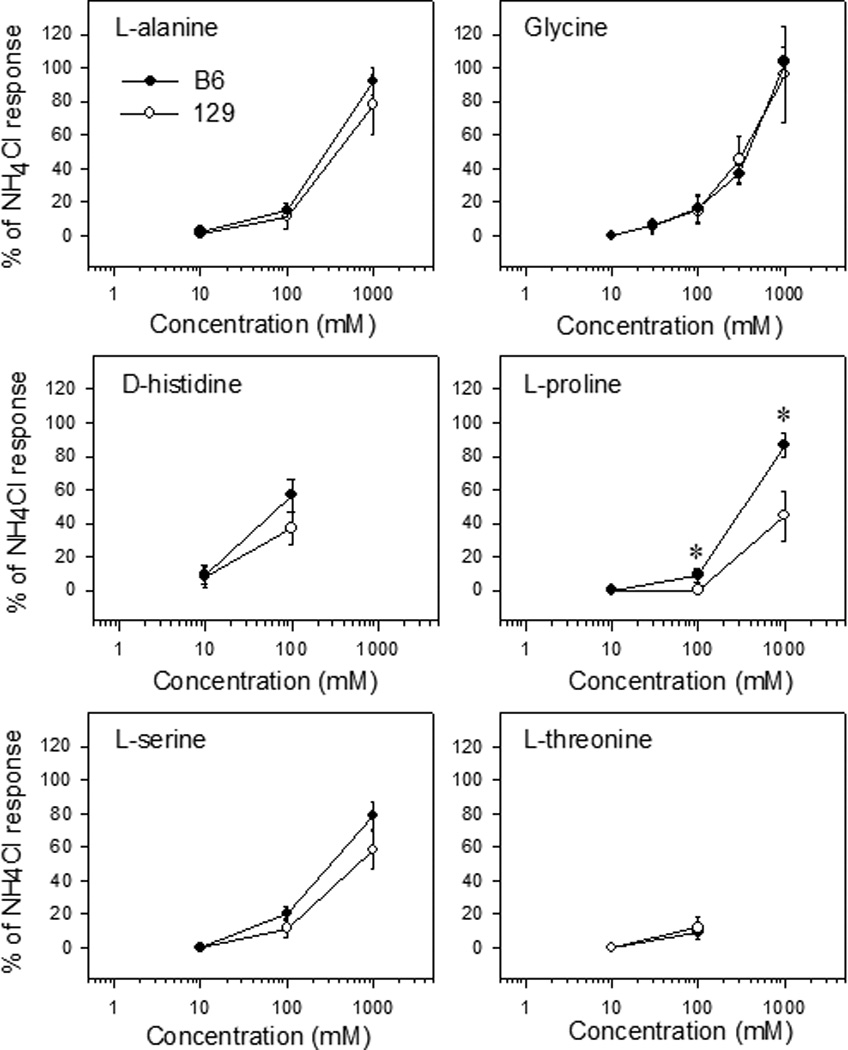
Mean (± SEM) whole nerve chorda tympani responses in B6 (closed circles) and 129 (open circles) mice in experiment 2 to the sweet-tasting amino acids L-alanine, glycine, D-histidine, L-proline, L-serine, and L-threonine, expressed as a percentage of the response to 100 mM NH4Cl. *, p < 0.05, B6 vs 129.
Glucose polymers
Application of Polycose evoked greater activity in the B6 strain, both overall (effect of strain, F[1, 7] = 10.1, p = 0.01) and at 10 % (figure 7; t[7] = 4.6, p = 0.002). The threshold response for Polycose was 10 % in both groups (table 1). Although the results for maltooligosaccharide should be viewed cautiously due to the small n, the mean responses closely matched those to Polycose within each group of mice (figure 7). There was a significant effect of strain (F[1,2] = 27.3, p = 0.03), with B6 mice showing greater overall responsiveness to maltooligosaccharide, and post-hoc comparisons also revealed greater B6 responding to the 10 % concentration (t[2] = 5.5, p = 0.03).
Figure 7.

Mean (± SEM) whole nerve chorda tympani responses in B6 (closed circles) and 129 (open circles) mice to Polycose (top panel) and maltooligosaccharide (bottom panel) in experiment 2, expressed as a percentage of the response to 100 mM NH4Cl. *, p < 0.05, B6 vs 129.
Alternate normalization procedure
The alternate procedure, in which responses were normalized against the average response to five stimuli (see Methods), yielded results that were similar to those obtained when NH4Cl was used as the sole reference stimulus. When the alternate procedure was used, two additional stimuli evoked significantly greater responses in B6 than in 129 mice (1000 mM Glycine and 30 % Polycose), and two stimuli which had previously evoked greater responses in the B6 strain no longer did (100 mM L-proline and 10 % maltooligosaccharide). In all other cases the two normalization procedures yielded similar results, and there were no instances using either method where responses were significantly larger in 129 mice (data not shown).
DISCUSSION
Chorda tympani responses to a variety of sweeteners were larger in B6 than in 129 mice. This result was observed for substances that included sugars (sucrose and maltose), non-caloric sweeteners (acesulfame-K, NaSaccharin, SC-45647, and sucralose), the polyol D-sorbitol, and the amino acid L-proline. This effect was also seen for the glucose polymers Polycose and maltooligosaccharide at 10 %. Moreover, B6 mice had lower neural response thresholds for all of these stimuli except NaSaccharin, where the stimulus range was above threshold for both groups, and the glucose polymers.
In general, the groups did not differ on responding to NaCl, quinine, and HCl. Although responses to these stimuli were smaller in B6 than in 129 mice in experiment 1, the difference only reached significance for HCl. In experiment 2, there was a trend (p < 0.1) for B6 responses to HCl to be larger than those in 129 mice. The relatively small size of these differences compared to those for sweeteners and the lack of consistency between Experiments 1 and 2 suggests that the variation in responding to these stimuli was most likely due to chance, and the significant effect for HCl in experiment 1 was a false positive (Type I error). This is in contrast to the results for sugars and many artificial sweeteners, where significance was reached using the same number of subjects and differences were observed in both Experiments 1 and 2 and in previously published work (Bachmanov et al., 1997).
The gustatory-evoked chorda tympani responses that we measured are only one of the factors that determine an animal’s intake. There are other taste-sensitive peripheral nerves, and the results of a 48-h drinking test may also be influenced by a number of other variables including post-ingestive effects. Thus, it is not surprising that the amount of activity that we observed in the chorda tympani of B6 and 129 mice does not always offer a direct correspondence with their drinking of the same solutions (see accompanying behavioral manuscript). For example, behavioral preference thresholds were generally lower than neural thresholds in both strains of mice. Also, the magnitude of the strain differences in chorda tympani responding to some compounds (e. g., NaSaccharin) was smaller than the magnitude of the corresponding behavioral differences. In part, this probably reflects the fact that other gustatory nerves besides the chorda tympani influence a mouse’s ingestive behavior. In addition, our neural data was based on the response of the whole chorda tympani, whereas behavioral data may be influenced by responding in only a subset of fibers.
Nevertheless, there were several compounds for which neural sensitivities were higher in B6 than in 129 mice, and this most likely contributed to the higher behavioral sensitivities for those compounds. This was clearest for the non-amino acid sweeteners. B6 mice had lower thresholds for neural responding to sucrose, maltose, D-sorbitol, acesulfame-K, SC-45647 and sucralose, and their preference thresholds were also lower for these compounds in behavioral testing. All of these stimuli, along with NaSaccharin, evoked larger chorda tympani responses in the B6 strain and also (with the exception of D-sorbitol) were consumed more avidly by B6 mice.
Our recordings were made from only afferent chorda tympani fibers. Therefore the strain differences in these recordings must be due to some peripheral event, either occurring in the chorda tympani itself or in the taste receptor cells that provide its input. Prior research with F2 hybrids of B6 and 129 mice indicates that over 50 % of the variance in sucrose intake between these two strains can be accounted for by two loci on distal chromosome 4, which most likely correspond to dpa and Sac. The former locus also influenced the neural response threshold to sucrose in the chorda tympani, whereas the latter influenced suprathreshold responding (Bachmanov et al., 1997). Furthermore, variation in the Sac locus is strongly related to differences in consumption of sucrose and saccharin by the C57BL/6J (B6) and DBA/2J (D2) strains (Blizard et al., 1999), which also vary in their whole-nerve chorda tympani responding to these two solutions (Frank and Blizard, 1999). While the exact functions of Sac and dpa are not yet known, it is possible that they are involved in the transduction of non-amino acid sweeteners, and that variations in these loci caused the strain differences in responding that were observed in the present study.
The agreement between electrophysiology and behavior was poorer for the sweet-tasting amino acids. Although B6 mice have larger preferences than do 129 mice for glycine, D-phenylalanine, and L-proline (Capeless and Whitney, 1995; Bachmanov et al., accompanying manuscript), only L-proline evoked larger responses in the B6 group. It is unlikely that the discrepancy between the amino acids and the other stimuli can be explained by variation in taste quality. Although both B6 and 129 mice consume a smaller amount of sweet amino acids than of other sweeteners (Bachmanov et al., accompanying manuscript), all of the amino acids that we included are thought to taste sweet to most mice, as evidenced by two-bottle preference tests with water, generalization of a conditioned taste aversion to sucrose, and chorda tympani responding after pronase administration (Iwasaki et al., 1985; Kasahara et al., 1987; Ninomiya et al., 1992).
Thus, for most of the sweet amino acids tested, the reason for the variation in preference between B6 and 129 mice remains unknown. It is possible that there are strain differences in peripheral neural responding that were not noticed here because whole-nerve recording was used. Although this method is useful in indicating a nerve’s overall level of responsiveness, it may miss more subtle differences that are confined to particular fiber types. There are also other peripheral nerves besides the CT that are sweet responsive, and they may give different responses to sweet amino acids in the two strains. However, it is also possible that the underlying cause of the behavioral difference is not peripheral in origin. There is evidence that sweet-tasting amino acids may be transduced by a different mechanism than other sweeteners in mice and other rodents (Ninomiya et al., 1984b; Iwasaki and Sato, 1986; Yamada and Imoto, 1987; Uchida and Sato, 1997a; Uchida and Sato, 1997b). If so, then transduction of most sweet amino acids may not vary between B6 and 129 mice, and some other mechanism, such as differences in central responding or post-ingestive absorption, may be responsible for their different preferences.
Additional work is needed to assess the discrepancy that we observed between L-proline and the other amino acids tested. Although there is evidence that different sweet amino acids may activate separate transduction mechanisms (Ninomiya and Kajiura, 1993; Ninomiya et al., 1993), there is no precedent for a distinction between L-proline and other amino acids.
Aspartame and thaumatin did not evoke responses that could be distinguished from baseline in either strain. These substances taste sweet to humans, but generally appear to be neurally and behaviorally ineffective in rodents (Brouwer et al., 1973; Nowlis et al., 1980; Sclafani and Abrams, 1986; DeFrancisco and Dess, 1998; Bachmanov et al., accompanying manuscript), though thaumatin has been shown to evoke chorda tympani responses in the Slc:ICR strain of mice (Tonosaki et al., 1997).
Polycose is preferred by both B6 and 129 mice, with larger preferences in the B6 strain at concentrations between 0.1 and 3.0 % (Bachmanov et al., 2001). In the present study, chorda tympani responding to Polycose was greater in B6 than 129 mice, but only significantly so at 10 %, a concentration where their behavior does not differ. This inconsistency may result from Polycose ingestion being driven largely by post-ingestive factors, rather than by sweet taste. Definitive work has not been conducted to determine whether Polycose tastes sweet to mice, but the majority of research in other species of rodents indicates that Polycose possesses a taste quality distinct from sugars (Nissenbaum and Sclafani, 1987; Sclafani, 1991; Sako et al., 1994; Rehnberg et al., 1996), though there may also be perceptual similarities between them (Formaker et al., 1998).
Maltooligosaccharide was presented to only two subjects from each strain, which makes it difficult to draw strong conclusions. Nonetheless, mean responses to maltooligosaccharide closely matched those to Polycose in each strain, with B6 mice showing significantly greater responsiveness at 10 %. Although both stimuli consist of polymers of glucose molecules, those in maltooligosaccharide are almost exclusively 3–6 glucose molecules in length, whereas Polycose contains a much broader range of chain lengths, including approximately 9 % glucose and maltose. However, the similarity in responding to the two stimuli suggests that it is primarily the molecules of 3–6 glucose chains, and not the other polymers, that drive the evoked activity and cause the greater responsiveness of the B6 strain.
It is unlikely that the results were affected by our choice of NH4Cl as a reference stimulus. Relative responses to NH4Cl did not differ between strains when normalized to the absolute responses to four other chemicals (see Methods). We also obtained similar results using an alternate normalization procedure that did not depend on any one stimulus as a reference. Moreover, differences caused by the choice of a reference stimulus would tend to generalize across the entire stimulus array, whereas we only observed strain differences for responses to particular types of compounds.
In summary, B6 mice were found to have larger whole-nerve chorda tympani responses and lower neural response thresholds than 129 mice to a variety of sweet-tasting solutions. These differences were observed for both caloric and non-caloric sweeteners. However, the two strains did not differ on responding to sweet amino acids, with the exception of L-proline, which evoked larger responses in the B6 strain. Responses were also larger in B6 mice to the glucose polymers Polycose and maltooligosaccharide. Aspartame and thaumatin did not evoke responses that exceeded threshold in either strain. There was no consistent difference in responding between strains to representative salty, sour, and bitter compounds. Our results suggest that differences in sensory properties (“sweetness”) contribute to the greater preference shown by B6 mice for sweet solutions, with the possible exception of some amino acids.
Acknowledgments
The data for neural responses to NaSaccharin in experiment 1 (figure 2) have been published previously inLi et al. (2001). The authors thank Hoechst Food Ingredients (Edison, NJ) for providing Acesulfame-K, and Dr. Grant DuBois for generous gifts of sucralose, SC-45647, and thaumatin. Dr. Michael Tordoff provided insightful comments on an earlier version of this manuscript. This research was supported by National Institutes of Health grant DC 00882 from the National Institute on Deafness and Other Communicative Disorders (G. K. Beauchamp).
References
- Bachmanov AA, Reed DR, Ninomiya Y, Inoue M, Tordoff MG, Price RA, Beauchamp GK. Sucrose consumption in mice: major influence of two genetic loci affecting peripheral sensory responses. Mamm. Genome. 1997;8:545–548. doi: 10.1007/s003359900500. [DOI] [PMC free article] [PubMed] [Google Scholar]
- Bachmanov AA, Reed DR, Tordoff MG, Price RA, Beauchamp GK. Nutrient preference and diet-induced adiposity in C57BL/6ByJ and 129P3/J mice. Physiol. Behav. 2001;72:603–613. doi: 10.1016/s0031-9384(01)00412-7. [DOI] [PMC free article] [PubMed] [Google Scholar]
- Blizard DA, Kotlus B, Frank ME. Quantitative trait loci associated with short-term intake of sucrose, saccharin, and quinine solutions in laboratory mice. Chem. Senses. 1999;24:373–385. doi: 10.1093/chemse/24.4.373. [DOI] [PubMed] [Google Scholar]
- Brouwer JN, Hellekant G, Kasahara Y, Van Der Wel H, Zotterman Y. Electrophysiological study of the gustatory effects of the sweet proteins monellin and thaumatin in monkey, guinea pig and rat. Acta Physiol. Scand. 1973;89:550–557. doi: 10.1111/j.1748-1716.1973.tb05549.x. [DOI] [PubMed] [Google Scholar]
- Capeless CG, Whitney G. The genetic basis of preference for sweet substances among inbred strains of mice: preference ratio phenotypes and the alleles of the Sac and dpa loci. Chem. Senses. 1995;20:291–298. doi: 10.1093/chemse/20.3.291. [DOI] [PubMed] [Google Scholar]
- DeFrancisco JC, Dess NK. Aspartame consumption in rats selectively bred for high versus low saccharin intake. Physiol. Behav. 1998;65:393–396. doi: 10.1016/s0031-9384(98)00215-7. [DOI] [PubMed] [Google Scholar]
- Feigin MB, Sclafani A. Species differences in polysaccharide and sugar taste preferences. Neurosci. Biobehav. Rev. 1987;11:231–240. doi: 10.1016/s0149-7634(87)80031-3. [DOI] [PubMed] [Google Scholar]
- Formaker BK, Kearns CE, Frank ME. The taste of Polycose in hamsters. Chem. Senses. 1998;23:675–682. doi: 10.1093/chemse/23.6.675. [DOI] [PubMed] [Google Scholar]
- Frank ME, Blizard DA. Chorda tympani responses in two inbred strains of mice with different taste preferences. Physiol. Behav. 1999;67:287–297. doi: 10.1016/s0031-9384(99)00071-2. [DOI] [PubMed] [Google Scholar]
- Fuller JL. Single-locus control of saccharin preference in mice. J. Hered. 1974;65:33–36. doi: 10.1093/oxfordjournals.jhered.a108452. [DOI] [PubMed] [Google Scholar]
- Hoshishima K, Yokoyama S, Seto K. Taste sensitivity in various strains of mice. Am. J. Physiol. 1962;202:1200–1204. doi: 10.1152/ajplegacy.1962.202.6.1200. [DOI] [PubMed] [Google Scholar]
- Iwasaki K, Sato M. Inhibition of taste responses to sugars and amino acids by cupric and zinc ions in mice. Chem. Senses. 1986;11:79–88. [Google Scholar]
- Iwasaki K, Kasahara T, Sato M. Gustatory effectiveness of amino acids in mice: behavioral and neurophysiological studies. Physiol. Behav. 1985;34:531–542. doi: 10.1016/0031-9384(85)90045-9. [DOI] [PubMed] [Google Scholar]
- Kasahara T, Iwasaki K, Sato M. Taste effectiveness of some D- and L- amino acids in mice. Physiol. Behav. 1987;39:619–624. doi: 10.1016/0031-9384(87)90162-4. [DOI] [PubMed] [Google Scholar]
- Li X, Inoue M, Reed DR, Huque T, Puchalski RB, Tordoff MG, Ninomiya Y, Beauchamp GK, Bachmanov AA. High-resolution genetic mapping of the saccharin preference locus (Sac) and the putative sweet taste receptor (T1R1) gene (Gpr70) to mouse distal Chromosome 4. Mamm. Genome. 2001;12:13–16. doi: 10.1007/s003350010236. [DOI] [PMC free article] [PubMed] [Google Scholar]
- Lush IE. The genetics of tasting in mice. VI. Saccharin, acesulfame, dulcin, and sucrose. Genet. Res. 1989;53:95–99. doi: 10.1017/s0016672300027968. [DOI] [PubMed] [Google Scholar]
- Marks-Kaufman R, Hamm MW, Barbato GF. The effects of dietary sucrose on opiate receptor binding in genetically obese (ob/ob) and lean mice. J. Am. Coll. Nutr. 1989;8:9–14. doi: 10.1080/07315724.1989.10720272. [DOI] [PubMed] [Google Scholar]
- Mook DG. Oral and postingestional determinants of the intake of various solutions in rats with esophageal fistulas. J. Comp. Physiol. Psych. 1963;56:645–659. [Google Scholar]
- Ninomiya Y, Kajiura H. Enhancement of murine gustatory neural responses to D-amino acids by saccharin. Brain Res. 1993;626:287–294. doi: 10.1016/0006-8993(93)90589-f. [DOI] [PubMed] [Google Scholar]
- Ninomiya Y, Tonosaki K, Funakoshi M. Gustatory neural response in the mouse. Brain Res. 1982;244:370–373. doi: 10.1016/0006-8993(82)90100-7. [DOI] [PubMed] [Google Scholar]
- Ninomiya Y, Mizukoshi T, Higashi T, Katsukawa H, Funakoshi M. Gustatory neural responses in three different strains of mice. Brain Res. 1984a;302:305–314. doi: 10.1016/0006-8993(84)90244-0. [DOI] [PubMed] [Google Scholar]
- Ninomiya Y, Tetsuichiro H, Katsukawa H, Mizukoshi T, Funakoshi M. Qualitative discrimination of gustatory stimuli in three different strains of mice. Brain Res. 1984b;322:83–92. doi: 10.1016/0006-8993(84)91183-1. [DOI] [PubMed] [Google Scholar]
- Ninomiya Y, Nomura T, Katsukawa H. Genetically variable taste sensitivity to D-amino acids in mice. Brain Res. 1992;596:349–352. doi: 10.1016/0006-8993(92)91571-u. [DOI] [PubMed] [Google Scholar]
- Ninomiya Y, Kajiura H, Mochizuki K. Differential taste responses of mouse chorda tympani and glossopharyngeal nerves to sugars and amino acids. Neurosci. Lett. 1993;163:197–200. doi: 10.1016/0304-3940(93)90381-t. [DOI] [PubMed] [Google Scholar]
- Nissenbaum JW, Sclafani A. Qualitative differences in polysaccharide and sugar tastes in the rat: a two-carbohydrate taste model. Neurosci. Biobehav. Rev. 1987;11:187–196. doi: 10.1016/s0149-7634(87)80025-8. [DOI] [PubMed] [Google Scholar]
- Nowlis GH, Frank ME, Pfaffmann C. Specificity of acquired aversions to taste qualities in hamsters and rats. J. Comp. Physiol. Psychol. 1980;94:932–942. doi: 10.1037/h0077809. [DOI] [PubMed] [Google Scholar]
- Reed DR, Bachmanov AA, Beauchamp GK, Tordoff MG, Price RA. Heritable variation in food preferences and their contribution to obesity. Behav. Genet. 1997;27:373–387. doi: 10.1023/a:1025692031673. [DOI] [PMC free article] [PubMed] [Google Scholar]
- Rehnberg BG, MacKinnon BI, Hettinger TP, Frank ME. Analysis of polysaccharide taste in hamsters: behavioral and neural studies. Physiol. Behav. 1996;59:505–516. doi: 10.1016/0031-9384(95)02092-6. [DOI] [PubMed] [Google Scholar]
- Sako N, Shimura T, Komure M, Mochizuki R, Marsuo R, Yamamoto Y. Differences in taste responses to Polycose and common sugars in the rat as revealed by behavioral and electrophysiological studies. Physiol. Behav. 1994;56:741–745. doi: 10.1016/0031-9384(94)90236-4. [DOI] [PubMed] [Google Scholar]
- Sako N, Ninomiya Y, Fukami Y. Analysis of concentration response relationship for enhanced sugar responses of the chorda tympani nerve in the diabetic db/db mouse. Chem. Senses. 1996;21:59–63. doi: 10.1093/chemse/21.1.59. [DOI] [PubMed] [Google Scholar]
- Sclafani A. Starch and sugar tastes in rodents: an update. Brain Res. Bull. 1991;27:383–386. doi: 10.1016/0361-9230(91)90129-8. [DOI] [PubMed] [Google Scholar]
- Sclafani A, Abrams M. Rats show only a weak preference for the artificial sweetener aspartame. Physiol. Behav. 1986;37:253–256. doi: 10.1016/0031-9384(86)90228-3. [DOI] [PubMed] [Google Scholar]
- Tonosaki K, Miwa K, Kanemura F. Gustatory receptor cell responses to the sweeteners, monellin and thaumatin. Brain Res. 1997;748:234–236. doi: 10.1016/s0006-8993(96)01360-1. [DOI] [PubMed] [Google Scholar]
- Uchida Y, Sato T. Changes in outward K+ currents in response to two types of sweeteners in sweet taste transduction of gerbil taste cells. Chem. Senses. 1997a;22:163–169. doi: 10.1093/chemse/22.2.163. [DOI] [PubMed] [Google Scholar]
- Uchida Y, Sato T. Intracellular calcium increase in gerbil taste cell by amino acid sweeteners. Chem. Senses. 1997b;22:83–91. doi: 10.1093/chemse/22.1.83. [DOI] [PubMed] [Google Scholar]
- Yamada H, Imoto T. Inhibitory effect of the extract from Zizyphus jujube leaves on sweet taste responses of the chorda tympani in the rat and the hamster. Comp. Biochem. Physiol. 1987;2:355–360. doi: 10.1016/0300-9629(87)90497-x. [DOI] [PubMed] [Google Scholar]
- Yamamoto T, Sako N, Maeda S. Effects of taste stimulation on beta-endorphin levels in rat cerebrospinal fluid and plasma. Physiol. Behav. 2000;69:345–350. doi: 10.1016/s0031-9384(99)00252-8. [DOI] [PubMed] [Google Scholar]