Abstract
Daily fluid intakes were measured using two-bottle tests in female mice of inbred strains with high (BPH/2), normal (BPN/3) or low (BPL/1) blood pressure. The mice were offered a choice between water and different concentrations of NaCl (37.5–600 mM), KCl (1–400 mM), CaCl2 (1–100 mM) and quinine hydrochloride (0.003–1.0 mM). Compared with the normotensive strain, the hypertensive mice had higher water and total fluid intakes, and lower intakes of NaCl, KCl (only 200 mM) and quinine; the hypotensive mice had higher intakes of KCl (only 10–50 mM) and lower intakes of CaCl2 and quinine. These data suggest that fluid and salt intake are not linearly related to blood pressure, but are independently determined in these strains. Certain concentrations of the salts were preferred relative to water, which depended on mouse genotype: the BPN/3 and BPL/1 mice strongly preferred 37.5–150 mM NaCl, the BPL/1 mice preferred 10–100 mM KCl, and the BPN/3 mice preferred 1–10 mM CaCl2.
Keywords: Hypertension, Hypotension, Mice, Taste Preference, NaCl, KCl, CaCl2, Bitter
ARTERIAL hypertension in various rat models is often accompanied by changes in voluntary consumption of water and electrolytes (1,5,9–17,20,28,33). In the mouse, three inbred strains differing in blood pressure have been produced by selective breeding: hypertensive BPH/2 (BPH), normotensive BPN/3 (BPN) and hypotensive BPL/1 (BPL) strains (25). However consumption of water or electrolytes has not been studied in these mice. Here, we compared water intake and acceptance of NaCl, KCl and CaCl2 by the BPH, BPN and BPL mice. Because KCl and CaCl2 have a bitter taste to humans and probably other animals (6,22,30), we also tested the mice with quinine hydrochloride in order to probe whether strain differences in bitter taste sensitivity affect KCl and CaCl2 acceptance.
METHOD
Subjects
Female mice of the BPH (n = 18), BPN (n = 20) and BPL (n = 16) strains were bred at the University of Kansas and shipped to the Monell Chemical Senses Center. The mice were 5–13 weeks old when testing began. They were housed in individual cages in a temperature-controlled room at 23°C on a 12-h light:12-h dark cycle, and had free access to deionized water and Teklad Rodent Diet 8604, which contains 0.31% sodium, 0.99% potassium and 1.46% calcium.
Measurement of Fluid Intake
Fluid intake was measured using two-bottle preference tests of individually caged mice. Construction of drinking tubes and other experimental details have been previously described (2). The drinking tubes were positioned to the right of the feeder with their tips 15 mm apart, and each extended 25 mm into the cage. Each tube had a stainless steel tip with a 3.175-mm diameter hole from which the mice could lick fluids.
Solutions of 37.5, 75, 150, 300, 450 and 600 mM NaCl, 1, 10, 50, 100, 200 and 400 mM KCl, 1, 10, 30 and 100 mM CaCl2, and 0.003, 0.01, 0.03, 0.1, 0.3 and 1.0 mM quinine hydrochloride (Sigma Chemical Co.) were prepared in deionized water. The mice were presented with one tube containing a solution and the other tube containing deionized water. The positions of the tubes were switched every 24 h in order to control for side preferences. Daily measurements were made in the middle of the light period by reading fluid volume to the nearest 0.2 mL. Body weights (BW) of individual mice were measured before and after each test series, averaged, and used to calculate relative fluid intake.
After arriving in the laboratory, the animals were allowed to habituate for 4 days to individual cages with deionized water available in both drinking tubes. Then, daily water intake was measured for 2 days. Beginning on the next day, NaCl solutions were presented in increasing concentrations to 10 BPH, 10 BPN and 8 BPL mice, and in decreasing concentrations to 8 BPH, 10 BPN and 8 BPL mice, in 48-h tests together with water. Because earlier work suggested that NaCl consumption may be affected by previous experience with NaCl (3,4), we conducted additional tests using two concentrations of NaCl presented for a longer time. After completion of the ascending or descending NaCl series, all mice received 300 mM NaCl (together with water) for 6 days, and then 75 mM NaCl (together with water) for 8 days. After that, series of KCl, CaCl2 and quinine solutions were presented to all mice in increasing concentrations in 48-h tests together with water. Between each test series, mice were offered water to drink for at least 2 days to offset any carry-over effects.
Data Analyses
Indexes of fluid acceptance were calculated using average daily (24-h) fluid intakes for each mouse for each solution concentration. We determined: a) raw intakes per mouse; b) intakes per 30 g of BW (approximate weight of an adult mouse); and c) preference scores [the ratio of the averaged solution intake to averaged total fluid (solution + water) intake in percent].
Results of the experiment with ascending and descending NaCl concentrations were analyzed using three-way ANOVAs with strain and order of solution presentation as between-group factors and concentration as a within-group factor. The results of the experiments with ascending KCl, CaCl2 and quinine concentrations were analyzed using two-way ANOVAs with strain as a between-group factor and concentration as a within-group factor. When water alone or single (300 mM or 75 mM) NaCl concentrations were tested, a one-way ANOVA was used to assess the effect of strain. Tukey honestly significant difference post hoc tests for unequal sample sizes (Spjotvoll & Stoline tests) were used to evaluate differences between individual means. The significance of preference/avoidance of a solution over water in the two-bottle tests was determined by comparing the solution and water intakes using paired t-tests. Avoidance thresholds were determined as the lowest solution concentrations that were consumed in significantly smaller amounts than water. All statistical tests used a two-tailed criterion for significance of p < 0.05.
RESULTS
Body Weight
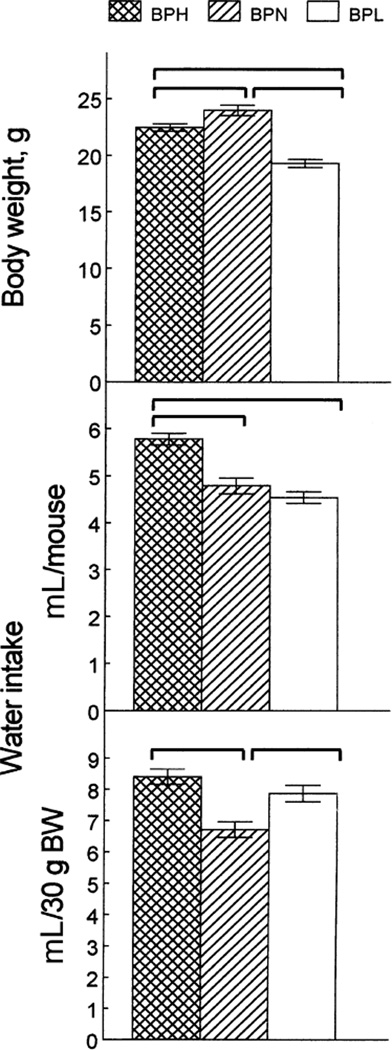
The mice from the three strains differed in BW [Fig. 1, top; effect of strain F(2, 51) = 35.0, p < 0.0001], with the BPN mice being the heaviest, the BPH mice being intermediate and the BPL mice being the lightest (significant difference between the individual means, p < 0.05, post hoc tests).
FIG. 1.
Body weights (top) and water intakes per mouse (middle) and per 30 g of body weight (BW; bottom) of BPH, BPN and BPL mice. Vertical bars represent SE. Horizontal brackets show significant differences (p < 0.05, post hoc tests).
Water Intake
Consumption of water given for 2 days as the only fluid in both drinking tubes (before NaCl was first presented) varied among the strains. The strains were distributed differently depending on whether raw intakes [Fig. 1, middle; effect of strain F(2, 51) = 20.0, p < 0.0001] or intakes per BW [Fig. 1, bottom; effect of strain F(2, 51) = 12.9, p < 0.0001] were analyzed. The BPH mice had the highest raw water intake, the BPN and BPL mice had similar raw water intakes. Water intake per BW was similar in the BPH and BPL mice, and it was lower in the BPN mice.
Relationships among Body Weight and Fluid Intakes
Because previous studies have shown that heavier mice usually drink more fluid than lighter mice, which may affect strain comparisons [see (3) for detailed discussion], we assessed the relation-ships among BW and fluid intakes. Correlations between BW and intakes of water (when only water was given) or total fluid (in preference tests) were calculated using all 54 mice from the three strains. The correlations of BW with raw intakes were positive (r between +0.13 and +0.42), and those with intakes expressed per BW were negative (r between −0.11 and −0.48; most of the correlations were significant,p < 0.05). Similar relationships were observed when the correlations were calculated for each strain separately. Therefore, both raw intakes and intakes corrected for BW are affected by BW. Consequently, we present both indexes here.
Animals that drank the most water when this was given alone also drank the most water and total fluid in preference tests (r between +0.09 and +0.79, in most cases p < 0.05; data for all 54 mice from the three strains). There was no consistent correlation between intake of water given alone and intakes of NaCl, KCl and quinine in preference tests (r between −0.28 and +0.29, in most cases nonsignificant). Because strain distributions for water intake (given alone) and CaCl2 preference were similar, water intake correlated with CaCl2 intake positively (r between +0.30 and + 0.46, p < 0.05).
NaCl
Ascending and descending series
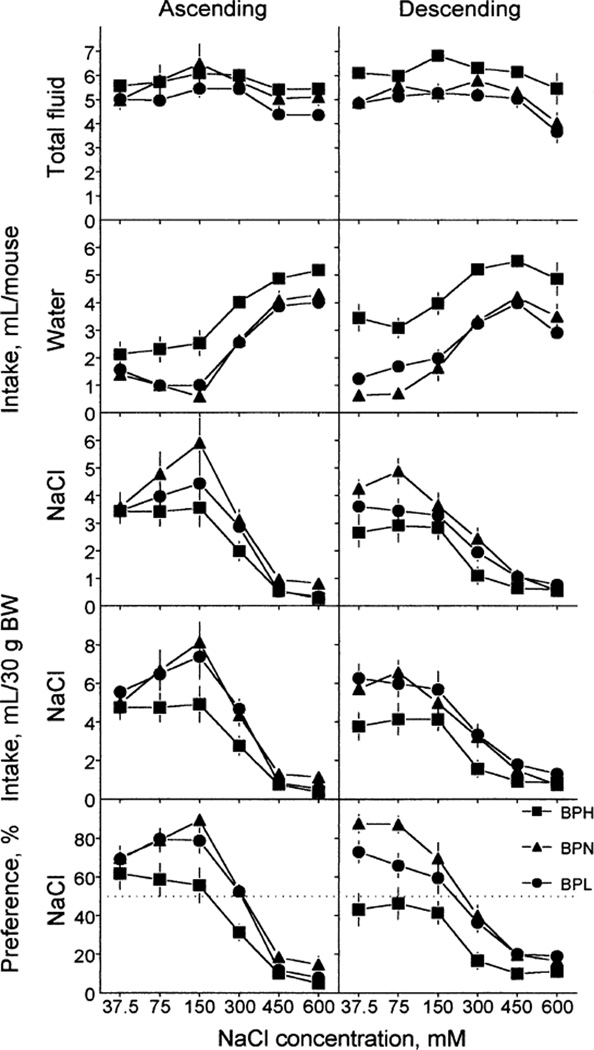
The results of tests using ascending and descending NaCl concentrations are presented in Fig. 2, and corresponding ANOVA results are given in Table 1. NaCl concentration influenced all indexes (significant effect of concentration). The results were similar in the ascending and descending series (no significant effect of order of presentation), except for water intake, which was higher overall in the descending series than in the ascending series.
FIG. 2.
Fluid intake (upper four rows) and NaCl preference (bottom row) of BPH, BPN and BPL mice. NaCl solutions were tested in the ascending (left) or descending (right) order of concentrations. Each concentration was tested in a 48-h test. Intakes were expressed per mouse (top three rows) or per 30 g of body weight (fourth row). Vertical bars represent SE.
TABLE 1.
Anova Results for Ascending and Descending Nacl Concentrations Tests
| Effect | Total fluid intake/mouse |
Water intake/mouse |
NaCl intake/ mouse |
NaCl intake/30 g BW |
NaCl preference |
|
|---|---|---|---|---|---|---|
| Strain | F(2, 48) = | 6.13** | 49.9** | 6.01** | 6.84** | 19.2*** |
| Order | F(1, 48) = | 0.00 | 5.34* | 2.03 | 1.63 | 2.49 |
| Concentration | F(5, 240) = | 20.1*** | 136.3*** | 128.5*** | 138.7*** | 225.4*** |
| Strain × Order | F(2, 48) = | 1.05 | 3.06 | 0.04 | 0.16 | 0.71 |
| Strain × Concentration | F(10, 240) = | 1.09 | 1.84 | 1.88* | 1.90* | 3.28*** |
| Order × Concentration | F(5, 240) = | 3.65** | 9.22*** | 5.56*** | 5.79*** | 7.82*** |
| Strain × Order × Concentration | F(10, 240) = | 1.08 | 1.14 | 1.41 | 1.28 | 2.41** |
p < 0.05,
p < 0.01, and
p < 0.001.
All indexes revealed significant differences among the strains (significant effect of strain). Across all NaCl concentrations, total fluid intake was the highest in the BPH strain and the lowest in the BPL strain; the BPN strain was intermediate and did not differ significantly from the other two strains. The BPH mice drank more water than did the BPN and BPL mice; the latter two did not differ significantly.
Strain differences in NaCl intake and preference depended on concentration (significant strain × concentration interaction). The BPN mice had significantly higher raw NaCl intakes than did the BPH mice at 75–300 mM concentrations; the BPL mice were intermediate between the two strains and did not significantly differ from either strain. NaCl intake per BW was higher in the BPN (for 75 and 150 mM) and BPL (for 75–300 mM) strains than in the BPH strain; the BPN and BPL strains did not differ significantly. Similarly, preferences for 37.5–300 mM NaCl were higher in the BPN and BPL mice than in the BPH mice; the first two did not differ significantly.
In both the ascending and the descending series, the BPH mice were indifferent to 37.5–150 mM NaCl and avoided 300–600 mM NaCl (drank significantly less NaCl than water, p < 0.05, paired t-tests). The BPN mice preferred 37.5–150 mM NaCl, were indifferent to 300 mM NaCl, and avoided 450 and 600 mM NaCl in both series. The BPL mice in the ascending series preferred 37.5–150 mM NaCl, were indifferent to 300 mM NaCl, and avoided 450 and 600 mM NaCl; in the descending series, they preferred 37.5 and 75 mM NaCl, were indifferent to 150 mM NaCl and avoided 300–600 mM NaCl. Therefore, NaCl avoidance thresholds were highest in the BPN and lowest in the BPH strain (Table 2).
TABLE 2.
Avoidance Thresholds* of BPH, BPL and BPN Mice
| Threshold (mM) |
Difference relative to BPN |
|||||
|---|---|---|---|---|---|---|
| Solution | BPH | BPN | BPL | Strain ranking | BPH | BPL |
| NaCl (ascending) | 300 | 450 | 450 | BPN = BPL > BPH | ↓ | |
| NaCl (descending) | 300 | 450 | 300 | BPN > BPL = BPH | ↓ | ↓ |
| KCl | 200 | 400 | 200 | BPN > BPL = BPH | ↓ | ↓ |
| CaCl2 | 30 | 30 | 10 | BPH = BPN > BPL | ↓ | |
| Quinine | 0.003 | 0.1 | 0.3 | BPN > BPL > BPH | ↓ | ↓ |
Avoidance thresholds were determined as the lowest solution concentrations that were consumed in significantly smaller amounts than water.
(↓) Avoidance threshold is lower than that of the BPN strian.
300 mM and 75 mM NaCl
After testing NaCl acceptance in the ascending and descending series, the mice were given 300 mM NaCl for 6 days and 75 mM NaCl for 8 days in two-bottle tests, separated by 2 days with only water available. There were no, or only small, changes of NaCl intake and preference during the 6- or 8-day periods of access to NaCl. Strain distributions remained the same over each of the periods. Therefore, the data for each NaCl concentration were averaged and expressed per day.
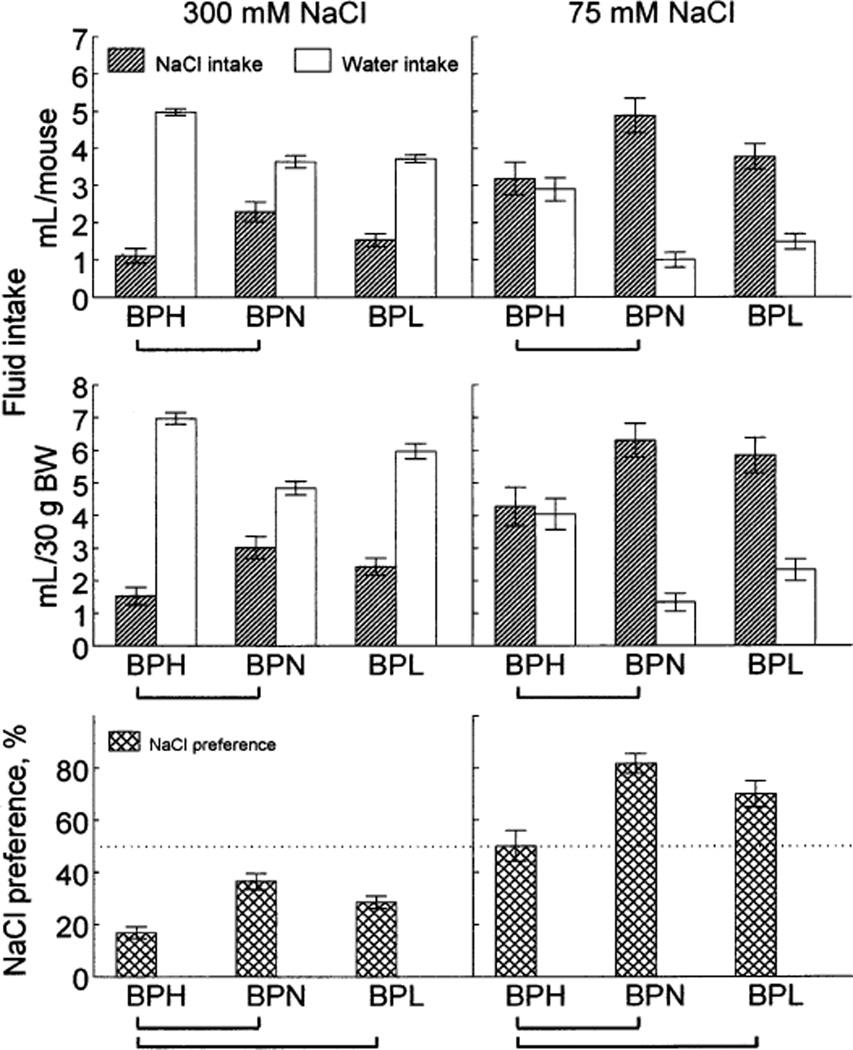
The three strains significantly differed in NaCl raw intake, intake per BW, and preference [effects of strain correspondingly F(2,51) = 7.55, 6.55 and 13.7 for 300 mM NaCl and 4.32, 3.81 and 11.0 for 75 mM NaCl,p < 0.05]. Raw intakes (Fig. 3, top) and intakes per body weight (Fig. 3, middle) were higher in the BPN than in the BPH mice for both 300 mM and 75 mM NaCl. The BPL mice were intermediate between them and did not differ significantly from either strain. Preferences for 300 mM and 75 mM NaCl (Fig. 3, bottom) were higher in the BPN and BPL than in the BPH strain, the first two strains did not significantly differ from each other.
FIG. 3.
Average daily NaCl and water intakes per mouse (top), per 30 g of BW (middle), and NaCl preference (bottom) by BPH, BPN and BPL mice. Vertical bars represent SE. Horizontal brackets show significant differences (p < 0.05, post hoc tests).
All mice avoided 300 mM NaCl relative to water. The 75 mM NaCl was neutral to the BPH strain and it was preferred by the BPN and BPL strains.
Overall, NaCl intakes and preferences in the ascending/descending and single concentration series were highest in the BPN and lowest in the BPH strain, with the BPL strain being intermediate, but closer to BPN (the results are summarized in Table 3).
TABLE 3.
Strain Differences in Solution Intake and Preference
| Difference relative to BPN |
|||
|---|---|---|---|
| Solution | Strain ranking | BPH | BPL |
| Water (only)/BW | BPH ≈ BPL > BPN | ↑ | ↑ |
| Water (only)/mouse | BPH > BPN ≈ BPL | ↑ | |
| Total fluid intake/mouse | BPH > BPN ≥ BPL | ↑ | |
| NaCl | BPN ≥ BPL > BPH | ↓ | |
| KCl (10–50 mM) | BPL ≥ BPH ≥ BPN | ↑ | |
| KCl (200 mM) | BPN > BPL ≥ BPH | ↓ | |
| CaCl2 | BPH ≈ BPN > BPL | ↓ | |
| Quinine | BPN > BPH ≈ BPL | ↓ | ↓ |
(↑) Intake and/or preference are higher than those of the BPN strain.
(↓) intake and/or preference are lower than those of the BPN strain.
KCl
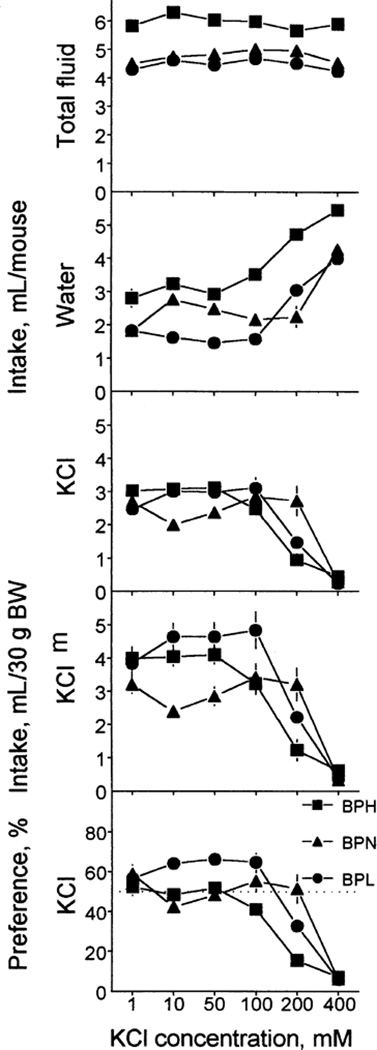
Fluid intakes and KCl preference depended on KCl concentration (Table 4; Fig. 4). Across all KCl concentrations tested, total fluid intake was significantly higher in the BPH strain than in the BPN and BPL strains; the latter two strains consumed similar amounts of fluid. Strain variations in water intake were expressed differently at different KCl concentrations. The BPH mice drank more water than did the BPN mice at 100–400 mM KCl concentrations, and more than did the BPL mice at 10–400 mM. At 10 mM, the BPN mice drank more water than did the BPL mice.
TABLE 4.
Anova Results for Tests with Ascending Concentrations of KCl, CaCl2 and Quinine
| Solution | Effect | Total fluid intake/mouse |
Water intake/mouse |
Solution intake/mouse |
Solution intake/ 30 g BW |
Solution preference |
|
|---|---|---|---|---|---|---|---|
| KCl | Strain | F(2, 51) = | 29.3*** | 58.5*** | 0.08 | 5.99** | 14.5*** |
| Concentration | F(5, 255) = | 6.79*** | 65.0*** | 57.4*** | 63.3*** | 76.4*** | |
| Strain × Concentration | F(10, 255) = | 2.49** | 5.18*** | 6.25*** | 6.96*** | 6.24*** | |
| CaCl2 | Strain | F(2, 51) = | 55.7*** | 13.2*** | 14.2*** | 9.56*** | 10.3*** |
| Concentration | F(3, 153) = | 13.4*** | 82.9*** | 89.8*** | 91.6*** | 110.2*** | |
| Strain × Concentration | F(6, 153) = | 4.82*** | 4.17*** | 5.55*** | 5.54*** | 5.09*** | |
| Quinine | Strain | F(2, 51) = | 30.8*** | 20.2*** | 8.61*** | 2.41 | 10.5*** |
| Concentration | F(5, 255) = | 6.78*** | 36.8*** | 50.5*** | 55.8*** | 58.1*** | |
| Strain × Concentration | F(10, 255) = | 2.37* | 1.74 | 2.21** | 2.83* | 2.63** | |
p < 0.05,
p < 0.01, and
p < 0.001.
FIG. 4.
Fluid intake (upper four rows) and KCl preference (bottom row) of BPH, BPN and BPL mice. KCl solutions were tested in the ascending order of concentrations. Each concentration was tested in a 48-h test. Intakes were expressed per mouse (top three rows) or per 30 g of BW (fourth row). Vertical bars represent SE.
Raw KCl intakes of the three strains did not differ significantly at lower (1–100 mM) and the highest (400 mM) concentrations. Raw intake of 200 mM KCl was higher in the BPN strain than in the BPH or BPL strains (the latter two did not differ significantly). KCl intakes per BW of the BPN mice were lower than those of the BPH (at 10 mM) and BPL (at 10 and 50 mM) mice. The BPH mice drank less than did the BPL mice of 100 mM KCl, and they both drank less than did BPN mice of 200 mM KCl per BW. The BPL mice had a higher preference for 10 mM KCl than did the BPN mice, and higher preference for 100 mM KCl than did the BPH mice. The BPN mice had higher preference for 200 mM KCl than did the BPH mice. Overall, the strain distributions of KCl acceptance were different at lower and higher KCl concentrations: at lower (10–50 mM) concentrations, the BPL strain had higher scores than did the BPN strain, the BPH strain being intermediate; however differences in raw intakes were not significant for these KCl solutions. At the higher 200 mM concentration, the BPN strain had higher scores than did the BPH strain, with the BPL strain being intermediate (Table 3).
The BPH mice were indifferent to 1–100 mM KCl and avoided 200 and 400 mM KCl. The BPN mice were indifferent to 1–200 mM KCl and avoided 400 mM KCl. The BPL mice were indifferent to 1 mM KCl, preferred 10–100 mM KCl, and avoided 200 and 400 mM KCl. The avoidance threshold for KCl of the BPN strain was higher than that of the BPH and BPL strains (Table 2).
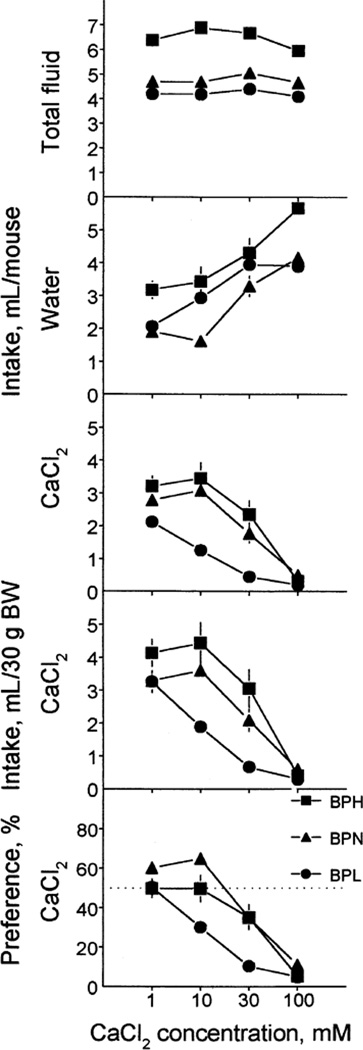
CaCl2
All indexes measured in tests with CaCl2 were significantly affected by strain differences, CaCl2 concentrations and their interactions (Table 4). Across all CaCl2 concentrations tested, the BPH mice drank significantly more total fluid than did the BPN and BPL mice, the BPN mice were intermediate (drank significantly less than the BPH and significantly more than the BPL mice), and the BPL mice drank significantly less than did the BPH or BPN mice (Fig. 5). The strain differences in water intake varied from concentration to concentration of CaCl2: the BPH mice drank more water than did the BPN mice at all CaCl2 concentrations, and more than did the BPL mice at 1 mM and 100 mM. The BPL mice drank more water given with 10 mM CaCl2 than did the BPN mice.
FIG. 5.
Fluid intake (upper four rows) and CaCl2 preference (bottom row) of BPH, BPN and BPL mice. CaCl2 solutions were tested in the ascending order of concentrations. Each concentration was tested in a 48-h test. Intakes were expressed per mouse (top three rows) or per 30 g of BW (fourth row). Vertical bars represent SE.
Raw CaCl2 intake by the BPL strain was lower than that of the BPH (for 1–30 mM solutions) and BPN (for 10 and 30mM solutions) strains. Raw CaCl2 intakes by the BPH and BPN strains were similar. For 10 and 30 mM CaCl2, intakes per BW and preferences were lower in the BPL than BPH or BPN strains; the latter two did not differ significantly. Overall, the BPH and BPN strains had higher indexes of CaCl2 acceptance than did the BPL strain (Table 3).
The BPH mice were indifferent to 1 and 10 mM CaCl2, and they avoided 30 and 100 mM CaCl2. The BPN mice preferred 1 and 10 mM CaCl2, and they avoided 30 and 100 mM CaCl2. The BPL mice were indifferent to 1 mM CaCl2 and they avoided 10–100 mM CaCl2. The CaCl2 avoidance thresholds of the BPH and BPN strains were higher than those of the BPL strain (Table 2).
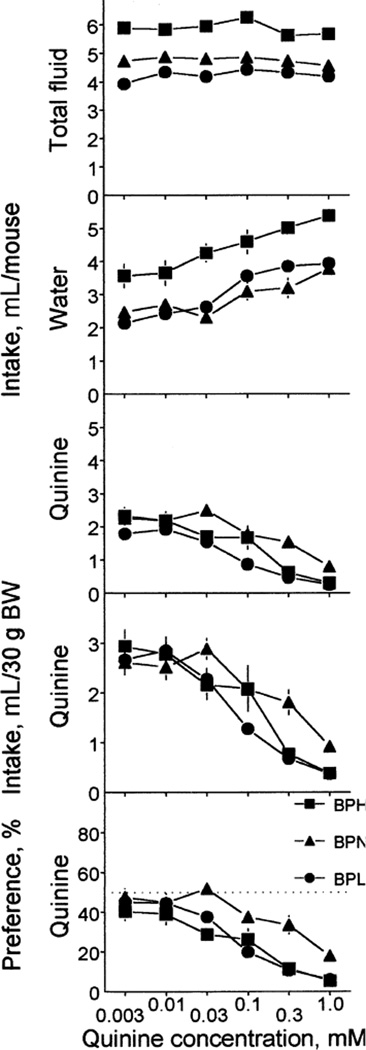
Quinine
All indexes measured in tests with quinine significantly changed with quinine concentrations (Table 4; Fig. 6). Across all quinine concentrations tested, total fluid intake was higher in the BPH strain than in the BPN and BPL strains. The BPN mice consumed significantly more total fluid than did the BPL mice at 0.003–0.03 mM quinine concentrations. Strain differences in water intake were the same for all quinine concentrations (no significant strain × concentration interaction): the BPH mice drank more water than did the BPN and BPL mice; the latter two did not differ.
FIG. 6.
Fluid intake (upper four rows) and quinine hydrochloride preference (bottom row) of BPH, BPN and BPL mice. Quinine solutions were tested in the ascending order of concentrations. Each concentration was tested in a 48-h test. Intakes were expressed per mouse (top three rows) or per 30 g of BW (fourth row). Vertical bars represent SE.
Raw quinine intakes were higher in the BPN strain than in the BPL (0.03–0.3 mM) or BPH (0.3 mM) strains; the latter two strains did not differ. Quinine intakes expressed per body weight were significantly different only for 0.3 mM solution: the BPN mice drank more of it than did the BPH and BPL mice. The BPN mice had higher quinine preference scores than did the BPH (0.03 and 0.3 mM) and BPL (0.1 and 0.3 mM) mice. Overall, the BPN strain had higher indexes of quinine acceptance than did the BPH or BPL strains (Table 3).
The BPH mice significantly avoided all quinine solutions tested. The BPN mice were indifferent to 0.003–0.03 mM quinine and avoided 0.1–1.0 mM quinine. The BPL mice were indifferent to 0.003 mM and 0.01 mM quinine and avoided 0.03–1.0 mM quinine. Avoidance thresholds were the highest in the BPN strain, intermediate in the BPL strain and the lowest in the BPH strain (Table 2).
DISCUSSION
This study shows that the inbred mouse strains selected for high, normal and low blood pressure differed in a variety of intake measures for NaCl, KCl, CaCl2 and quinine hydrochloride. The pattern of strain differences varied according to the taste compound tested. This suggests that the strain differences described here reflect specific taste and/or postingestive properties of the examined solutions, rather than generalized responses to taste novelty, or nonspecific differences in taste responsiveness.
The BPN and BPL mouse strains had strong preferences for 37.5–150 mM NaCl compared with the BPH strain tested here and mouse strains tested in other studies, which either only moderately preferred these NaCl concentrations, or did not prefer them at all (2–4,19,23). The BPH, BPN and BPL mice originate from a population derived from an eight-way cross of eight inbred mouse strains (25). Some of these progenitor strains (C57BL/6, CBA) strongly avoid NaCl, others (BALB/c, 129/J) are relatively indifferent to it or moderately prefer it (2–,4, 19,23). However NaCl preferences by the BPN and BPL mice appear to exceed those of their progenitors, at least those in which NaCl acceptance has been tested. This high NaCl preference by the BPN and BPL strains could be attributed to genetic loci inherited from the other progenitor strains with unknown NaCl acceptance (i.e., LP/J, SJL/J, RF/J and BDP/J), or explained by novel combinations of loci from the progenitor strains. However, some caution in interpretation is prudent because our findings are based on female mice whereas most previous studies involved males.
In the ascending NaCl concentration test series, the BPN mice drank on average 8.1 mL of 150 mM NaCl per 30 g of BW. This is a remarkable intake of saline, equivalent when corrected for body weight to ~80 mL for a 300-g rat. Even rats with a proclivity to drink NaCl rarely drink such large volumes when sodium replete (1,10,13,21).
In addition to being the first report of a strong voluntary NaCl preference by mice, this is the first detailed study of KCl and CaCl2 acceptance by mice [except (32), where only three KCl concentrations were tested]. These results provide new characteristics of salt acceptance in the mouse and together with the previous data (2–4,19,23,32), they show that the range of responses to sodium, potassium and calcium salts is similar in mouse and rat strains (1,8,21,28,29).
Responses of the BPH, BPN and BPL mice to quinine were within the range of variation of inbred mouse strains with avoidance thresholds between 0.001 and 0.8 mM (2,7,18,19,31). Quinine is a standard bitter compound, and both KCl and CaCl2 have bitter taste components to humans and probably to other animals (6,22,30). The finding that the BPH, BPN and BPL strains differed in their responses to quinine raises the possibility that the variation in bitter taste sensitivity contributes to the strain differences in acceptance of KCl and CaCl2. Consistent with this, the BPN mice were less sensitive to quinine and had higher acceptance of 200 mM KCl than did the BPH and BPL mice (Tables 2 and 3). However the strain distributions of responses to other KCl concentrations and to CaCl2 did not correlate with responsiveness to quinine and, therefore, cannot be explained by differences in sensitivity to quinine-like bitterness. The strain differences in response to 200 mM KCl were also similar to the strain differences in responses to NaCl (Tables 2 and 3), which could be due to the salty component of KCl taste in humans and other animals (22,24,27,34).
We found no strong evidence for a correlation between blood pressure and fluid consumption. The most consistent relationship between them was for raw water intake (when water was given alone, Fig. 1, middle) and for raw total fluid intakes (Figs. 2, 4–6), with the BPH mice drinking the most and BPL mice drinking the least fluid. However the intakes corrected for BW were distributed differently for water given alone (Fig. 1, bottom) and for total fluid intakes (BPH > BPL > BPN, data not shown). CaCl2 intakes were also highest in the BPH and lowest in the BPL mice, but this was not the case for CaCl2 preferences (Fig. 5). Therefore, it seems unlikely that blood pressure level itself affects fluid consumption in these three strains (or vice versa).
Relative to the normotensive BPN mice, the hypertensive BPH mice had increased water and total fluid intakes, and decreased acceptance of NaCl, 200 mM KCl and quinine. The hypotensive BPL mice had increased acceptance of 10–50 mM KCl and decreased acceptance of CaCl2 and quinine compared with the BPN strain. Several mechanisms could underlie these changes in fluid consumption, some of which may be associated with hyper-or hypotension, including differences among the BPH, BPN and BPL strains in kidney characteristics, renin-angiotensin and corticosteroid systems (A. A. Bachmanov et al., unpublished data), plasma viscosity and brain catecholamines (25,26). The independent changes in fluid consumption in the BPH and BPL strains are consistent with the results of genetic analyses, which indicate that hypertension in the BPH strain and hypotension in the BPL strain depend on different mechanisms (25). However support for relationships between these mechanisms and fluid consumption should be tempered, because these associations could also be due to independent genes affecting blood pressure and fluid consumption, which might have been fortuitously fixed during inbreeding of the mouse strains.
In experimental models of arterial hypertension in rats, changes in consumption of water (9,14,16), sodium (1,5,9,10,12,14, 15,17,20,28), potassium (1,12,15,20) and calcium (1,11,28) salts are found, but these changes are specific to particular models. For example, NaCl acceptance in some hypertensive models is increased (1,5,9,10,14,17,20,28), but in the other models it is decreased (14,15) or is unchanged (10,17). Consistent with these earlier studies, our data suggest that fluid acceptance is not a simple function of blood pressure.
ACKNOWLEDGMENTS
This research was supported by National Institutes of Health Grants DC00882 (G. K. B.) and DK40099 (M. G. T.).
Footnotes
Portions of this work were presented at the XXXIII International Congress of Physiological Sciences, St. Petersburg, Russia, July 1997.
REFERENCES
- 1.Bachmanov AA. The salt appetite of rats with spontaneous arterial hypertension. Fiziol. Zh. SSSR. 1989;75:942–947. (in Russian) [PubMed] [Google Scholar]
- 2.Bachmanov AA, Tordoff MG, Beauchamp GK. Ethanol consumption and taste preferences in C57BL/6ByJ and 129/J mice. Alcohol. Clin. Exp. Res. 1996;20:201–206. doi: 10.1111/j.1530-0277.1996.tb01630.x. [DOI] [PMC free article] [PubMed] [Google Scholar]
- 3.Bachmanov AA, Tordoff MG, Beauchamp GK. Voluntary sodium chloride consumption by mice: Differences among five inbred strains. Behav. Genet. 1998;28:117–124. doi: 10.1023/a:1021471924143. [DOI] [PMC free article] [PubMed] [Google Scholar]
- 4.Beauchamp GK, Fisher AS. Strain differences in consumption of saline solutions by mice. Physiol. Behav. 1993;54:179–184. doi: 10.1016/0031-9384(93)90063-l. [DOI] [PubMed] [Google Scholar]
- 5.Ben-Ishay D, Dikstein S, Shalita B. Sodium chloride preference in hypertensive (H) and normotensive (N) rats. Pflügers Arch. 1976;361:153–157. doi: 10.1007/BF00583459. [DOI] [PubMed] [Google Scholar]
- 6.Breslin PA, Beauchamp GK. Suppression of bitterness by sodium: variation among bitter taste stimuli. Chem. Senses. 1995;20:609–623. doi: 10.1093/chemse/20.6.609. [DOI] [PubMed] [Google Scholar]
- 7.Boughter JD, Harder DB, Capeless CG, Whitney G. Polygenic determination of quinine aversion among mice. Chem. Senses. 1992;17:427–434. [Google Scholar]
- 8.Coldwell SE, Tordoff MG. Acceptance of minerals and other compounds by calcium-deprived rats: 24-h tests. Am. J. Physiol. 1996;271:R1–R10. doi: 10.1152/ajpregu.1996.271.1.R1. [DOI] [PubMed] [Google Scholar]
- 9.Costales M, Fitzsimons JT, Vijande M. Increased sodium appetite and polydipsia induced by partial aortic occlusion in the rat. J. Physiol. (Lond.) 1984;352:467–481. doi: 10.1113/jphysiol.1984.sp015303. [DOI] [PMC free article] [PubMed] [Google Scholar]
- 10.Di Nicolantonio R, Mendelsohn FAO, Hutchinson JS. Sodium chloride preference of genetically hypertensive and normotensive rats. Am. J. Physiol. 1983;245:R38–R44. doi: 10.1152/ajpregu.1983.245.1.R38. [DOI] [PubMed] [Google Scholar]
- 11.Ferrell F, Dreith AZ. Calcium appetite, blood pressure and electrolytes in spontaneously hypertensive rats. Physiol. Behav. 1986;37:337–343. doi: 10.1016/0031-9384(86)90243-x. [DOI] [PubMed] [Google Scholar]
- 12.Ferrell F, Gray SD. Longitudinal study of salt preferences in normotensive and hypertensive rats. Hypertension. 1985;7:326–332. [PubMed] [Google Scholar]
- 13.Ferrell F, Lanou A, Gray SD. Salt level in weaning diet affects saline preference and fluid intake in Dahl rats. Hypertension. 1986;8:1021–1026. doi: 10.1161/01.hyp.8.11.1021. [DOI] [PubMed] [Google Scholar]
- 14.Forman S, Falk JL. NaCl solution ingestion in genetic (SHR) and aortic-ligation hypertension. Physiol. Behav. 1979;22:371–377. doi: 10.1016/0031-9384(79)90100-8. [DOI] [PubMed] [Google Scholar]
- 15.Fregly MJ. Specificity of sodium chloride aversion of hypertensive rats. Am. J. Physiol. 1959;196:1326–1332. doi: 10.1152/ajplegacy.1959.196.6.1326. [DOI] [PubMed] [Google Scholar]
- 16.Kraly FS, Moore AF, Miller LA, Drexler A. Nocturnal food-related hyperdipsia in the adult spontaneously hypertensive rat. Physiol. Behav. 1982;28:885–891. [PubMed] [Google Scholar]
- 17.Ledingham JM, Simpson FO, Hamada M. Salt appetite, body sodium, handling of a NaCl load, renin, and aldosterone in genetically and spontaneously hypertensive rats. J. Cardiovasc. Pharmacol. 1990;16(Suppl 7):S6–S8. [PubMed] [Google Scholar]
- 18.Lush IE. The genetics of tasting in mice. III. Quinine. Genet. Res. 1984;44:151–160. doi: 10.1017/s0016672300026355. [DOI] [PubMed] [Google Scholar]
- 19.Lush IE. The genetics of bitterness, sweetness, and saltiness in strains of mice. In: Wysocki CJ, Kare MR, editors. Chemical Senses, vol. 3. Genetics of Perception and Communication. New York: Marcel Dekker; 1991. pp. 227–241. [Google Scholar]
- 20.McConnell SD, Henkin RI. Increased preference for Na+ and K+ salts in spontaneously hypertensive (SH) rats. Proc. Soc. Exp. Biol. Med. 1973;143:185–188. doi: 10.3181/00379727-143-37282. [DOI] [PubMed] [Google Scholar]
- 21.Midkiff EE, Fitts DA, Simpson JB, Bernstein IL. Absence of sodium chloride preference in Fisher-344 rats. Am. J. Physiol. 1985;249:R438–R442. doi: 10.1152/ajpregu.1985.249.4.R438. [DOI] [PubMed] [Google Scholar]
- 22.Nachman M. Learned aversion to the taste of lithium chloride and generalization to other salts. J. Comp. Physiol. Psychol. 1963;56:343–349. doi: 10.1037/h0046484. [DOI] [PubMed] [Google Scholar]
- 23.Ninomiya Y, Sako N, Funakoshi M. Strain differences in amiloride inhibition of NaCl responses in mice, Mus musculus. J. Comp. Physiol. A. 1989;166:1–5. doi: 10.1007/BF00190204. [DOI] [PubMed] [Google Scholar]
- 24.Ossebaard CA, Smith DV. Effect of amiloride on the taste of NaCl, Na-gluconate and KCl in humans: implications for Na+ receptor mechanisms. Chem. Senses. 1995;20:37–46. doi: 10.1093/chemse/20.1.37. [DOI] [PubMed] [Google Scholar]
- 25.Schlager G. Genetic hypertension in mice. In: Ganten D, de Jong W, editors. Handbook of Hypertension, vol. 16. Experimental and genetic models of hypertension. Amsterdam: Elsevier; 1994. pp. 158–172. [Google Scholar]
- 26.Schlager G, Sides J. Characterization of hypertensive and hypotensive inbred strains of mice. Lab. Anim. Sci. 1997;47:288–292. [PubMed] [Google Scholar]
- 27.Spector AC, Guagliardo NA, St John SJ. Amiloride disrupts NaCl versus KCl discrimination performance: implications for salt taste coding in rats. J. Neurosci. 1996;16:8115–8122. doi: 10.1523/JNEUROSCI.16-24-08115.1996. [DOI] [PMC free article] [PubMed] [Google Scholar]
- 28.Tordoff MG. Influence of dietary calcium on sodium and calcium intake of spontaneously hypertensive rats. Am. J. Physiol. 1992;262:R370–R381. doi: 10.1152/ajpregu.1992.262.3.R370. [DOI] [PubMed] [Google Scholar]
- 29.Tordoff MG. Voluntary intake of calcium and other minerals by rats. Am. J. Physiol. 1994;267:R470–R475. doi: 10.1152/ajpregu.1994.267.2.R470. [DOI] [PubMed] [Google Scholar]
- 30.Tordoff MG. Some basic psychophysics of calcium salt solutions. Chem. Senses. 1996;21:417–424. doi: 10.1093/chemse/21.4.417. [DOI] [PubMed] [Google Scholar]
- 31.Whitney G, Harder DB. Genetics of bitter perception in mice. Physiol. Behav. 1994;56:1141–1147. doi: 10.1016/0031-9384(94)90358-1. [DOI] [PubMed] [Google Scholar]
- 32.Whitney G, Maggio JC, Harder DB. Manifestations of the major gene influencing sucrose octaacetate (SOA) tasting among mice: classic taste qualities. Chem. Senses. 1990;15:243–252. [Google Scholar]
- 33.Wolf G, Dahl LK, Miller NE. Voluntary sodium chloride intake of two strains of rats with opposite genetic susceptibility to experimental hypertension. Proc. Soc. Exp. Biol. Med. 1965;120:301–305. doi: 10.3181/00379727-120-30517. [DOI] [PubMed] [Google Scholar]
- 34.Ye Q, Heck GL, DeSimone JA. Effects of voltage perturbation of the lingual receptive field on chorda tympani responses to Na+ and K+ salts in the rat: implications for gustatory transduction. J. Gen. Physiol. 1994;104:885–907. doi: 10.1085/jgp.104.5.885. [DOI] [PMC free article] [PubMed] [Google Scholar]


